3 Hemorrhage
Parenchymal Hemorrhage
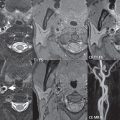
Hemorrhage has a specific but varied appearance on MR, dependent on time frame. The appearance is much more straightforward on CT. In normotensive young adults, vascular malformations are the most common cause of spontaneous hemorrhage. In adults, parenchymal hemorrhage is most often due to hypertension ( Fig. 3.1 ), whereas subarachnoid hemorrhage is commonly due to rupture of an intracranial aneurysm. Typical locations for hypertensive hemorrhage include, in order of decreasing frequency, the basal ganglia (in particular, the putamen), thalamus, pons, and cerebellar hemisphere. The descriptions of the appearance of hemorrhage in the literature are predominantly for parenchymal bleeds. To some extent, the appearance of subarachnoid hemorrhage is similar.
Hyperacute hemorrhage on CT is of moderate density, rapidly increasing further in density (attenuation) over the first few hours due to clot formation and retraction. After a few days, in the subacute time frame, a progressive loss in attenuation begins. By 1 to 4 weeks, a hematoma will be isodense to brain, and in the chronic phase may appear hypodense.
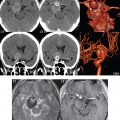
The subsequent description of hemorrhage on MR is for the field strengths of 1.5 and 3 T, covering the vast majority of clinical systems today. Magnetic susceptibility effects (T2*), which cause decreased signal intensity depending on the time frame of the hemorrhage, are much less evident at lower field strengths. On MR, hemorrhage follows a regular welldefined temporal progression of changes in signal intensity. Oxyhemoglobin (hyperacute) progresses to deoxyhemoglobin (acute), to intracellular methemoglobin (early subacute), then to extracellular methemoglobin (late subacute), and eventually to hemosiderin (chronic) ( Fig. 3.2 ).
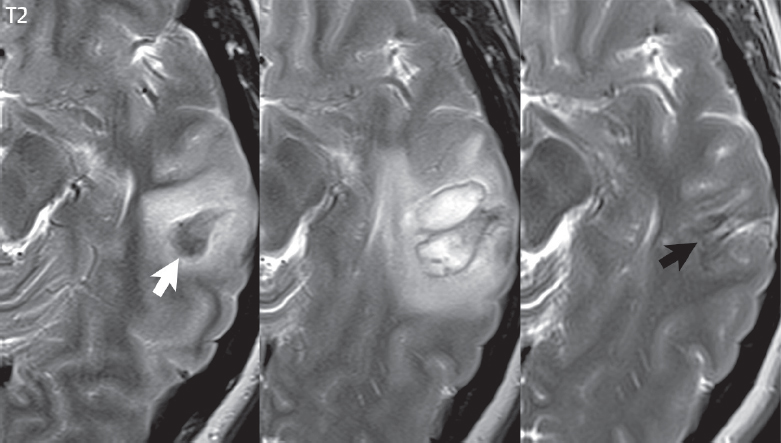
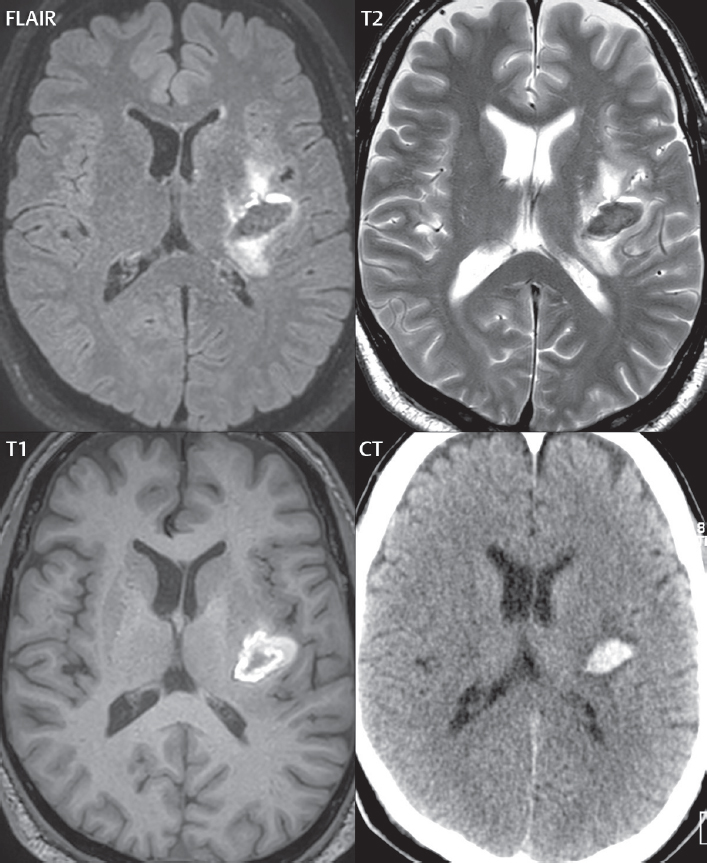
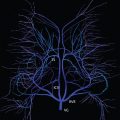
Oxyhemoglobin (hyperacute hemorrhage) has the signal intensity of fluid—high on T2and low on T1weighted scans. This imaging appearance is relatively nonspecific. Within hours, however, deoxyhemoglobin (acute hemorrhage) is evident with distinctive low signal intensity on T2weighted scans. Deoxyhemoglobin does not have a unique appearance on T1weighted scans, on which it appears isointense to mildly hypointense. Methemoglobin (subacute hemorrhage) has distinctive high signal intensity on T1weighted scans, and bleeds can be further subdivided temporally into intracellular and extracellular methemoglobin. Initially, in the intracellular phase, blood will be high signal intensity on a T1weighted scan and low signal intensity on a T2weighted scan (the latter due to a susceptibility effect). With red blood cell lysis, methemoglobin becomes extracellular in location, with distinctive high signal intensity on both T1- and T2weighted scans. With time, methemoglobin is converted into hemosiderin, with chronic hemorrhage thus exhibiting pronounced low signal intensity on T2weighted scans again due to susceptibility effects. The appearance of a chronic parenchymal hemorrhage on MR also depends on whether the central fluid collection is resorbed or not. If resorbed, a hemosiderin cleft will be left ( Fig. 3.3 ).
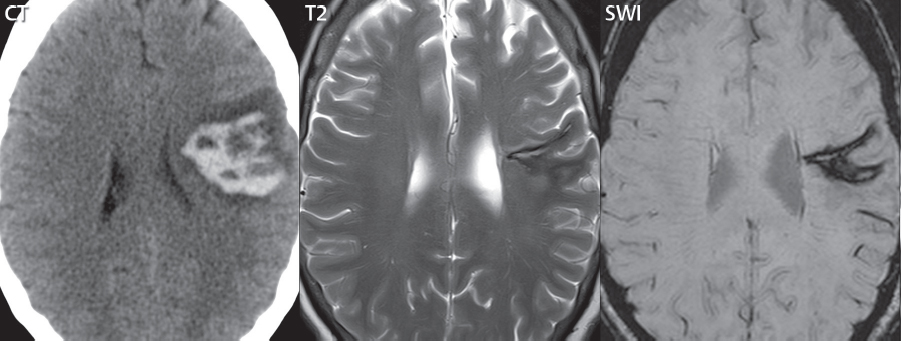
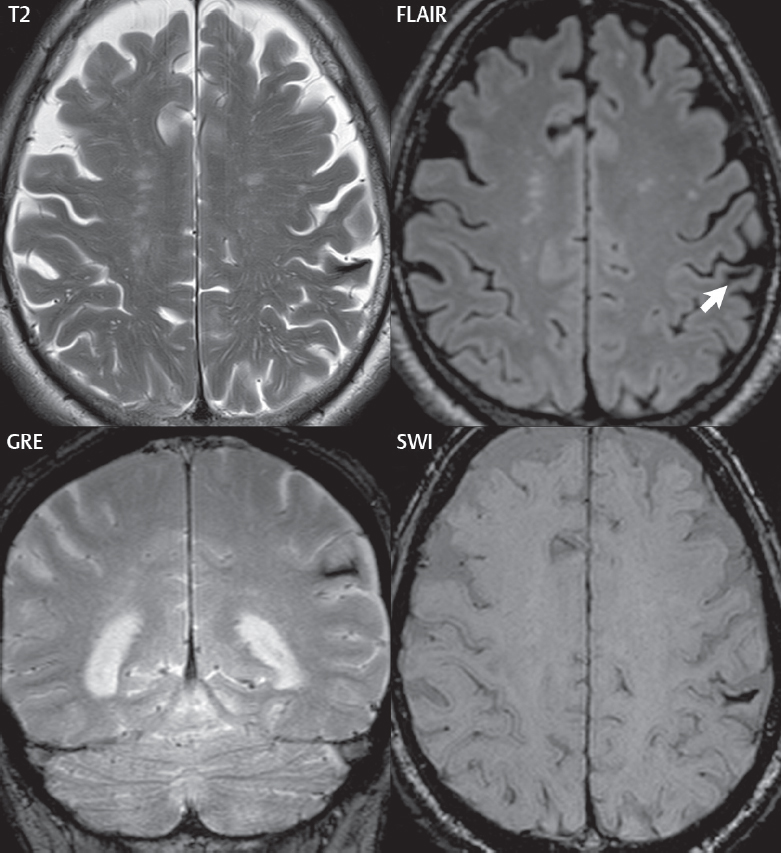
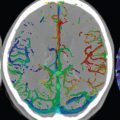
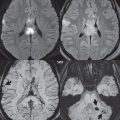
If not resorbed, there will be a central fluid collection with high signal intensity on both T1- and T2weighted scans, surrounded by a hemosiderin rim. With the passage of years, the fluid collection may change in appearance on T1weighted scans from high to low signal intensity. Although the appearance of chronic hemorrhage on MR, with low signal intensity on T2weighted scans, is generally well known, the relative sensitivity of different pulse sequences is often not as well understood ( Fig. 3.4 ). It is important to note that the evolution of parenchymal hemorrhage on MR does not always follow the characteristic pattern described. Additional factors can be very important, including dilution, clotting, and hematocrit. One key to the recognition of parenchymal hemorrhage, not discussed in detail, is the presence of edema surrounding the hematoma, which is seen in the hyperacute, acute, and early subacute stages.
Related posts:
Stay updated, free articles. Join our Telegram channel

Full access? Get Clinical Tree


