6.1 Introduction
For the past four decades, mammography screening has been the primary imaging method for detection of early breast cancer in the general female population. Mammography screening has been shown to save lives by reducing mortality from breast cancer. 1, 2, 3, 4 However, not every breast cancer is detected by this method, especially when dense breast tissue is evident on mammography. Mammograms are X-ray images of the breast using low doses of radiation and producing two-dimensional projection images. A limitation of this technique is that X-rays may not penetrate dense breast tissue effectively; therefore, these images can be more difficult to read and cancers may be obscured by dense overlapping tissue. Digital breast tomosynthesis (DBT), is a new Food and Drug Administration (FDA) approved mammographic technique that has been shown to increase breast cancer detection at a rate of 1 to 2/1,000 compared to standard full-field digital mammography (FFDM) with fewer recalls and false-positive biopsy recommendations. 5, 6, 7, 8
Estimates of the false-negative rate for cancers in mammography screening are approximately 10 to 30%. 9 A recent report indicates a mammographic “miss rate” of up to 40,000 to 45,000 breast cancers every year, supporting the need for improved screening methods, especially for women at high risk of developing breast cancer (≥20% risk). 10
During the last few years, evidence concerning the limitations of mammography has prompted many U.S. states to pass national breast density legislation. These laws generally recommend consideration of adjunctive imaging screening methods for women with dense breast tissue. It is estimated that more than 50% of women fall into the dense breast category. 11 Of these adjunctive methods, supplemental whole breast ultrasound screening (WBUS) as an addition to mammography is now the method most commonly used. WBUS has limitations however, principally, high biopsy rates and unwieldy short-term follow-up rates. 12, 13 In recent years, studies have shown that compared with mammography and ultrasound, dynamic contrast-enhanced magnetic resonance imaging (DCE-MRI) is more sensitive in detecting breast abnormalities and is an excellent screening tool. MRI uses magnetic fields to produce cross-sectional images of soft-tissue structures. The contrast between normal breast tissue consisting of adipose and fibroglandular structures and breast lesions depends on the mobility and magnetic environment of the hydrogen atoms in the water and fat of these tissues. Gadolinium-based contrast agents (GBCA) are injected intravenously during MRI to improve detection of cancers and other lesions. 14, 15, 16
The superior sensitivity of breast MRI compared to other breast imaging techniques has been shown in women with a familial increased risk for breast cancer, and those who are carriers of BRCA1, BRCA2, or other rare gene mutations. 17, 18, 19 This evidence has resulted in recommendations from the American College of Radiology (ACR) and the American Cancer Society (ACS) that MRI be used as an adjunct to mammography to improve breast cancer detection in high-risk women. 20, 21, 22
There is currently no recommendation either for or against breast MRI screening in women at mild or moderate increased risk of developing breast cancer (15–20%), and the benefits in this population remain unclear. Women with a personal history of breast cancer are at high risk of developing a recurrence or a second breast cancer, and have been shown to benefit from MRI surveillance, with more cancers detected on follow-up MRI when compared to mammography. 23 Although annual mammography is generally recommended following treatment of women with breast cancer, MRI is often added to the surveillance regimen when the patient’s age, imaging features cancer histology, and genetic profile are taken into account.
Breast density has been shown to be an independent risk factor for breast cancer. A meta-analysis in 2006 showed that women with dense breasts had a fourfold to fivefold increased risk compared with other women. 24 Breast biopsies performed for diagnosis of mammographic or ultrasound abnormalities may detect atypical hyperplasia, lobular carcinoma in situ, and other high-risk lesions, in approximately 10% of benign biopsies. 25 Studies have shown that the lifetime risk of breast cancer in women with prior diagnosis of a high-risk lesion is about 30% when followed for 25 years, 26, 27, 28 and additional MRI surveillance is often recommended in these women as well. 29, 30
The sensitivity of breast MRI has been shown to be substantially higher than mammography even for women at average breast cancer risk. A major criticism of MRI screening points to low specificity and a high rate of follow-up examinations and biopsies. However, a recent study of MR examinations in average risk women showed a 33% (18/54) positive predictive value (PPV) at MRI-recommended biopsy, a rate which fares favorably to the accepted PPV rate for other modalities such as mammography and ultrasound. 31 Early studies involving interpretations of an abbreviated MRI (AB-MR) protocol have shown equivalent sensitivity for cancer detection when compared to a full standard MRI, with only minimal decrease in specificity, 32, 33 and this growing evidence suggests a benefit for the expanded use of breast MRI for screening of a larger section of the female population, and poses an exciting challenge. The challenge will be to develop streamlined, efficient, workflow to allow for rapid screening at a lower cost. This effort will evoke memories of the early days of screening mammography when new methods were developed to introduce screening into radiology practices for the first time. 34 The excitement will come from our ability to improve the detection of an increased numbers of small cancers, most of them node negative, for the benefit of a much larger population of women. Key to this process will be a faster MRI protocol, efficient throughput, and advanced training for radiologists in the interpretation of MRI screening studies.
6.2 Standard Dynamic Contrast-Enhanced Magnetic Resonance Imaging Protocols
The basic MRI acquisition protocol for breast MRI has not changed greatly over the past two decades. Principally, the standard of care has included a precontrast T2-weighted acquisition followed by a dynamic contrast-enhanced (DCE-MRI) sequence, consisting of a series of T1-weighted acquisitions before and for approximately 5 to 7 minutes after the intravenous administration of contrast media. The contrast agents used clinically are gadolinium based (GBCM). The effect of gadolinium reduces the T1 in its microenvironment, increasing its signal in a T1-weighted acquisition; therefore, regions or lesions with increased blood flow and permeability such as cancers will accumulate contrast media to a greater extent than the surrounding tissue, resulting in higher signal increase. Lesion conspicuity therefore increases after the injection of contrast media and is highlighted on subtraction images (postcontrast minus baseline images). The temporal resolution of MR acquisition protocols in the United States has generally remained between 90 to 120 seconds in most practices, with a maximum resolution of 240 seconds allowed in the ACR Accreditation Program. 35 The Breast Magnetic Resonance Imaging Accreditation Program, sponsored by the ACR, requires both a T2-weighted (bright fluid) series and a multiphase T1-weighted series. The dynamic series must include a precontrast T1-weighted series, an early-phase (first) postcontrast T1-weighted series to be completed within 4 minutes of contrast injection, and a late-phase T1-weighted series with features matching the precontrast T1-weighted series. Measures of the rate of uptake and washout of contrast media within breast lesions contain diagnostically useful information. The shape of the signal intensity versus time curve (or signal time-course or kinetic curve) has shown to be useful in the classification of enhancing lesions. 36 Lesions with a fast uptake of contrast followed by a washout phase are more likely to be malignant, while lesions with a slow but persistent uptake are more likely benign. Discrete thresholds are used to classify two parts of the kinetic curve: the initial uptake and the delayed phase. Computer-aided diagnostic (CAD) systems can improve physician interpretation workflow by organizing and presenting large image datasets for interpretation, and by providing automatic analysis of the kinetic characteristics of enhancing lesions. Advanced computer displays can expedite kinetic characteristics by placing colored overlays on voxels within an enhancing lesion, thereby demonstrating the kinetics of the delayed phase of lesion enhancement as washout, plateau, or persistent, and the initial rise as slow, medium, or rapid. Additional provision of both time intensity curves and angiomaps allows a convenient and efficient way for radiologists to assess lesion enhancement kinetics. Microvascular density is a key factor in determining the initial rate of contrast media uptake and the heterogeneity within tumor enhancement. 37 There is some overlap between the kinetic assessment of benign and malignant lesions at MRI; therefore, the kinetic classification alone, while valuable (diagnostic accuracy 86%), is not sufficient for accurate diagnosis, and combined analysis of lesion morphology and kinetic characteristics is necessary.
The accuracy of MR interpretation may be affected by the variable enhancement of normal breast tissue, which usually enhances slowly initially, generates a persistent kinetic curve, and is referred to as background parenchymal enhancement (BPE). The hormonal response of breast tissue in premenopausal women varies during the menstrual cycle. Marked BPE can limit the sensitivity of the examination 38, 39 because differentiation of enhancing abnormalities from BPE may present a diagnostic challenge. 40 For this reason, it is recommended that premenopausal women should ideally be scanned during the second week of the menstrual cycle and week 4 should be avoided if at all possible. 41
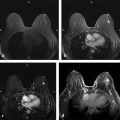
At the University of Chicago (UC), the current routine clinical breast MRI protocol at field strengths 1.5 and 3.0 T includes a T2-weighted, non–fat-suppressed axial sequence followed by a T1-weighted fat-suppressed axial dynamic series, with images acquired before and after intravenous administration of contrast media. At 3.0 T, five postcontrast acquisitions at a temporal resolution of approximately 60 seconds and spatial resolution of 0.8 × 0.8 × 0.8 cm are obtained for both the T2-weighted and the T1-weighted series. The images from both acquired series are isotropic, matched spatially, and allow multiplanar formatting of both the T2-weighted and the T1-weighted sequences with identical spatial resolution in all planes as shown in ▶ Fig. 6.1.
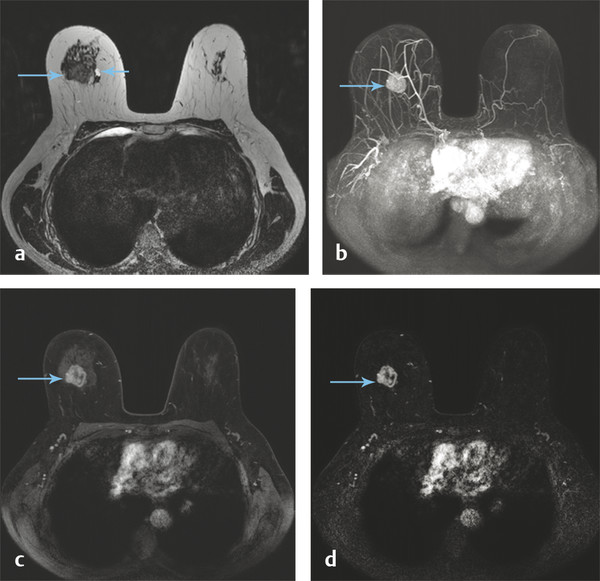
Fig. 6.1 A 56-year-old woman presents with a newly diagnosed invasive duct cancer grade 2, in the right breast at 12 o’clock. A standard breast MRI protocol is shown at 3 Tesla (T). (a) Shows an isointense mass on the T2-weighted (T2w) non–fat-saturated axial precontrast image (long arrow) with a small medial adjacent cyst (short arrow). The invasive cancer is well seen on the axial T1w maximum intensity projection image (MIP) at 1 minute postcontrast injection, (b) (arrow), and also the axial source and subtraction images at 1 minute postcontrast, (c) and (d) (arrows). It should be noted that both the T2w and the T1w images are isotropic allowing optimal multiplanar reformatting.
6.3 Semiquantitative Analysis of Dynamic Contrast-Enhanced Magnetic Resonance Imaging
Routine interpretation of DCE-MRI studies is based on signal intensity and how it changes with time after the injection of contrast media. The semiquantitative kinetic analysis, as shown in the previously described standard protocol, has the advantage of being relatively simple to implement in routine clinical practice. Intrinsic lesion characteristics, acquisition parameters, and concentration all play a role in signal enhancement. While the discrete categorization of lesion kinetics has been shown to be diagnostically useful, previous work by Jansen et al 42 found that the descriptors of curve shape vary significantly between different scanners and acquisition parameters in malignant lesions. Semiquantitative methods are mostly focused on the analysis of the lesion kinetic curve. Therefore, diagnostic tools such as the standard signal intensity time course curves may be difficult to apply across different sites, because their performance will depend on the particular thresholds chosen for each scanner. A study by Pineda et al found that semiquantitative descriptors of curve shape can vary significantly in repeated scans of the same patients at different field strengths. 43
Direct measurement of the signal increase or percent signal enhancement in DCE-MRI is not equivalent to measuring the concentration of contrast media in tissues. Conversion from signal intensity to concentration of contrast media is necessary for pharmacokinetic (PK) analysis of DCE-MRI data. The goal of PK analysis (also referred to as tracer kinetic modeling) is to estimate quantitative parameters that describe blood flow, capillary leakage, and related physiological parameters. The most widely used model in PK analysis of breast lesions is the two-compartment model (TCM) and the formalism first proposed by Kety and applied to DCE-MRI by Tofts. 44, 45 This model assumes two compartments where contrast media is distributed, the blood plasma and the extravascular extracellular space (EES or ve). The exchange of contrast media between the blood plasma compartment and the EES is described by the transfer rate constant (Ktrans). The redistribution rate constant, kep, is defined as the ratio of Ktrans to ve and determines the transfer of contrast media from the lesion back into the plasma. Ktrans is related to the blood flow in the capillary, its permeability, and surface area. Because permeability is greater in tumors due to the fenestration of the vasculature feeding them, Ktrans may be a diagnostically useful quantity. Despite these limitations, studies have shown significant correlation between semiquantitative and quantitative methods. Measurements such as the initial area under the time course contrast curve (iAUC), have been shown to correlate with standard PK parameters (Ktrans, kep, and ve), suggesting that it may be possible to identify semiquantitative parameters from routine DCE-MRI acquisitions that reflect directly the biology of enhancing lesions. 46 Further research will be necessary to determine whether semiquantitative parameters can be accurately correlated with PK parameters in clinical practice, and whether these parameters factors can be standardized across different MR platforms and acquisition protocols.
6.4 Quantitative Analysis of Dynamic Contrast-Enhanced Magnetic Resonance Imaging
Quantitative analysis of DCE-MRI, such as PK modeling, has been shown to yield useful prognostic information and has the potential to increase the diagnostic accuracy of DCE-MRI by probing directly the physiological properties of tumors. 47 Calculations of contrast media concentration within an enhancing lesion provide important physiologic information and added diagnostic value. In order to incorporate analysis based on lesion concentration of contrast media into clinical practice, measures of the relaxivity of the contrast agent, the arterial input function, 48, 49, 50, 51 the B1 field of the transmitter, 52, 53, 54 the native or baseline T1 of an identified lesion, 46 and the shortened postcontrast T1 at each time point in the DCE sequence are required. 45, 49, 50, 51, 52, 55, 56
Quantitative analysis, starting with the calculation of the actual concentration of contrast in enhancing lesions, has the potential to standardize DCE-MRI for multicenter and longitudinal studies, and to produce PK parameters that relate directly to intrinsic physiology and biology. Ongoing research into quantitative analysis of DCE-MRI methods could improve discrimination between benign and malignant lesions, and also produce an imaging biomarker with prognostic value and the potential to guide therapy. 57
6.5 Abbreviated Magnetic Resonance Protocol: Abbreviated Breast Magnetic Resonance Imaging
In the first study of its kind, Kuhl et al recently reported on the results of an abbreviated MRI protocol and showed that a shorter (3-minute) MRI was comparable to the accepted standard of 21-minute study when screening for cancer. 58 Although this protocol is likely not sufficient for a complete diagnostic examination, in the screening setting this study showed a high detection rate without a corresponding high false-positive rate, an indication of an excellent high-quality screening test. Of the 11 cancers diagnosed in 603 women in this study, most were intermediate or high nuclear grade with a median size of 8.4 mm, and all malignancies were node negative. These excellent results have prompted other researchers to consider further development of shorter MR imaging protocols for screening. Potential additional benefits could include better patient tolerance for a shorter MR examination and reduced costs, resulting in improved screening not only for high-risk women, but also for women at mild to moderate increased risk as well.
6.6 Abbreviated Breast Magnetic Resonance Imaging: Adapted Standard Protocol
In addition to the AB-MR protocol devised by Kuhl et al, 58 any standard diagnostic protocol currently used in clinical practice can be shortened to accomplish an effective abbreviated protocol for screening. Generally, a T2-weighted sequence and a dynamic contrast-enhanced sequence with one or two postcontrast series will suffice, achieving a total acquisition time of 10 minutes or less. The MRI study should fulfill the following requirements: standardized contrast administration based on kilogram weight using a power injector, total scan time of less than 10 minutes (including localizer), one precontrast and one or two postcontrast gradient echo (GRE) fat-suppressed axial acquisitions, with in-plane resolution of 1 mm or less, slice thickness of 3 mm of less. An additional axial T2-weighted sequence with in-plane resolution matching the GRE sequences and 3 mm or less slice thickness is useful for improved specificity. Technical parameters for an abbreviated breast (AB-MR) protocol, adapted from a standard clinical protocol at UC, for both 1.5- and 3.0-T magnets, are shown in ▶ Table 6.1 and ▶ Table 6.2, respectively.
| ||
| ||
Parameters | ||
VISTA | DCE-MRI | |
Geometry | 3D axial | 3D axial |
FOV (mm) | 320–400 | 320–400 |
Spatial resolution/interpolated (mm) | 0.8/0.8 | 0.8/0.7 |
Slice thickness/interpolated (mm) | 2.0/1.0 | 2.0/1.0 |
Number of slices | 200 | 175 |
Slice oversample | default | 1.0 |
Slice gap (mm) | N/A | N/A |
SENSE acceleration | 3 × 2 | 2.5 × 2.0 |
TR (ms) | 2,000 | 5.5 |
TE (ms) | 368 | 2.7 |
Flip angle (degrees) | 90 | 12 |
Fast imaging mode | TSE | TFE |
Fast imaging factor | 120 | 44 |
Fat suppression | None | SPAIR |
Partial Fourier imaging | No | No |
k-space sampling | Cartesian | Cartesian |
Number of averages | 1 | 1 |
Duration (m:s) | 2:32 | 5:24 |
Temporal resolution (m:s) | N/A | 0:54 |
b values (s/mm2) | N/A | N/A |
Abbreviations: AB-MR, abbreviated breast magnetic resonance imaging; DCE-MRI, dynamic contrast-enhanced MRI; FOV, field of view; N/A, not available; SPAIR, short scar periareolar inferior pedicle reduction; TE, echo time; TFE, turbo field echo; TR, repetition time; TSE, turbo spin echo. Note: Parameters for VISTA and DCE-MRI are standard clinical parameters, so there is no special consideration to their selection beyond optimization for image quality in given time. | ||
| ||
| ||
Parameters | ||
VISTA | DCE-MRI | |
Geometry | 3D axial | 3D axial |
FOV (mm) | 320–400 | 320–400 |
Spatial resolution/interpolated (mm) | 0.8/0.65 | 0.8/0.6 |
Slice thickness/interpolated (mm) | 1.6/0.8 | 1.6/0.8 |
Number of slices | 250 | 250 |
Slice oversample | 1.33 | 1.0 |
Slice gap (mm) | N/A | N/A |
SENSE acceleration | 3 × 2 | 2.5 × 2.0 |
TR (ms) | 2000 | 4.8 |
TE (ms) | 221 | 2.4 |
Flip angle (degrees) | 90 | 10 |
Fast imaging mode | TSE | TFE |
Fast imaging factor | 120 | 27 |
Fat suppression | None | SPAIR |
Partial Fourier imaging | No | 0.85 × 1.0 |
k-space sampling | Cartesian | Cartesian |
Number of averages | 1 | 1 |
Duration (m:s) | 3:44 | 2:13 |
Temporal resolution (m:s) | N/A | 1:02 |
b values (s/mm2) | N/A | N/A |
Abbreviations: AB-MR, abbreviated breast magnetic resonance imaging; DCE-MRI, dynamic contrast-enhanced MRI; FOV, field of view; N/A, not available; SPAIR; short scar periareolar inferior pedicle reduction; TE, echo time; TFE, turbo field echo; TR, repetition time; TSE, turbo spin echo. Note: Parameters for VISTA and DCE-MRI are standard clinical parameters, so there is no special consideration to their selection beyond optimization for image quality in given time. | ||
6.7 Abbreviated Breast Magnetic Resonance Imaging: Innovative Protocols
New protocols, referred to as “ultrafast imaging,” are currently under development aimed toward imaging and sampling early kinetics at a faster rate, 4 to 8 seconds (s) per time point for a bilateral scan. DCE-MRI examinations at UC include a high temporal resolution, lower spatial resolution acquisition during the first minute following contrast injection, followed by a standard, higher spatial resolution image acquisition, achieving a total acquisition time of 3 minutes for dynamic scans. Early work by this group 59 and others 60 demonstrated that this type of early acquisition often increases lesion conspicuity relative to a standard clinical protocol. Lesion conspicuity in ultrafast (UF) images is often greatest within the first 30 seconds after contrast media injection, when parenchymal enhancement is minimal, even when marked BPE is found on later images. 43, 61 UF DCE-MRI methods allow measurement of the rate of lesion enhancement with respect to time, of initial arterial enhancement in the breast, 62 rather than time of injection, thus reducing dependence on global variables such as cardiac output.
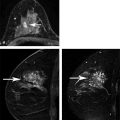
An example of UF DCE-MRI is shown in ▶ Fig. 6.2. The patient presented with known invasive duct carcinoma in the right breast showing maximum intensity projections (MIPs) generated from bilateral subtraction images acquired with a 6.6-second temporal resolution. Each image is labeled with the time of postcontrast injection. Arteries, including those feeding the lesion in the right breast, enhance a few seconds before the cancer. The arteries feeding the lesion and draining veins are easily detectable in early images but less visible in later images. The cancer enhances before normal parenchyma, which is a considerable advantage when marked BPE is present on later images.
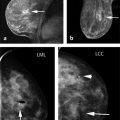
UF DCE-MRI allows new approaches to quantitative data analysis, including measurements of the initial rate of lesion enhancement. Time of arrival (TOA) of the contrast bolus can be accurately measured relative to the initial enhancement in the artery. This potentially powerful approach can correct for variations in contrast media injection speed and cardiac output, allowing for more standardized measurements. ▶ Fig. 6.3 illustrates this approach. The images show the TOA of the contrast bolus in each pixel relative to the initial enhancement in arteries. The invasive cancer enhances almost simultaneously with the arteries; thus, it is indicated in red—since TOA is close to “0.” However, the complex sclerosing lesion (radial scar) enhances much later ( ▶ Fig. 6.3).
UF imaging may also have other advantages. Measurement of small, early enhancement allows simplified and more accurate measurements of the arterial input function and Ktrans. With adequate temporal resolution, propagation of the contrast media bolus through arteries feeding lesions and the draining veins can be imaged, and this may provide additional diagnostically useful information. Preliminary results suggest that there are significant differences between benign and malignant lesions in parameters that describe contrast media uptake kinetics in the first minute postinjection of contrast media.
UF bilateral images acquired at UC use standard Cartesian k-space sampling. This is different from the “view sharing” methods that are often used to image at high temporal resolution in DCE-MRI clinical protocols. Keyhole approaches and other “view sharing” methods like “TRICKS” and “TWIST” typically involve scanning the center of k-space at relatively high temporal resolution, and the outer portions of k-space at much lower temporal resolution. 63, 64, 65 Each image in the dynamic series is produced from data from different parts of k-space scanned at different times. This results in high-quality images, but it is difficult to perform quantitative analysis of data acquired with these sequences. Problems arise when data are analyzed to determine which features are enhancing at what strength and at what rate, particularly in the case of small features (e.g., lesions) with sharp and irregular edges. The information from the initial 10 seconds after uptake initiation is combined with information from other time periods, and the diagnostic utility is thus diluted. For example, if a narrow blood vessel, the rim of a cancer, or spiculations on a suspicious lesion appear to enhance rapidly, it is difficult to determine the true rate of enhancement. 61 Compressed sensing methods have similar problems and produce artifacts. 66, 67, 68
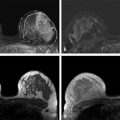
Over the past year, at both 1.5 and 3.0 T, we have incorporated a UF sequence with 6- to 9-second temporal resolution into the dynamic acquisition portion of our standard diagnostic clinical DCE-MRI protocol and our AB-MR screening protocol at UC. Prerequisites for the AB-MR protocol include standardized contrast administration based on kilogram weight using a power injector, and total imaging time of less than 10 minutes (including localizer). Two precontrast and eight postcontrast 6- to 9-second UF acquisitions are obtained followed by one standard 70-second GRE axial acquisition. In this protocol, the UF slice thickness must be 3 mm or less, the in-plane UF spatial resolution 2 to 3 mm, and the spatial resolution of the conventional contrast enhanced scan 0.8 mm. The in-plane resolution of the axial T2-weighted precontrast non–fat-suppressed sequence must be identical to the GRE sequence. An example of this type of acquisition is shown in ▶ Fig. 6.4. The technical specifics of this protocol at both field strengths are provided in ▶ Table 6.3 and ▶ Table 6.4.
Preliminary results using this protocol 62 demonstrate that enhancement in the breast during the first 20 to 40 seconds is very sparse; significant enhancement occurs in only about 5% of the volume of the breast. ▶ Fig. 6.3 demonstrates that only the primary invasive cancer and a few other small regions (shown in red) enhance during the first few seconds following arterial enhancement, suggesting that new approaches to further increase both temporal and spatial resolution without the need to use view sharing or compressed sensing methods could be used. For example, the field of view (FOV) can be set to a fraction of the FOV required to fully sample the object. Since early enhancement is sparse, it is unlikely that enhancing regions will overlap, and rare cases of overlap can be resolved by further analysis. Beginning at early times after injection and using an aliasing factor of 4, data can be acquired with an FOV that is one-fourth of the FOV needed to sample the entire object. As the enhancement becomes less sparse, at later times after injection (e.g., 20–60 seconds) the aliasing factor is slowly reduced until the object is fully sampled with an appropriate FOV (e.g., at 60 seconds after contrast media injection). This process is referred to as “progressive aliasing.” With progressive aliasing, it is possible to perform complete sampling of enhancing regions at high temporal resolution combined with high spatial resolution, and in most cases without errors or loss of information as shown in ▶ Fig. 6.4a-f. This protocol can be combined with SENSE acceleration to further increase temporal and/or spatial resolution.
There is considerable work left to optimize methods for acquisition and analysis of UF DCE-MRI data, and to integrate UF imaging into AB-MRI protocols. However, the preliminary results from the UC group 59, 61, 62 and other laboratories 60 clearly demonstrate the potential of this method. Abbreviated MRI protocols that combine UF methods with conventional high-resolution postcontrast scans, as well as T2-weighted images, can provide radiologists with the outstanding morphologic detail they are accustomed to with a non–fat-saturated technique, combined with increased sensitivity to lesion morphology and physiology.
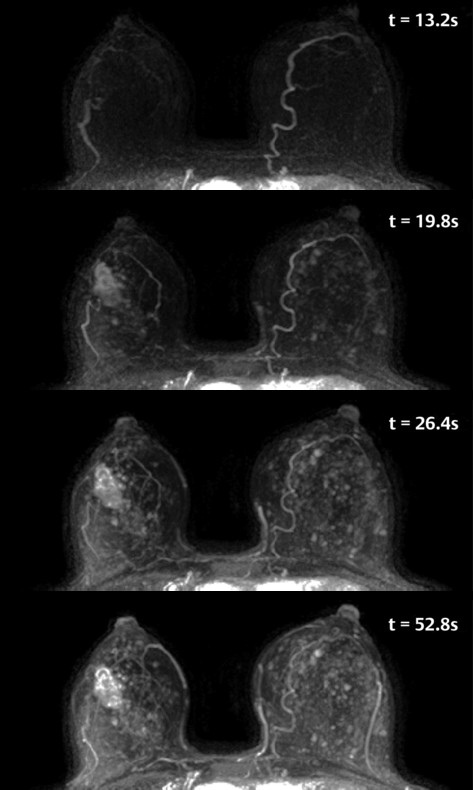
Fig. 6.2 Age 56 with a newly diagnosed invasive cancer in the right breast. Maximum intensity projections (MIPs) of ultra-fast subtraction images demonstrate an irregular mass in the central right breast with feeding vessels. Marked nodular parenchymal enhancement is noted in this case, with the cancer best seen on the 19.8s image. The MIP images were generated from subtraction images obtained at 6.6s temporal resolution, and the time following contract injection is labeled on each image.
Related posts:
 Current Clinical Evidence on Abbreviated Breast Magnetic Resonance Imaging
 Introduction to Abbreviated Breast Magnetic Imaging
 Techniques for Performing Abbreviated Breast Magnetic Resonance Imaging
 Technical Aspects of Abbreviated Breast Magnetic Resonance Imaging: The Original Approach
 Magnetic Resonance Imaging-Guided Biopsy Techniques
 Interpretation Guidelines
Stay updated, free articles. Join our Telegram channel

Full access? Get Clinical Tree


