How to Image Arthritis and Cartilage
- •
Coils and patient position: Which joint is being imaged determines which coil and which position are used. In the knee, the standard extremity coil is used in the same manner as imaging for a torn meniscus. The same would hold for the wrist, elbow, and so forth.
- •
Image orientation: Joints imaged for arthritis and for cartilage are best seen with the standard planes of imaging discussed in the other chapters. In the knee, three planes (axial, coronal, and sagittal) should be used to evaluate the cartilage adequately.
- •
Pulse sequences and regions of interest: For most entities involving the joints as in arthritis, it is recommended that T1W and some type of T2W sequence be used in each plane of imaging. Cartilage-sensitive sequences are discussed in greater detail later in this chapter.
- •
Contrast: There is no need to use contrast material for evaluating arthritis or cartilage, although it markedly increases the conspicuity of pannus.
Most joint abnormalities are discussed in the chapters under the specific joints (eg, avascular necrosis in the marrow or hip chapters). This short chapter discusses a few additional abnormalities that can affect any joint, such as pigmented villonodular synovitis (PVNS), synovial chondromatosis, and a few common arthritides; it also provides an overview of cartilage imaging.
MRI has little role in most cases of arthritis. Plain films seem to suffice for initial diagnosis and in follow-up to determine progression. Although MRI can depict erosive changes and cartilage loss in small joints in various arthritides, it currently does not seem to offer additional information over plain films in terms of initial diagnosis. Current trends in rheumatology suggest that MRI is a valuable tool in following synovitis to institute aggressive and earlier treatments. It is important to recognize, however, the changes encountered in the more common arthritides because these changes occasionally are seen in patients undergoing imaging for other reasons.
Rheumatoid Arthritis
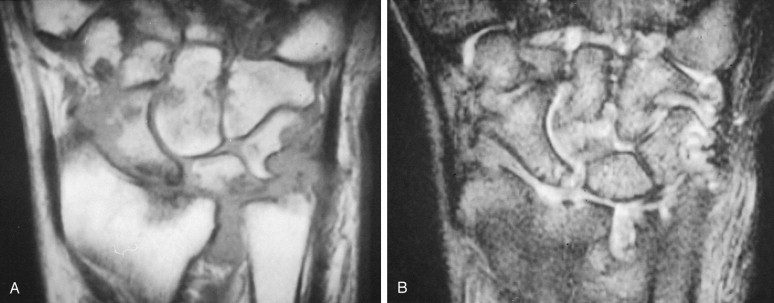
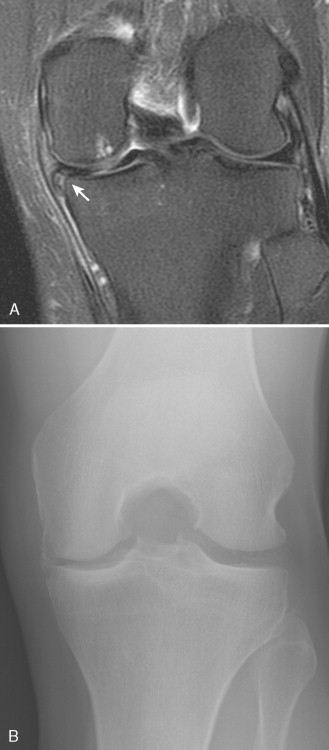
The erosive changes in rheumatoid arthritis (RA) seen on MRI virtually mirror the changes seen on conventional radiographs ( Fig. 6-1 ). MRI seems to show them to better advantage, and can be a useful clinical tool for showing the extent of disease. In the past, it was thought unnecessary to perform MRI in the setting of RA. Pannus cannot be reliably differentiated from synovium and joint fluid; however, with gadolinium administration, some investigators have reported that pannus can be easily identified because of the intense enhancement that occurs in the highly vascular pannus. More recent literature suggests contrast-enhanced T1W images identify more periarticular bone abnormalities than fat-suppressed T2W images. If one looks at unenhanced images of joints very closely, pannus has a slightly higher signal than joint fluid on T1W images, allowing it to be identified without the expense and hassle of contrast administration. Previously, treatment of RA was not predicated on the amount of pannus present. Rheumatologists have become more aggressive, however, and MRI is often done to evaluate pannus to help determine a treatment plan.
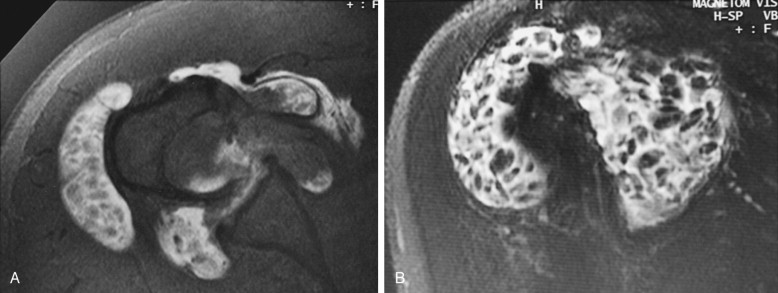
Occasionally, a swollen joint in a patient with RA shows multiple small loose bodies, called rice bodies ( Fig. 6-2 ). They are called this because of their resemblance at surgery to white rice. On MRI, rice bodies of RA can mimic another cause of multiple loose bodies, such as synovial chondromatosis, but typically rice bodies are much smaller than the loose bodies of synovial chondromatosis and remain low signal on T2W images. Most, but not all, patients already carry a diagnosis of RA, so the entity is easily recognized as rice bodies if the radiologist is familiar with this process. Rice bodies can be removed easily by a surgeon if they cause mechanical symptoms, but otherwise the treatment is the same as for any joint inflamed by RA.
Ankylosing Spondylitis
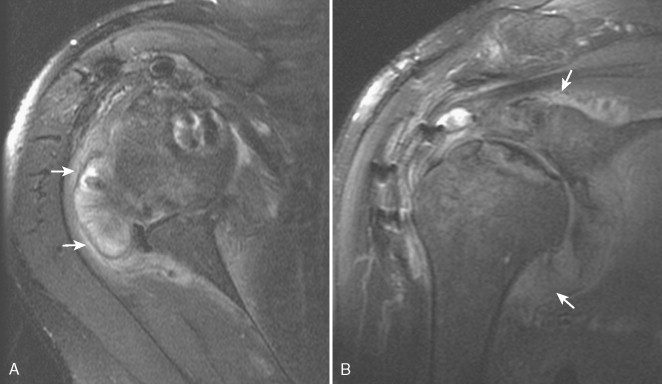
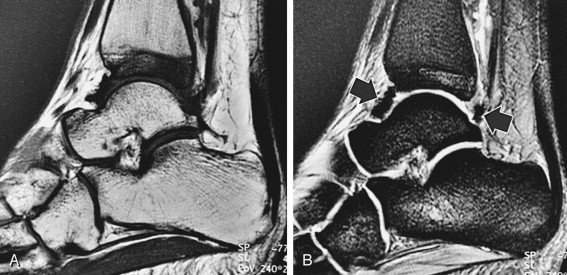
Generally, the changes of ankylosing spondylitis can be appreciated with conventional x-ray as has been discussed with other arthritides. The early changes, such as enthesopathy as evidenced by bone marrow edema at the tendinous insertion sites can be appreciated much earlier on MRI than conventional x-ray ( Fig. 6-3 ).
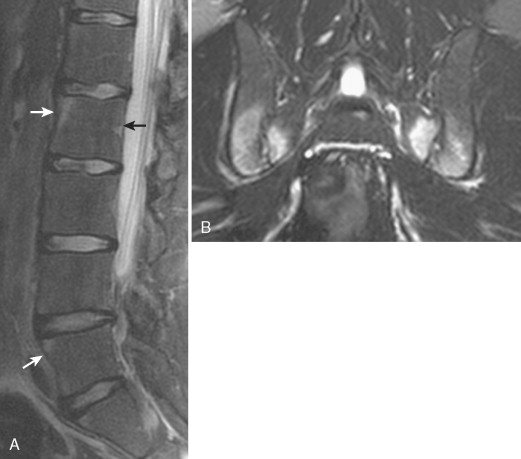
Contrast enhancement may show the more subtle early changes around the sacroiliac joints before erosions are evident on plain films. Similarly, the MRI equivalent of “shiny corners” is reflected as bone marrow edema at the end plates of the ligament attachment. The presence of these findings can help direct treatment for patients with this arthropathy.
Gout
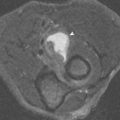
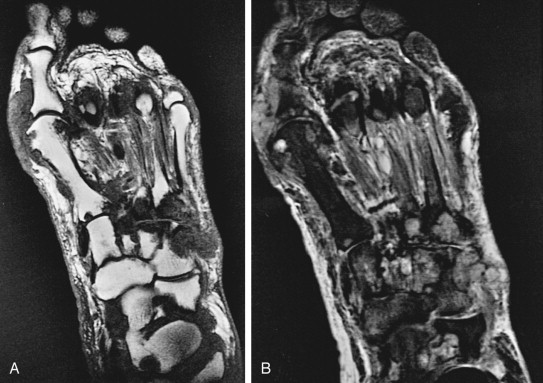
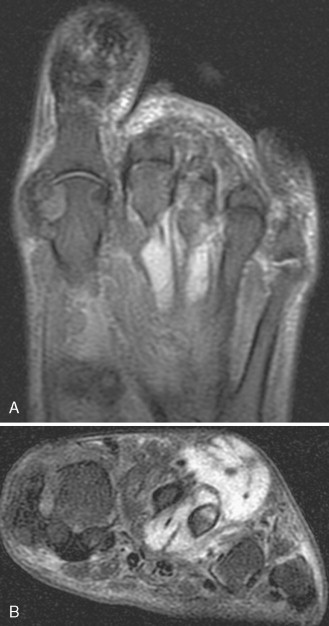
As with RA, the radiographic findings in gout are sufficient for diagnosis, and MRI has little to offer in this disease. It is important to appreciate, however, that gouty tophi occasionally are seen in patients not known to have gout, in which case they can cause diagnostic confusion. Gouty tophi can occur in almost any soft tissue location, including intra-articularly. They can erode bones or can begin within bones (intraosseous tophi). In cases in which the tophus is large, and the diagnosis of gout is unknown, the tophus can be misdiagnosed as a tumor with resultant biopsy. Tophi are typically low in signal on T1W and T2W images ( Fig. 6-4 ), which distinguishes them from most other joint problems and from most tumors (with the exception of fibrous tumors, PVNS, and amyloid). Images of tophi occasionally are increased signal intensity, however ( Fig. 6-5 ).
Calcium Pyrophosphate Dihydrate Deposition
As with the aforementioned arthritides, MRI has little to offer in the diagnosis of calcium pyrophosphate dihydrate deposition, or pseudogout. The appearance of chondrocalcinosis in the menisci of the knee has been reported to have linear high signal that can mimic a meniscal tear ( Fig. 6-6 ), but this has not been a significant pitfall in our experience. One might intuitively think that calcification would produce low signal on MR images; however, in many cases, such as in the lumbar spine, calcification paradoxically causes intermediate to high signal on T1W images. The reason for this has not been explained, but several theories have been discussed in the literature. , Chondrocalcinosis also can appear as linear or punctate areas of low signal in hyaline cartilage, which are particularly noticeable on T2 * sequences because of the blooming artifact.
Hemophilia
Although patients with hemophilia are not imaged with MRI often, some of the findings seen in hemophilia are worth mentioning. The joint destruction and cartilage loss seen on MRI are pretty much what one would expect from the conventional radiographs. Chronic joint hemorrhages leave deposits of hemosiderin, however, which is seen on MR images as clumps of low signal lining the synovium on T1W and T2W images ( Fig. 6-7 ). This has been termed hemosiderotic arthropathy . The amount of hemosiderin seen varies from none to moderate; it is almost never as prominent as that seen in PVNS. In joints with a lot of hemosiderin, there typically is advanced joint destruction, which is uncommon in PVNS. It is virtually never a diagnostic dilemma to differentiate hemophilia from PVNS because patients with hemophilia are well aware of their diagnosis long before a joint is imaged. The main indications for imaging a hemophiliac joint are to determine the extent of cartilage destruction and the thickness of the synovium; these features help determine how to manage the joint abnormality.
Amyloid
Amyloid deposits tend to occur in and around large joints, and can cause significant joint swelling and pain ( Figs. 6-8 and 6-9 ). Bony erosion can be prominent. Amyloid also can occur in the spine (where it is much more common), where it may resemble a disk infection ( Fig. 6-10 ). In the spine, the deposits can be either amyloid or an amyloid-like entity called β 2 -microglobulin . In a patient with suspected disk infection, it is imperative to inquire whether the patient has renal failure or is on dialysis because amyloid or β 2 -microglobulin deposits from renal disease can perfectly mimic infection on radiographs and MR images, resulting in an unnecessary biopsy. It is the only entity described that mimics a disk infection. Amyloid deposits have been reported to be low in signal on T1W and T2W images, which is distinctly unusual for most pathologic processes. Most examples we have seen in the spine have shown high signal on T2W images. One helpful way of determining infection versus amyloid in the spine is noting the preservation of an intranuclear cleft within the disks. The cleft disappears in the setting of diskitis ( Fig. 6-11 ).