Early: occult on radiographs with diffuse bone marrow edema on MRI and increased activity on bone scan. Middisease: alternating serpiginous bands of alternating low and high signal intensity on MRI ± characteristic findings of osteonecrosis on radiography.21
Transient osteoporosis
Radiographs may show bone demineralization.
Osteoid osteoma and osteoblastoma
Intense bone marrow edema on MRI.
The bone marrow edema tends to extend well beyond the nidus.
More confluent edema ± soft-tissue mass or bone destruction.
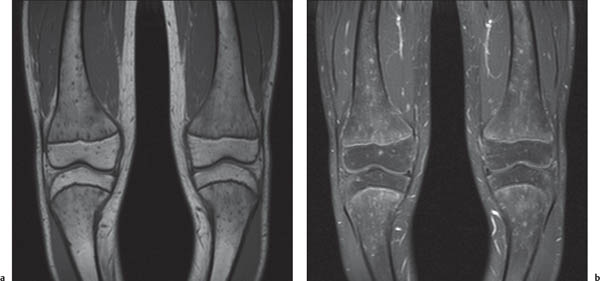
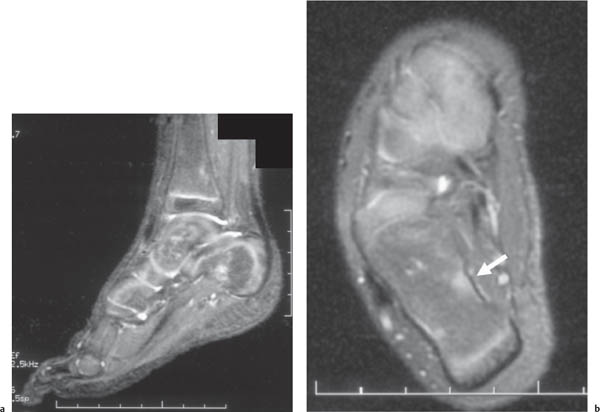
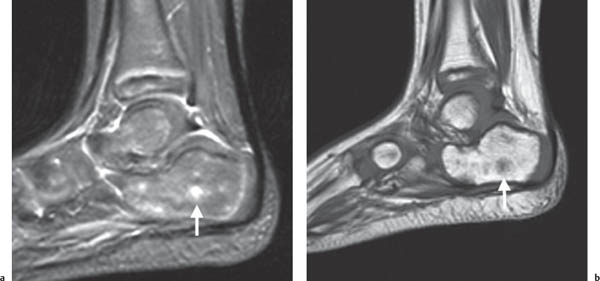
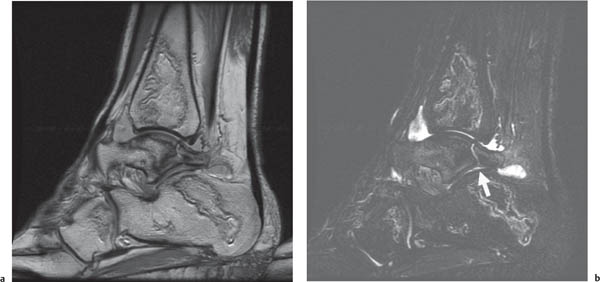
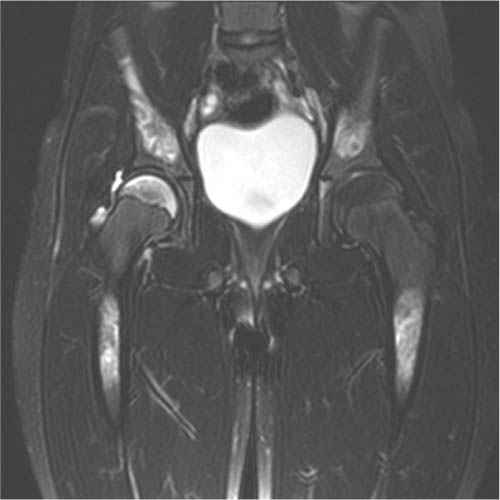
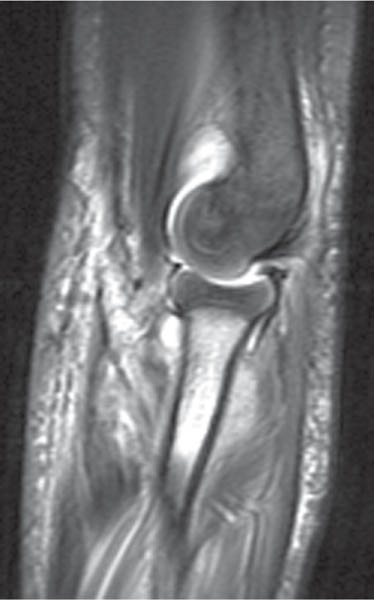
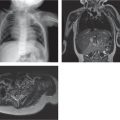
Fig. 5.170a, b Normal variation in red marrow. (a, b) Speckled appearance of biopsy-proven normocellular red marrow on T1 and postgadolinium T1-weighted fat-saturated MRI.Fig. 5.171a, b Normal variation in red marrow. (a, b) Speckled increased T2-weighted signal intensity in the marrow of a 3-year-old (arrow in b).Fig. 5.172a, b Biopsy-proven red marrow. (a, b) Foci of increased T2-weighted signal intensity (arrows) may mimic a neoplastic process in this patient in remission from acute lymphoblastic leukemia.Fig. 5.173a, b Avascular necrosis. (a, b) Osteonecrosis of the middle and hind foot on MRI with a vertical fracture through the talus that extends to the posterior facet (arrow in b).Fig. 5.174 Acute avascular necrosis with bone marrow edema in the right proximal femoral epiphysis. Note the bone infarcts in the ilium and femoral diaphysis. Also, the anemia decreases T2-weighted signal intensity in the regions of the pelvis unaffected by osteonecrosis.Fig. 5.175 Avascular necrosis. Sickle cell disease with acute bone infarct in the proximal radius with adjacent muscle necrosis on STIR MRI.
Table 5.89 Bone marrow: diffuse alteration in marrow
Diagnosis
Findings
Comments
Overproduction of hematopoietic marrow
Diffusely decreased T1- and increased T2-weighted marrow signal intensity on MRI.
DD: sickle cell disease, thalassemia, and other hemoglobinopathies.
MRI marrow changes may be accompanied by lucent metaphyseal bands on radiographs.
Inflammation
Diffusely decreased T1- and increased T2-weighted marrow signal intensity on MRI may be accompanied by periosteal reaction.
Infection
Similar findings as with inflammation.
Rebound following bone marrow stem cell transplantation
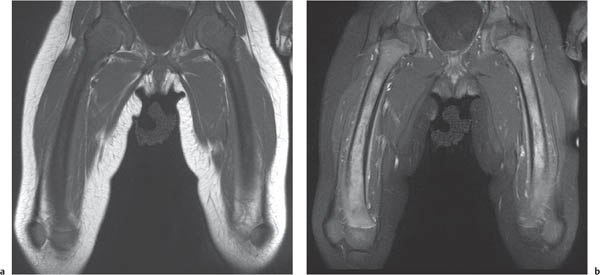
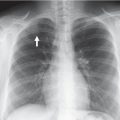
Fig. 5.176a, b Hematological malignancy. Diffuse marrow infiltration from acute megakaryocytic leukemia with replacement of marrow fat in the epiphyses (a) and diffuse periosteal reaction and marrow enhancement in the diaphyses (b).
Table 5.90 Alterations in the apophysis and sesamoid bones
Diagnosis
Findings
Comments
Apophysitis
Increased fluid signal intensity in the apophysis ± increased fluid signal intensity in the synchondrosis.