IVIM MRI and Bone Marrow
Bone marrow is one of the largest organs in humans, accounting for approximately 4%–5% of the total body weight [1]. It ensures the continuous generation of red blood cells, platelets, and white blood cells. Bone marrow is found within the central cavities of bones and is surrounded by a network of trabecular bone. It is composed of both hematopoietic tissue and adipocytes, together with supportive vascular sinuses, collagen fibers, reticular cells, macrophages, and lymphocytes. Two types of bone marrow can be distinguished macroscopically on the basis of their color: The red bone marrow is mainly responsible for hematopoiesis and shows a higher proportion of hematopoietic cells (60%) over that of adipocytes (40%). On the contrary, the yellow bone marrow is primarily composed of adipocytes (80%). Both aging and hematopoietic needs influence the relative balance of red and yellow marrow across lifetime [2, 3]. In addition, osteoporosis, metabolic diseases, focal benign or malignant tumors, fractures, and hematological disorders can directly involve the bone marrow.
Imaging plays a key role in the evaluation of the bone marrow. X-rays and CT are capable of visualizing the “container,” that is, the trabecular bone and the cortical bone. Hence, both CT and conventional X-ray techniques indirectly detect bone marrow lesions on the basis of their impact on bone mineralization, represented either by osteocondensation (triggered by osteoblasts or the inhibition of osteoclasts) or by osteolysis (triggered by osteoclasts). In addition, both CT and X-rays can show normal bone marrow aging (demonstrated by the progressive decrease of the bone marrow density over time) as well as bone marrow infiltration (demonstrated by an increase in the bone marrow density, especially in the medullary part of the diaphysis of long bones, in itself linked to yellow bone marrow replacement) [4–6]. However, the sensitivity of X-rays and CT techniques for bone marrow disease detection and follow-up remains insufficient.
Radiolabeled compounds such as 99mTc-nanocolloid, 99mTc-sulfur colloid, 111In-chloride, and radiolabeled white blood cells allow the recognitionof three separate compartments within the bone marrow: the reticuloendothelial system, the erythroid compartment, and the myeloid compartment. Positron emission tomography (PET) tracers have in addition allowed the analysis of the cellular metabolism and of the proliferative activity within the bone marrow with the use of 18F-fluorodeoxyglucose or 18F-fluorothymidine. These techniques are available now in clinical practice or in research [7].
MRI is now recognized as the key imaging modality for the assessment of bone marrow owing to its rich soft-tissue contrast. Conventional anatomical MRI—T1-weighted, T2-weighted, and contrast-enhanced imaging—is now used in routine clinical practice to diagnose bone marrow lesions and monitor treatment response in patients [8, 9].
Diffusion-weighted imaging (DWI) can provide additional information at the tissular and cellular level within the bone marrow. DWI is used for both detection and characterization of focal lesions within the bone marrow. However, bone marrow is a highly vascularized organ with a rich capillary network [10]. As a result, the fast movement of the water molecules within the bone marrow, induced by its rich vascularized stroma, directly impacts the signal observed in DWI, especially when low b values are selected for sequence design [11]. Because of its ability to separate both perfusion-related diffusion and true molecular diffusion components at the cellular level, intravoxel incoherent motion (IVIM) DWI, using a dual exponential analysis and multiple b values—encompassing both low b values (< 200 s/mm²) and high b values (> 200 s/mm²)— has been recently adapted for bone marrow analysis, with promising clinical applications [12].
18.1 Technical Aspects of IVIM in Bone Marrow
Single-shot spin-echo echo-planar imaging (SSSE-EPI) is the most frequently used sequence design for optimal IVIM imaging owing to its inherent ability to reduce motion artifacts. But the anatomical specificities of the bone marrow still yield technical challenges that must be overcome.
Even though bone marrow is one of the largest organs in the body, it is contained within a relatively small-sized bone medullar cavity, surrounded by cortical bone and spread out over the entire skeleton. To distinguish the bone marrow signal from that of the adjacent cortical bone, a high spatial resolution is required. As a result, the off-resonance effects, linked to the magnetic susceptibility difference between the bone marrow and the cortical bone, are increased, leading to artifacts such as spatial distortion or blurring. In addition, a higher spatial resolution further reduces the signal-to-noise ratio (SNR) of DWI. To reduce off-resonance artifacts, parallel imaging can be used. Reducing the train of gradient echoes in the echo-planar imaging (EPI)-readout in combination with a faster k-space traversal increases the bandwidth per pixel in the phase-encoding direction, thereby improving the image quality [13]. An alternative technique, mostly used in spinal cord imaging, is to reduce the field of view, which increases the bandwidth, thus reducing off-resonance effects. Outer volume suppression pulses or 2D radiofrequency excitation pulses can also be used. Although reduced fields of view can be used to characterize focal lesions of the bone marrow, this strategy is not capable of covering the entire axial skeleton [14, 15]. To maintain a sufficient SNR, diffusion gradient settings are particularly important. The number of excitations per b gradient can be increased, and if possible there should be more excitations for the highest b value to compensate for the loss of signal on high b values. In our experience, very high b values do not bring additional clinical information or allow a significant increase in the quality of true molecular diffusion (D) maps. As a result, we limit the highest b values to 800 s/mm² to keep the time echo (TE) as short as possible, preferably under 60 ms (Figs. 18.1 and 18.2). In other organs of the body, such as in the liver, it has been shown that perfusion-related diffusion effects are underestimated when very low b values (0 < b < 50 s/mm²) are excluded from the distribution [16]. It has also been shown that perfusion-related diffusion effects do not contribute significantly to the DWI signal for b values above 200 s/mm² [11, 17].
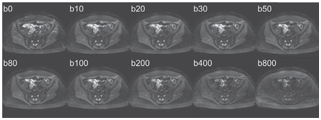
Figure 18.1 Axial pelvic IVIM acquisition obtained in a healthy volunteer on a 1.5 T MR scanner with 10 increasing b values, using a SSSE-EPI sequence, TR = 1900 ms, TE = 58 ms, matrix size of 208 × 256, three directional b gradients, and parallel imaging factor 2.
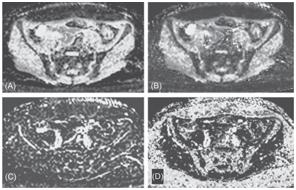
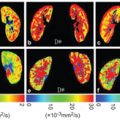
Figure 18.2 An ADC map (A), a true molecular diffusion coefficient map (B), a perfusion-related diffusion coefficient map (C), and a perfusion fraction map (D) from axial IVIM images of Fig 18.1. The respective mean values in the bone marrow were 0.25 ± 0.18 × 10⁻³ mm2/s, 0.35 ± 0.14 × 10⁻³ mm2/s, 49 ± 18 × 10–3 mm2/s, and 9 ± 12%.
Many bone marrow diseases are diffuse, making whole-body IVIM protocols potentially interesting but difficult to apply to the bone marrow. Filli et al. proposed in 2014 a whole-body IVIM protocol allowing the computation of parametric maps with good to fair image quality, using a 3 T MR scanner [18]. The images were acquired using an SSSE-EPI sequence in the transverse plane with three to six stacks of axial slices acquired with free breathing. A total of eight b values (0, 10, 20, 50, 150, 300, 500, and 800 s/mm²) were selected, combined with fat suppression using spectral selection attenuated inversion recovery (SPAIR). Even though this study showed that whole-body IVIM images of fair quality could be obtained, the sequence design was neither tested nor adapted for bone marrow imaging.
18.2 Present and Future Clinical Applications of IVIM MRI in Bone Marrow
18.2.1 IVIM and Normal Bone Marrow Evaluation
Literature data regarding normal quantitative IVIM parameters observed within the bone marrow remain scarce to date.
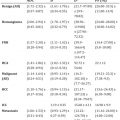
In 2004, Yeung et al. [11] studied the bone marrow of 20 healthy subjects—mean age 28 y/o—with IVIM on a 1.5 T MR scanner. They acquired a single transverse slice at the L3 level using an SSSE-EPI sequence (TR/TE of 2000/105, four excitations, and a matrix size of 128 × 120) and 10 b values (0, 20, 40, 60, 80, 100, 200, 300, 400, and 500 s/mm²). They reported a normal ADC value of 0.43 ± 0.08 × 10⁻³ mm²/s and a normal D value of 0.44 ± 0.11×10⁻³ mm²/s within the bone marrow. Perfusion-related diffusion coefficient (D*) and perfusion fraction (f) were not quantified.
In 2014, Marchand et al. [19] reported the normal bone marrow ADC, D, D*, and f values observed at 1.5 T in a group of 15 healthy women volunteers in the age range between 18 and 30 years. They used a transverse SSSE-EPI sequence acquired across L1 (TR of 10900 ms, TE of 75 ms, matrix size of 269 × 384, and 40 slices of 4 mm thickness), with five different b values (0, 50, 100, 200, and 600 s/mm²) for a total acquisition time of 6 min. and 22 s. Data analyses were carried out using the non-negative least-squares (NNLS) method. The authors reported D values of 0.45 ± 0.27 × 10⁻³ mm²/s, D* values of 63 ± 145 × 10–3 mm²/s, and f values of 27 ± 17%.
More recently, Ohno et al. studied IVIM values in 11 healthy volunteers (7 men and 4 women) with a mean age of 25.8 years [20]. Their protocol comprised an SSSE-EPI sequence with 16 b values (0, 10, 20, 30, 50, 80, 120, 180, 250, 350, 500, 800, 1200, 1800, 2200, and 2600 s/mm2) on a 1.5 T MR scanner. They reported much lower values than those by Marchand et al., with D values ranging between 0.1 and 0.3 × 10⁻³ mm²/s, D* values ranging between 3 and 8 × 10⁻³ mm2/s, and f values ranging between 10% and 20%. They also compared IVIM parameters to the bone mineral density obtained with dual-energy X-ray absorptiometry and to the fat fraction derived from double-gradient echo images with and without spectral adiabatic inversion recovery. The authors reported a significant positive correlation between the bone mineral density and D* and a negative correlation between D or ADC and the fat fraction.
Many differences between the two studies could explain the observed differences in IVIM parameters. The study by Marchand et al. included only women with regular menstruations. These subjects could bear a higher proportion of red bone marrow than the more predominantly masculine population reported in the study by Ohno et al., where most of the red marrow could already have been replaced by adipose tissue. The protocol parameters were also different in the two studies. Furthermore, f and D* seem to be poorly reproducible even when using the same MR scanner and protocol [21–23].
Further studies are still necessary, first to optimize IVIM protocols but also to better understand and identify the factors potentially impacting the quantitative parameters obtained from IVIM, especially the physiological factors, such as age, gender, and the fat content of the bone marrow.
18.2.2 IVIM Parameters and Osteoporosis
IVIM sequences have been seldom tested in osteoporotic patients. Yeung et al. [11] reported a population of 44 consecutive women (mean age of 70 years) and 20 normal subjects (mean age of 28 years) imaged using IVIM. Both ADC and D values tended to decrease with decreasing bone marrow density measured using dual energy X-ray absorptiometry (T-score) suggesting that a decrease in true molecular diffusion could accompany the progressive fatty replacement of bone marrow observed in elderly patients.
18.2.3 IVIM and Diffuse Bone Marrow Infiltration
Shah et al. examined 31 patients with monoclonal plasma cell diseases who underwent IVIM MRI of the pelvis. These imaging findings were correlated to the pathological results of targeted bone marrow biopsies [24]. The 1.5 T MR protocol was based on a transverse SSSE-EPI sequence (TR/TE 2800/56 ms, slice thickness of 5 mm, and 100 × 100 matrix size) with 11 b values (0, 25, 50, 100, 150, 200, 250, 300, 600, 800, and 1000 s/mm²). ADC, D, and f values were extracted. The authors reported a positive association of ADC and D with the pathologically observed plasma cell infiltration (slope = 0.46, p = 0.01 and slope = 0.43, p = 0.02, respectively) and a borderline positive association of ADC and D with the bone marrow microvessel density (slope = 0.37, p = 0.04 and slope = 0.35, p = 0.05, respectively). The perfusion fraction f correlated neither with the pathologically documented plasma cell infiltration nor with microcirculation parameters. The authors suggested that this could be linked to residual fat signal insufficiently suppressed in the DWI protocol.
Bourillon et al. [25] studied the correlation of quantitative IVIM parameters with that of Gd-enhanced perfusion parameters derived from dynamic contrast–enhanced (DCE) curves observed in a population of 27 multiple myeloma (MM) patients imaged at 1.5 T. The IVIM sequence was an SSSE-EPI sequence (TR of 1500 ms, TE of 59 ms, 5 mm slice thickness, and matrix size of 106 × 132) acquired with 10 b values (0, 10, 20, 30, 50, 80, 100, 200, 400, and 800 s/mm²). All IVIM acquisitions were centered on MM focal lesions larger than 20 mm. ADC and D values positively correlated with maximal bone marrow enhancement (r = 0.7, p < 0.001 and r = 0.455, p = 0.435, respectively) and were significantly higher in patients with an increased maximal bone marrow enhancement than in those with normal maximal bone marrow enhancement (ADC, 0.67 × 10⁻³ mm²/s vs. 0.54 × 10⁻³ mm²/s, p = 0.03; D, 0.58 × 10⁻³ mm²/s vs. 0.42 × 10⁻³ mm²/s, p < 0.01). D* and f were not correlated to bone marrow enhancement parameters. An example of IVIM acquisition in a patient with plasma cell bone marrow infiltration linked to MM is shown in Figs. 18.3 and 18.4.
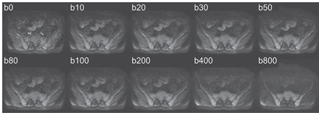
Figure 18.3 Axial pelvic IVIM acquisition obtained in a patient with severe plasmocytic diffuse bone marrow infiltration on a 1.5 T MR with 10 increasing b values, using a SSSE-EPI sequence, TR = 1900 ms, TE = 58 ms, matrix size of 208 × 256, three directional b gradients, and factor 2 parallel imaging. Both ADC and D values are significantly increased. The standard deviation of D* and f values remain too high to date to be used in daily routine to evaluate bone marrow infiltration.
Related posts:
Stay updated, free articles. Join our Telegram channel

Full access? Get Clinical Tree


