Cardiovascular magnetic resonance (CMR) can be used to obtain images of the heart in any plane. Thus to define normal anatomy and function, it is useful to define standard imaging planes to develop knowledge of normal anatomy, anatomic variants, and potential artifacts. Standard CMR planes have evolved from other imaging modalities, including body computed tomography (CT) imaging, echocardiography, and x-ray contrast angiography; consistent nomenclature across imaging modalities is important for accurate and unambiguous communication. The problem is often one of determining the appropriate plane as rapidly as possible to make the diagnosis. As with other cardiac imaging techniques, it is important to know as much as possible regarding the clinical question before determining the protocol. All examinations therefore should be planned to answer a specific clinical question.
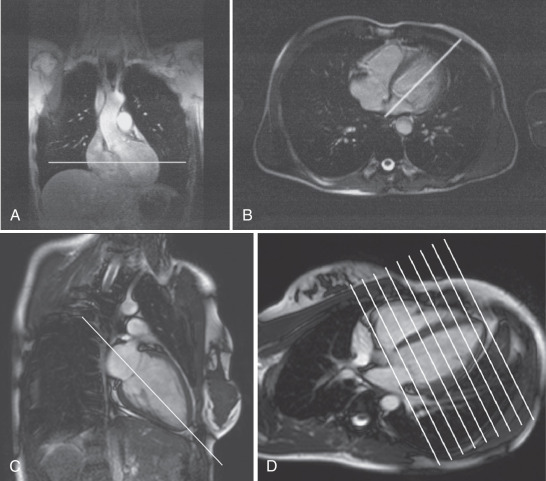
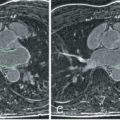
The basic imaging planes can be grouped into planes oriented with respect to the heart, such as horizontal and vertical long axis and short axis, and planes oriented with respect to the major axes of the body, such as the transaxial, sagittal, and coronal. Cardiac-oriented planes are essential for evaluation of cardiac chamber size and function and are familiar from other cardiac imaging techniques. With CMR the position of these planes can be prescribed very accurately. As shown in Fig. 15.1A , a breath-hold scout series in the coronal, axial, and sagittal plane is the usual starting point. An axial scout ( Fig. 15.1B ) is used to define the vertical long axis (also known as the two-chamber view, Fig. 15.1C ). The horizontal long axis ( Fig. 15.1D ), which depicts both atria and both ventricles but is slightly different from the true four-chamber view, is then planned, and followed by the short axis ( Fig. 15.1E and F ), which can be used to generate the left ventricular (LV) outflow tract view ( Fig. 15.1G ), which is similar to the parasternal long-axis view of transthoracic echocardiography.
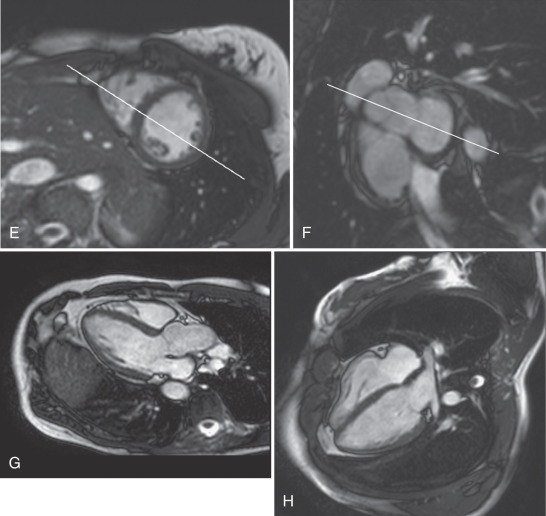
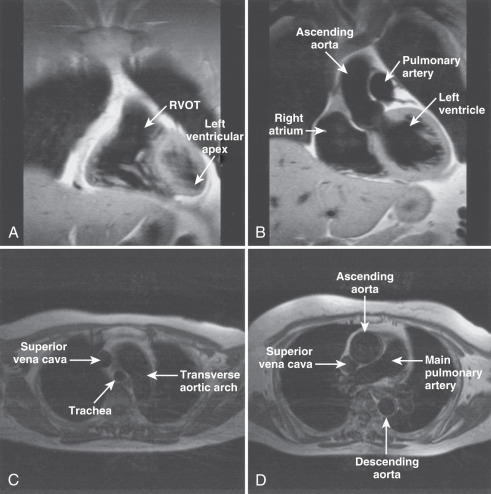
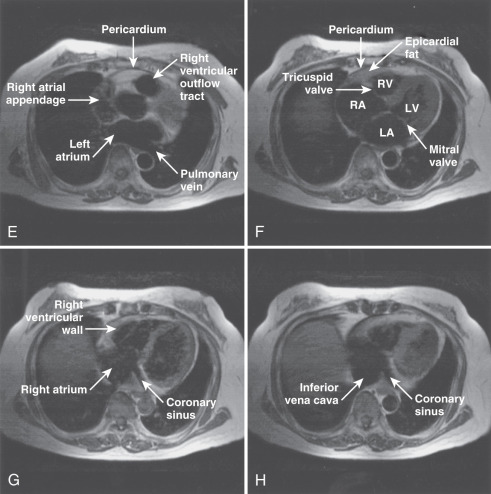
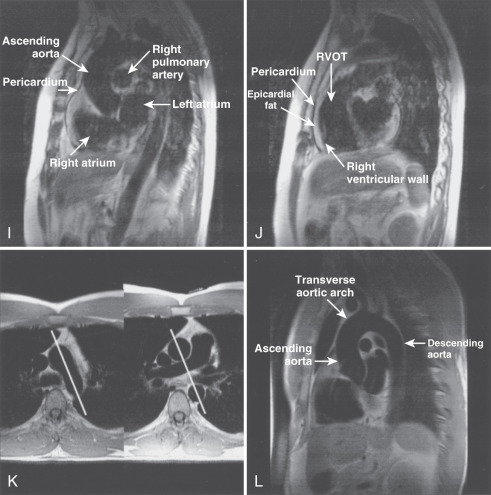
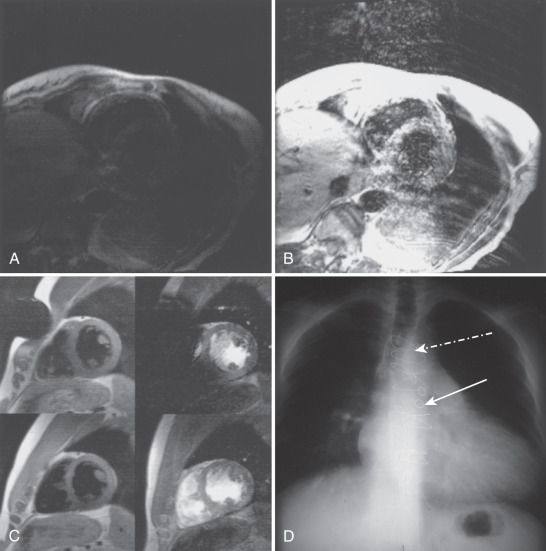
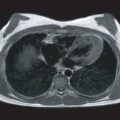
The main structures of normal cardiac anatomy in the coronal, axial, and sagittal planes are shown for spin echo sequences in Fig. 15.2A to J . There are many CMR atlases of cross-sectional anatomy that can be helpful, and on-line resources (e.g., atlas.scmr.org ) with interactive learning of the cross-sectional anatomy can be very useful teaching aids. The reader is recommended to refer to these for further details. From the standpoint of tissue characterization, the spin echo images typically permit the differentiation of fat (white) from muscle (intermediate gray). Black regions in spin echo CMR studies represent several tissues or materials, including air, bone, fibrous tissue, metal, or rapidly moving blood. Note that if fluid moves relatively slowly (for example, in an aneurysm), its signal intensity will increase, which can mimic more solid tissue such as thrombus.
The placement of imaging planes, slice thickness, and in-plane resolution are determined by the size of the structure of interest. As has been indicated in previous chapters, presaturation bands can be added to remove specific artifacts. Other preparatory prepulses can be applied to emphasize or de-emphasize the signal contribution of specific tissues. For example, in the evaluation of arrhythmogenic right ventricular cardiomyopathy (ARVC), it is important to obtain high-resolution spin echo images of the anterior right ventricular (RV) free wall that are free from respiratory artifact (see Chapter 7 ). This goal can be achieved by using a surface coil to improve signal-to-noise ratio (SNR) compared with the standard body coil, and through the use of spatial and/or fat saturation to reduce artifacts from blood and chest wall motion. Breath-hold, double inversion recovery spin echo techniques can also be very effective in removing respiratory artifacts.
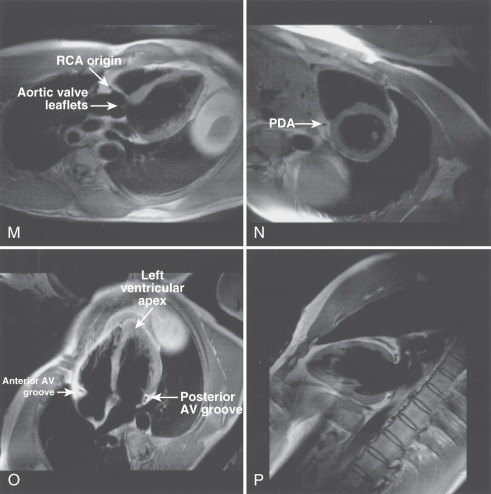
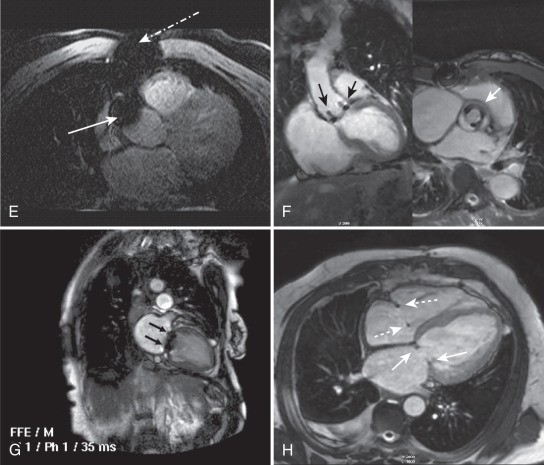
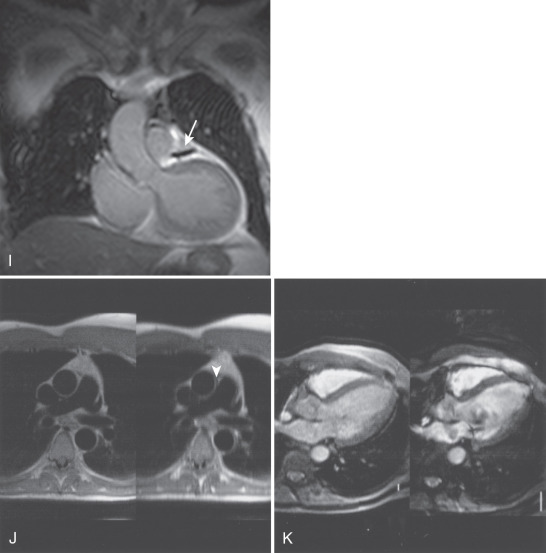
Imaging planes oriented with respect to the principal axes of the body are particularly useful in the evaluation of the aorta, pericardium, anterior RV free wall, and paracardiac masses. Coronal images can be useful because they present tomographic information in an orientation similar to the chest x-ray, which is familiar to most clinicians (see Fig. 15.2A and B ). In general, axial planes are also useful because they are familiar orientations from CT (see Fig. 15.2C to H ). Specific vascular structures of interest that can be evaluated well with axial imaging include the thoracic aorta and its branches, the pulmonary artery and veins, and the superior vena cava (see Fig. 15.2C and D ). Axial images through the heart can be particularly useful in the evaluation of the pericardium and RV free wall (see Fig. 15.2E to H ). They are of limited value in the assessment of LV wall thickness and chamber size because of the variable orientation of the LV relative to the principal axes of the body. Sagittal images are, in general, the least familiar to clinicians and can be more difficult to interpret (see Fig. 15.2I and J ). However, sagittal images are useful in depicting the RV outflow tract and are therefore helpful in the evaluation of patients with congenital heart disease and ARVC. Oblique sagittal planes are useful in the evaluation of the thoracic aorta, and these planes can be easily defined from the transaxial images, especially if three-point plane definition is available using the arch and lower ascending and descending aorta as the reference points ( Fig. 15.2K and L ). Black-blood images ( Fig. 15.2M to P ) oriented along the functional axes introduced in Fig. 15.1 are useful in the definition and tissue characterization of intracardiac and paracardiac masses. In addition, depiction of these planes with double-inversion recovery black-blood imaging is useful for characterization of valvular disease and the coronary artery wall.
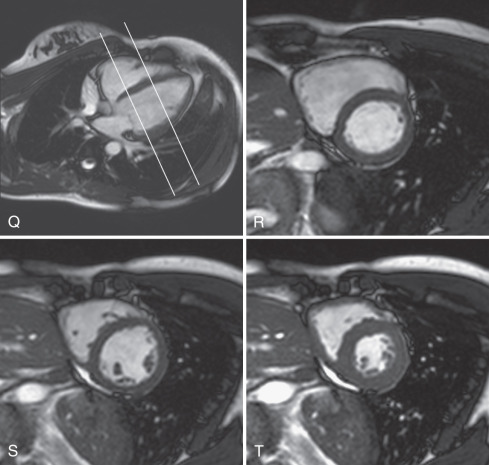
Myocardial function is typically assessed using cine balanced steady-state free precession (bSSFP) imaging, which has supplanted the older segmented gradient recalled echo (GRE) cine methods. The bSSFP provides improved contrast between blood pool and myocardium, particularly in the presence of impaired ventricular function because it is mainly dependent on T1/T2 ratio rather than inflow of unsaturated protons. Both bSSFP and GRE cine methods depict blood as bright (white), whereas muscle is an intermediate gray, and air, bone, fibrous tissue, and metal are dark. The main findings using bright-blood cine CMR of the heart are shown in Fig. 15.1C to H and Fig. 15.2Q to T . These cines are typically used to assess ventricular and valvular function. The LV outflow tract view, for example, is used to show the mitral and aortic valves (see Fig. 15.1G ). One advantage of CMR is the ability to precisely position the long-axis planes to avoid the foreshortening that commonly occurs in contrast ventriculography and two-dimensional (2D) echocardiography (see Fig. 15.1G and H ). Short-axis views are planned from the long-axis views to span the entire LV. The short-axis views in Fig. 15.2R to T are useful in the evaluation of biventricular size and regional function. Using the same orientation to obtain views of the atria can be useful for assessing atrial masses as well as chamber size and function.
To most accurately assess LV function and size, it is important to obtain correctly oriented images that encompass the entire LV throughout the cardiac cycle. To obtain true LV short-axis views, we recommend the following steps. From an axial scout image, the vertical long-axis or two-chamber view is obtained. The horizontal long-axis (HLA) view is planned from the two-chamber view, ensuring that the imaging plane passes through the LV apex and through the center of the mitral valve annulus. A stack of short-axis images is planned from the HLA view (see Fig. 15.1D ), with the short-axis planes perpendicular to an imaginary line passing through the LV apex distally and midway between the visualized portions of the mitral valve annulus basally. It is important to plan the short-axis stack so that it extends just distal to the apex and slightly above the base of the LV to ensure its entire coverage. Failure to do so results in an incomplete dataset of limited use for accurate quantitative LV measurements. The stack of images obtained as described above will be oriented in the LV short-axis orientation; the optimal RV “short-axis” orientation may differ slightly, but the same view can be used for accurate and reliable RV quantitation as well.
Coronary CMR requires yet another set of imaging planes to depict the coronary arteries in tomographic slices when the targeted slab approach is used. Alternatively, whole-heart methods which encompass both ventricles and both coronary trees, yielding a volumetric dataset, may be employed. This subject is discussed in more detail in Chapters 23 and 24 .
Anatomic Variants
Given the ability to obtain images in many planes, be aware of normal structures and anatomic variants that may complicate interpretation of studies. Several potentially confusing features are highlighted here:
- •
Prominence of the lateral border of the right atrial (RA) wall ( Fig. 15.3A ). This structure is a prominence of the trabeculae carneae and crista terminalis and does not represent an atrial mass.
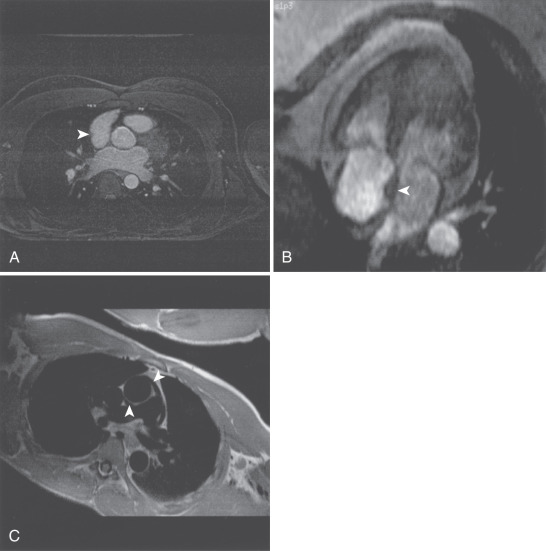
FIG. 15.3
(A) Transverse gradient echo image at the level of the aortic valve obtained using respirator gating with a navigator echo. A right atrial ridge is noted in the lateral wall of the right atrium (arrowhead). This finding is normal and should not be mistaken for a right atrial mass. (B) Single frame from horizontal long-axis balanced steady-state free precession cine cardiovascular magnetic resonance (CMR). Lipomatous hypertrophy of the atrial septum is demonstrated (arrowhead). There is fatty infiltration of the septum that does not involve the region of the fossa ovalis, resulting in the typical “dumbbell” appearance. (C) Oblique double inversion recovery breath-hold CMR image obtained at the level of the right pulmonary artery. The extension of the pericardial space both anterior and posterior to the ascending aorta is demonstrated (arrowheads). The pericardial recess should not be mistaken for evidence of aortic dissection.
- •
Lipomatous hypertrophy of the interatrial septum ( Fig. 15.3B ). Fat deposition in the interatrial septum is occasionally seen, particularly in the elderly. This process spares the region of the fossa ovalis and thus leads to the characteristic dumbbell shape. This process is, in general, considered benign, but it is associated with atrial arrhythmias in older patients. More severe and extensive lipomatous hypertrophy may extend well outside the heart. Imaging with and without fat saturation readily characterizes this abnormality.
- •
Superior pericardial recess ( Fig. 15.3C ). The pericardium normally extends up the ascending aorta, and this space may contain fluid. This recess can be mistaken for aortic dissection or potentially an anomalous coronary vessel in coronary imaging.
Common Variants
A number of artifacts related to CMR can complicate interpretation of the images. The acquisition time is often relatively long compared with physiologic processes, which leads to cardiac and respiratory motion artifacts. This problem must be recognized if present, and minimized at the acquisition stage if possible. Also, because the strength of the local magnetic field determines the position of an object in a CMR image, if the local magnetic field is altered the position of the structure in the image is also altered. Therefore metal on or in the body can alter the local magnetic field, leading to distortion and local signal loss. Hydrogen nuclei in fat experience a slightly different magnetic field compared with hydrogen nuclei in water molecules because of the local chemical environment. This chemical shift is used in CMR spectroscopy to differentiate one compound from another. However, in CMR, this results in what is known as a chemical shift artifact at the interface of water and fatty tissues. This artifact results from sharing of fat and water components within a pixel, leading to signal cancellation. Below are some examples of commonly-encountered artifacts. Finally, many artifacts are amplified at higher field strengths, and protocols optimized for 1.5 T often are not optimal for imaging at 3 T. However, these challenges can be addressed so as to benefit from the advantages offered by imaging at higher field strengths.
Cardiac Motion Artifacts ( Fig. 15.4A and B )
Except for single-shot echo planar imaging (EPI) or other real-time imaging approaches, CMR requires gating to the electrocardiogram (ECG) or peripheral pulse. Problems with gating can result in ghosting and other noise that degrades the quality of the images. In general, focused efforts to obtain the best ECG possible before beginning scanning will minimize cardiac motion artifacts and save time. Surprisingly good-quality images can be obtained in patients with atrial fibrillation, which may be related to the relatively consistent length of systole relative to changes in heart rate. Ventricular bigeminy often results in poor images, in that every other beat is activated differently, resulting in combining data from two different activation patterns. Many CMR systems provide arrhythmia rejection in an attempt to reduce these effects; however, use of these tools generally results in increased scan time because of rejection of cardiac cycles. Vectorcardiographic techniques, which exploit the difference between the normal vector and the vector of the artifact from the magnetohydrodynamic effect, have greatly facilitated reliable ECG gating.
Respiratory Motion Artifacts (see Fig. 15.4A and B )
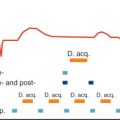
Respiration is associated with significant bulk cardiac motion. Motion in the craniocaudal direction is on the order of a centimeter in normal individuals. This motion can result in significant image degradation with ghosting and blurring, particularly in those with inconsistent respiratory patterns. Strategies to reduce respiratory artifact include the use of breath-hold imaging, presaturation of the high-intensity signal from fat in the chest wall, and the use of respiratory gating. Respiratory gating may be accomplished using a thoracic bellows or by tracking the diaphragm position using a navigator echo (see Fig. 15.4 ). These methods accept cardiac cycles only during some portion of the respiratory cycle. Respiratory gating can substantially improve image quality but increases total scan time. Real-time self-gating methods with continuous data acquisition are gaining increasing interest but are not yet in the clinical realm.
Metal Artifact ( Fig. 15.4C to I )
Apart from safety considerations, pieces of metal outside or inside the body alter the local magnetic field and can result in artifacts. Patients must be screened carefully for the presence of metal, but despite vigilance, objects common in the hospital may still go with the patient into the scanner. Fig. 15.4C shows an artifact related to a safety pin on the patient’s gown. Note that signal loss and distortion are present in both the fast spin echo and GRE images. However, the severity of artifact is worse in the GRE images, severely compromising interpretation of the RV and interventricular septum. Fig. 15.4D and E shows the artifacts related to sternal wires and coronary artery bypass graft markers. Fig. 15.4F shows the artifact related to a bioprosthetic aortic valve, whereas Fig. 15.4G is a mechanical bileaflet mitral valve prosthesis. Fig. 15.4H shows the minimal artifacts associated with mitral and tricuspid annuloplasty rings, and Fig. 15.4I depicts artifact from a stent in the left anterior descending (LAD) coronary artery.
Chemical Shift Artifact ( Fig. 15.4J to K )
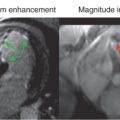
This artifact occurs because the hydrogen nuclei in fat experience a slightly different magnetic field than hydrogen nuclei in water as a result of the different local chemical environment. This process results in displacement of the fat signal in the frequency-encoding direction relative to water and is accentuated with narrow bandwidth sequences, which can present a diagnostic problem in spin echo imaging of patients with suspected aortic dissection. It can be addressed by using a wider bandwidth sequence or repeating the sequence with frequency encoding in the alternate direction, which will result in changing the orientation of the artifact and thus help exclude the presence of an aortic dissection. In EPI, chemical shift effects lead to artifacts displaced in the phase-encoding direction. As shown in Fig. 15.4K , this effect can be minimized using multishot EPI techniques. In single-shot EPI with long acquisition times, the chemical shift effects can be quite large. For this reason, single-shot EPI often employs fat saturation to suppress this artifact.
Normal Cardiac Systolic and Diastolic Function
The management of cardiovascular disease is critically dependent on the assessment of cardiac function. CMR provides highly accurate and reproducible assessments of global and regional cardiac function and CMR is now widely considered as the clinical gold standard for the noninvasive evaluation of cardiac function, a standard by which other noninvasive methods are now validated.
An important consideration in determining function is the temporal resolution or frame rate of the cine CMR sequence. A frame rate of at least 25 frames/s (a temporal resolution of 40 ms/frame) is required to identify end systole accurately. Historically, x-ray contrast left ventriculography has been obtained at a rate of 30 frames/s or a temporal resolution of 33 ms. The frame rate in echocardiography is dependent on speed of ultrasound in the body and the distance of the heart from the transducer, but typically is at least 30 frames/s (temporal resolution of 33 ms or better). Partially parallel imaging methods (e.g., SENSE, SMASH, GRAPPA) are now routinely used in clinical imaging to decrease acquisition time and increase frame rate.
Whereas the CMR cine loop appears to display a single cardiac cycle, the image data are most commonly acquired over multiple heartbeats. As a result, image quality can be markedly degraded in the presence of arrhythmias or unreliable ECG triggering or gating. However, an abnormal but regular ECG, such as bundle-branch block, typically does not adversely affect image quality. Cardiac function is typically assessed during breath-holding, to minimize bulk cardiac translation, but if the goal is to assess the effect of respiration on chamber size or function (e.g., tamponade or constriction), then nonbreath-hold real-time methods may be more appropriate because such techniques acquire images during a fraction of a single heartbeat, and not as a composite over multiple cardiac cycles as with usual segmented k -space sequences. However, real-time CMR has lower spatial and temporal resolution, and may be more prone to artifacts, as compared with “standard” breath-hold approaches. Real-time imaging may also be particularly suitable for CMR-based exercise testing.
Left Ventricle
Assessment of LV function includes global and regional function. Assessment of global LV function is based on measuring changes in chamber volumes. These changes can be estimated from unidimensional (linear) measurements as in echocardiography, but with CMR, more accurate measures of chamber volume can be made using volumetric (three-dimensional [3D]) methods. The 2D methods (e.g., the area-length method or biplane formulas) have minimal advantages over echocardiography and fail to exploit the volumetric advantages of CMR. More accurate measures, particularly in deformed ventricles, which do not fit common geometric formula-based models, can be obtained using the summation of disks method. (In the cardiac imaging literature, this method is commonly referred to as the “Simpson’s rule” method. The mathematical Simpson’s rule is a fourth-order polynomial approximation for numerical integration ; failure to distinguish between the mathematical and medical definitions of “Simpson’s rule” often leads to confusion between clinicians and engineers or medical physicists.) With the summation of disks method, short-axis images are obtained spanning the entire ventricle; the cross-sectional area in each slice is measured, multiplied by the slice thickness (and interslice gap if applicable), and summed over the entire ventricle. This approach is accurate and reproducible and is widely used both clinically and in research.
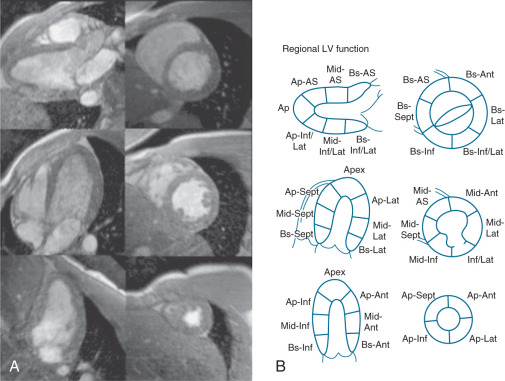
Regional LV systolic function can be assessed both qualitatively (“by eyeball” similar to echocardiography) or quantitatively. As shown in Fig. 15.5 , the standard long-axis, four-chamber, two-chamber, and short-axis views can be mapped onto the standard 17-segment American Heart Association model for qualitative assessment of wall thickening. Wall thickening can also be determined quantitatively using centerline or other methods, and commercial software is available for such analyses. Importantly, myocardial tagging methods can be used to quantify myocardial contractility using strain without the need to identify endocardial or epicardial borders explicitly. However, software for tracking deformation of the tag lines over time nonetheless requires human interaction, prolonging analysis times. The harmonic phase (HARP) technique was proposed to obviate the human postprocessing issue by computing strain based on local spatial frequency of the tag lines. With appropriate bandpass filtering and subsequent transformation of the k -space signal, strain can be extracted automatically. An alternative method, displacement encoding with stimulated echoes (DENSE), combines a stimulated echo with bipolar gradient to encode displacement, from which strain can be calculated. Strain-encoded (SENC) CMR measures through-plane strain and has been applied to stress CMR for assessment of both systolic and diastolic function. These methods have been reviewed in a number of articles and are detailed in Chapters 14 and 22 .
Related posts:
 Use of Navigator Echoes in Cardiovascular Magnetic Resonance and Factors Affecting Their Implementation
 Acute Myocardial Infarction: Cardiovascular Magnetic Resonance Detection and Characterization
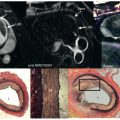 Atherosclerotic Plaque Imaging: Coronaries
 Cardiac Iron Loading and Myocardial T2*
 Pulmonary Vein and Left Atrial Imaging
 Noncardiac Pathology
Stay updated, free articles. Join our Telegram channel

Full access? Get Clinical Tree


