Physiologic Aspects of Cardiac Imaging
QUESTIONS
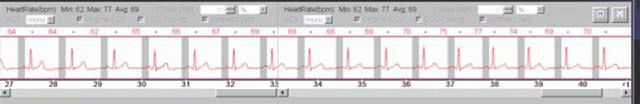
1a A 50-year-old male underwent a gated cardiac CTA (CCTA) acquisition using a 64-slice CT scanner. The gray box shows the only phase of the cardiac cycle during which images were obtained. What characterizes this phase of the cardiac cycle?
|
A. Atrial relaxation
B. Open mitral valve
C. Closed tricuspid valve
D. Ventricular contraction
View Answer
1a Answer B. The image shows the EKG tracing from a cardiac CTA acquisition. The gray box corresponds to late ventricular diastole, just prior to ventricular contraction. During late diastole, the mitral and tricuspid valves are open. During the late phase of diastole, the atrial has a minimal contraction allowing to fill the ventricles. The ventricles contract during systole, which corresponds to the QRS complex.
Reference: Klabunde R. Cardiovascular physiology concepts. Lippincott Williams & Wilkins, 2011: 62-63. ISBN-10: 1451113846.
1b A 50-year-old male underwent a gated cardiac CTA (CCTA) acquisition using a 64-slice CT scanner. The gray box shows the only phase of the cardiac cycle during which images were obtained. Why would the images be obtained using such an approach?
A. Allows ejection fraction to be calculated
B. Improves temporal resolution
C. Lower impact of elevated heart rate
D. Reduces radiation dose
View Answer
1b Answer D. The patient was imaged using prospective triggering in order to reduce the radiation dose. During prospective triggering only a short segment of the cardiac cycle, usually diastole, is imaged resulting in no imaging in the remainder of the cardiac cycle and as a result no radiation being given. This method contrasts to retrospective gating during which the entire cardiac cycle is imaged resulting in a higher radiation dose since both systole and diastole are imaged.
References: Hirai N, et al. Prospective versus retrospective ECG-gated 64-detector coronary CT angiography: assessment of image quality, stenosis, and radiation dose. Radiology 2008;248(2):424-430. doi: 10.1148/radiol.2482071804.
Menke J, et al. Head-to-head comparison of prospectively triggered vs retrospectively gated coronary computed tomography angiography: meta-analysis of diagnostic accuracy, image quality, and radiation dose. Am Heart J 2013;165(2):154-163. doi: 10.1016/j.ahj.2012.10.026.
1c Patients undergoing a cardiac CTA (CCTA) can receive a lower radiation dose through which of the following strategies?
A. Decreasing the pitch
B. Employing retrospective gating
C. Increasing mAs
D. Reducing kVp
View Answer
1c Answer D. Radiation dose can be reduced by decreasing the mAs, decreasing the kVp, using prospective triggering, and reducing the scan length. Reducing the pitch will increase the amount of radiation to the imaged area.
References: Labounty TM, et al. Coronary CT angiography of patients “with a normal body mass index using 80 kVp versus 100 kVp: a prospective, multicenter, multivendor randomized trial. AJR Am J Roentgenol 2011;197(5):W860-W867. doi: 10.2214/AJR.11.6787.
Leipsic J, et al. A prospective randomized controlled trial to assess the diagnostic performance of reduced tube voltage for coronary CT angiography. AJR Am J Roentgenol 2011;196(4):801-806. doi: 10.2214/AJR.10.5786.
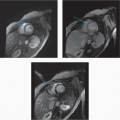
A. An ejection fraction >55%
B. Elongated mitral valve leaflet
C. Left ventricular wall thickening
D. Wall motion abnormalities
View Answer
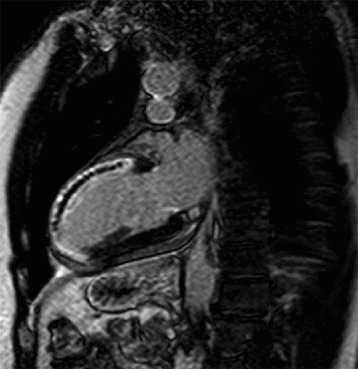
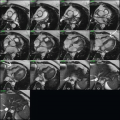
2a Answer D. The image shows delayed enhancement along the left anterior descending coronary artery territory from an acute myocardial infarction with microvascular obstruction and no myocardial thinning indicating an acute infarction. Myocardial infarction and delayed enhancement are associated with wall motion abnormalities and decreased ventricular function.
References: Boagert J, et al. Remote myocardial dysfunction after acute anterior myocardial infarction: impact of left ventricular shape on regional function: a magnetic resonance myocardial tagging study. J Am Coll Cardiol 2000;35(6):1525-1534. doi: 10.1016/S0735-1097(00)00601-X.
Marra MP, Lima JAC, Iliceto S. MRI in acute myocardial infarction. Eur Heart J 2011;32(3):284-293. doi: http://dx.doi.org/10.1093/eurheartj/ehq409. First published online: 26 November 2010. doi: 10.1016/S0735-1097(00)00601-X.
2b A severely decreased left ventricular systolic ejection fraction measures less than which value?
A. 55%
B. 50%
C. 45%
D. 40%
E. 35%
View Answer
2b Answer E. A severly decreased ejection measures less than 35%. Patients with a severly decreased ejection fractions are at higher risk for arrhythmia and may require device placements (AICD’s).
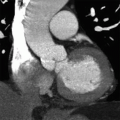
A. Decreased left ventricular filling pressure
B. Dilated ascending aorta
C. Narrowing of the left ventricular outflow tract
D. Thickening of the aortic valve leaflets
View Answer
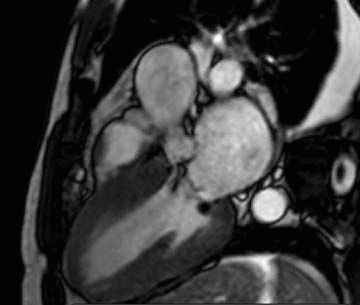
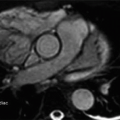
3a Answer C. The three-chamber image shows narrowing along the left ventricular outflow tract. There is also dephasing artifact along the left ventricular outflow tract indicating turbulent flow and velocity elevation in this patient with a diagnosis of hypertrophic cardiomyopathy.
References: Bogaert J, Olivotto I. MR Imaging in Hypertrophic Cardiomyopathy: from Magnet to Bedside. Radiology 2014;273(2):329-348. doi: 10.1148/radiol.14131626.
Chun EJ, et al. Hypertrophic cardiomyopathy: assessment “with MR imaging and multidetector CT. Radiographics 2010;30(5):1309-1328. doi: 10.1148/rg.305095074.
3b Which of the following physiologic changes occurs in the left heart in hypertrophic obstructive cardiomyopathy (HOCM)?
A. Decreased myocardial mass
B. Elevated left atrial pressure
C. Increased left ventricular compliance
D. Decreased atrial kick
View Answer
3b Answer B. Patients with hypertrophic cardiomyopathy have an increased myocardial mass, an elongated mitral valve leaflet, and decreased left ventricular compliance. The increased mass makes it difficult for blood to fill the left ventricle during diastole and leads to diastolic dysfunction. Patients with diastolic dysfunction have increased left atrial pressure and an increased left atrial kick in an attempt to further fill the left ventricle.
References: Bogaert J, Olivotto I. MR Imaging in Hypertrophic Cardiomyopathy: from Magnet to Bedside. Radiology 2014;273(2):329-348. doi: 10.1148/radiol.14131626.
Chun EJ, et al. Hypertrophic cardiomyopathy: assessment “with MR imaging and multidetector CT. Radiographics 2010;30(5):309-1328. doi: 10.1148/rg.305095074.
3c Which of the following left ventricular changes in hypertrophic obstructive cardiomyopathy (HOCM) is most associated with the highest risk of sudden cardiac death?
A. Diastolic dysfunction
B. Mitral leaflet elongation
C. Mitral regurgitation
D. Septal thickening
View Answer
3c Answer D. Patients with HOCM are at risk for sudden cardiac death. The features most associated with cardiac death include prior cardiac arrest, recurrent syncope, family history of cardiac death, left ventricular hypertrophy (wall thickness > 30 mm), and increased pressure along the left ventricular outflow tract gradient (30 mm Hg).
References: Bogaert J, Olivotto I. MR Imaging in Hypertrophic Cardiomyopathy: from Magnet to Bedside. Radiology 2014;273(2):329-348. doi: 10.1148/radiol.14131626.
Chun EJ, et al. Hypertrophic cardiomyopathy: assessment “with MR imaging and multidetector CT. Radiographics 2010;30(5):1309-1328. doi: 10.1148/rg.305095074.
Frenneaux MP. Assessing the risk of sudden cardiac death in a patient “with hypertrophic cardiomyopathy. Heart 2004;90(5):570-575. doi: 10.1136/hrt.2003.020529.
4 Which of the following describes isovolumetric contraction of the ventricles?
A. Corresponds to the trough of the QRS complex.
B. The mitral and tricuspid valves are open.
C. Ventricular pressure increases.
D. Ventricular volume decreases.
View Answer
4 Answer C. During isovolumetric contraction of the ventricles, the pressure within the ventricle rises; however, the volume within the ventricle does not change. During isovolumetric contraction, the tricuspid and mitral valves are closed. The pressure in the ventricles, however, is not yet greater than the systemic pressure, and as a result, the aortic and pulmonic valves are closed.
References: http://www.cvphysiology.com/Heart%20Disease/HD002b.htm
http://www.austincc.edu/emeyerth/isovolum.htm
5 Which of the following is characteristic of atrial systole?
A. By the T wave on an electrocardiogram
B. Contributes 20% to 30% of ventricular volume
C. Decreasing atrial pressure
D. Overlaps with early ventricular systole
E. Increases afterload
View Answer
5 Answer B. Atrial systole occurs when the small amount of muscle within the atria contract correlating to the “P” wave on an EKG. During atrial systole, atrial contraction, in combination with decreased ventricular pressure, contributes to up to 20% to 30% of blood flowing into the ventricles. Atrial systole, therefore, contributes to ventricular volume, which increases the preload, not the afterload.
Reference: http://www.cvphysiology.com/Heart%20Disease/HD002a.htm
6 Which of the following conditions increases the ventricular preload?
A. Decreased atrial contraction
B. Decreased ventricular compliance
C. Deep inspiration
D. Elevated heart rate
E. Ligating an arterial-venous fistula
F. Reduced atrial pressure
View Answer
6 Answer C. Preload is altered by the volume of blood within the ventricle. Factors that increase central venous return will increase blood in the ventricle and thereby increase the preload. A noncompliant ventricle will cause less blood to be in the ventricle. An elevated heart rate will afford less time and less blood to fill the ventricle. Ligating a fistula will decrease venous return, thereby decreasing blood volume and preload. Reduced atrial pressure and decreased atrial contraction will result in less blood filling the ventricles and a reduced preload.
References: Suzanne C, O’Connell S, Bare BG, et al. Brunner & Suddarth’s textbook of medical-surgical nursing, Volume 1, 2010:824.
http://cvphysiology.com/Cardiac%20Function/CF007.htm
7 Aliasing on phase contrast cardiac MRI occurs if the angular phase shift is
A. >120 degrees and the velocity within that pixel is then misregistered
B. >150 degrees and the velocity within that pixel is then misregistered
C. >180 degrees and the velocity within that pixel is then misregistered
D. >210 degrees and the velocity within that pixel is then misregistered
View Answer
7 Answer C. During a phase contrast acquisition, the Venc should be set at a value greater than the maximum expected velocity. Once the sequence is started, protons in the blood will experience a phase shift proportional to their velocity, while non moving objects have no phase shift in response to the pulses. If the velocity of blood is higher than the Venc, the phase shift will be >180 degrees and aliasing will occur. As long as the Venc is larger than the fastest velocity of blood, no aliasing will occur.
References: Ferreira PF, et al. Cardiovascular magnetic resonance artefacts. J Cardiovas Magn Reson 2013;15:41. doi: 10.1186/1532-429X-15-41.
Lee VS. Cardiovascular MR: Physical principles to practical protocols. Lippincott Williams & Wilkins, 2006;206.
8 In preparation for a cardiac CTA, a patient was administered 100 mg of metoprolol via an oral tablet. Which of the following describes the mechanism of metoprolol?
A. Increases the heart rate
B. Stimulates the beta-1 receptors
C. Exerts positive inotropic effects
D. It is a cardioselective beta blocker
View Answer
8 Answer D. Metoprolol is a type of beta blocker that can be administered orally or intravenously to patients undergoing cardiac CTA. Metoprolol acts by selectively blocking the beta-1 receptor. As a result, the heart rate and blood pressure will decrease and it will have a net negative ionotropic effect on the heart.
References: Marx JA. “Cardiovascular drugs”. Rosen’s emergency medicine: concepts and clinical practice, 8th ed. Philadelphia, PA: Elsevier/Saunders, 2014. Chapter 152. ISBN 1455706051.
http://www.nlm.nih.gov/medlineplus/druginfo/meds/a682864.html
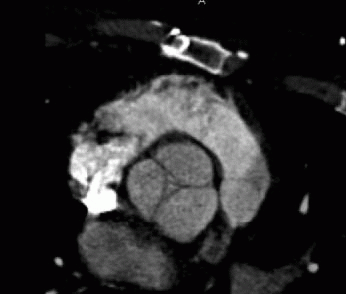
A. A valve area of 1.3 cm2
B. A valve calcium score of 2,000
C. A velocity gradient of 45 mm Hg
D. A velocity jet of 3 m/sec
E. A bicuspid valve
View Answer
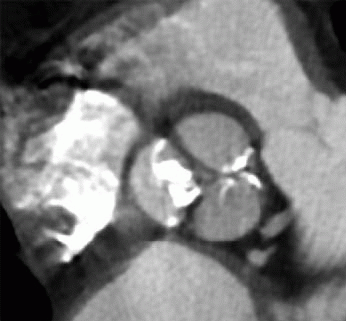
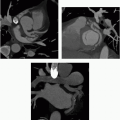
9a Answer C. The image shows a tricuspid aortic valve at end ventricular systole in a patient with severe aortic stenosis. The valve leaflets are thickened and calcified with only a small open valve area. Severe aortic stenosis is diagnosed with a valve area measuring <1.0 cm2 (by valve planimetry). Other values characteristic of aortic stenosis can be quantified by cardiac MRI and include a velocity gradient >40 mm Hg or a velocity jet >4.0 m/sec.
References: Feuchtner G. Imaging of cardiac valves by computed tomography. Scientifica 2013;2013:13. Article ID 270579. doi: 10.1155/2013/270579.
John AS. Magnetic resonance to assess the aortic valve area in aortic stenosis: how does it compare to current diagnostic standards? J Am Coll Cardiol 2003;42(3):519-526. doi: 10.1016/S0735-1097(03)00707-1.
9b The above patient has aortic stenosis and underwent a cardiac MRI. The velocity across the valve was calculated to measure 150 cm/sec. Given the velocity, what is the estimated pressure gradient?
A. 5.5 mm Hg
B. 6 mm Hg
C. 8 mm Hg
D. 9 mm Hg
View Answer
9b Answer D. The pressure gradient can be calculated using the modified Bernoulli equation (pressure gradient (mm Hg) = 4vmax2) where the maximum velocity (vmax) is reported in meters per second
Using the above equation and values: 150 cm/sec = 1.5 m/sec
Pressure gradient = 4(1.5 m/sec)2
Pressure gradient = 9 mm Hg
References: Feuchtner G. Imaging of cardiac valves by computed tomography. Scientifica 2013;2013:13. Article ID 270579. doi: 10.1155/2013/270579.
John AS. Magnetic resonance to assess the aortic valve area in aortic stenosis: how does it compare to current diagnostic standards? J Am Coll Cardiol 2003;42(3):519-526. doi: 10.1016/S0735-1097(03)00707-1.
10a The below image was obtained in diastole. Which of the following describes the underlying process?
|
A. Aortic stenosis
B. Bicuspid aortic valve
C. Increased end-diastolic volume
D. Pulmonic insufficiency
E. Pulmonic stenosis
View Answer
10a Answer C. The image shows an aortic valve in diastole. At this moment, the aortic valve should be fully closed (complete coaptation); however, centrally, the valve is open. Incomplete coaptation of the valve is a sign of aortic insufficiency. Aortic insufficiency will result in an increased end diastolic volume and ventricular dilation secondary to backflow of blood from the aorta into the ventricle. The severity of aortic insufficiency can be quantified by cardiac MRI using a phase contrast sequence.
References: Cawley PJ, et al. Valvular heart disease: changing concepts in disease management cardiovascular magnetic resonance imaging for valvular heart disease technique and validation. Circulation 2009;119:468-478. doi: 10.1161/CIRCULATIONAHA.107.742486.
Feuchtner G. Imaging of cardiac valves by computed tomography. Scientifica 2013;2013:13. Article ID 270579. doi: 10.1155/2013/270579
10b Aortic insufficiency can be quantified using phase contrast MRI. Which of the below indicates severe aortic insufficiency?
A. A bicuspid aortic valve
B. A dilated left ventricle measuring 6.5 cm
C. A regurgitant volume of 65 mL
D. An aortic valve area of 0.9 cm2
View Answer
10b Answer C. Aortic insufficiency can be graded from mild to severe. Severe aortic insufficiency can be diagnosed by a regurgitant volume >60 mL/beat or a regurgitant fraction >50%. Other features associated with aortic insufficiency include holodiastolic flow reversal in the descending aorta, incomplete leaflet coaptation, increased end-diastolic volume, and ventricular dilation.
References: Cawley PJ, et al. Valvular heart disease: changing concepts in disease management cardiovascular magnetic resonance imaging for valvular heart disease technique and validation. Circulation 2009;119:468-478. doi: 10.1161/CIRCULATIONAHA.107.742486.
Maurer G. Aortic regurgitation. Heart 2006;92(7):994-1000. doi: 10.1136/hrt.2004.042614.
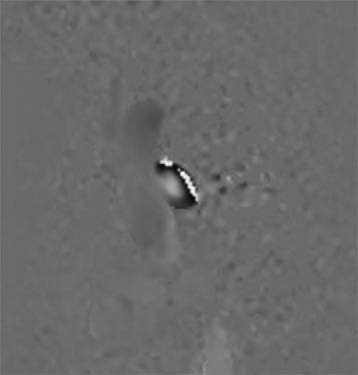
A. An incorrect inversion time
B. An incorrect velocity map
C. Incomplete fat saturation
D. Too high temporal resolution
E. Too low spatial resolution
View Answer
11a Answer B. The image is from a phase contrast cardiac MRI acquisition. The sequence produces two data sets (magnitude image and phase velocity maps). When acquiring the data set, the user sets the Venc (velocity range measured by the sequence). The Venc should be set at a value greater than the maximum expected velocity. If the actual velocity is greater than the Venc, aliasing will occur. This can be solved by repeating the sequence with a higher Venc.
References: Ferreira PF, et al. Cardiovascular magnetic resonance artefacts. J Cardiovas Magn Reson 2013;15:41. doi: 10.1186/1532-429X-15-41.
Lee VS. Cardiovascular MR: Physical principles to practical protocols. Lippincott Williams & Wilkins, 2006:206.
11b A phase contrast cardiac MRI (CMRI) sequence produces two sets of images. What set of images are produced by the phase contrast acquisition?
A. Magnitude image and phase velocity map
B. Magnitude image and volume map
C. Magnitude image and velocity gradient map
D. Magnitude image and pressure gradient map
View Answer
11b Answer A. The phase contrast cardiac MRI acquisition produces two data sets (magnitude image and phase velocity maps). The images are viewed and the vessel of interest is evaluated with contour lines placed over the area of interest.
References: Ferreira PF, et al. Cardiovascular magnetic resonance artefacts. J Cardiovas Magn Reson 2013;15:41. doi: 10.1186/1532-429X-15-41.
Lee VS. Cardiovascular MR: Physical Principles to practical protocols. Lippincott Williams & Wilkins, 2006:206.
12 A patient is given intravenous beta blockers in preparation for a cardiac CTA. What is the impact of this agent on the Frank Starling Curve?
A. Shifts the Frank-Starling curve upward and to the right
B. Shifts the Frank-Starling curve downward and to the right
C. Shifts the Frank-Starling curve upward and to the left
D. Shifts the Frank-Starling curve downward and to the left
View Answer
12 Answer B. Beta blockers are negative inotropic agents. As a result, once beta blockers are administered, they will decrease myocardial contractility. The Frank-Starling curve is a graphical tool that shows how cardiac output changes in response to changes in heart rate or stroke volume. The administration of beta blockers will reduce contractility and heart rate resulting in a shift of the curve down and to the right. A positive inotrope would shift the curve up and to the left.
References: Marx JA. “Cardiovascular drugs”. Rosen’s emergency medicine: Concepts and clinical practice, 8th ed. Philadelphia, PA: Elsevier/Saunders, 2014. Chapter 152. ISBN 1455706051.
http://www.nlm.nih.gov/medlineplus/druginfo/meds/a682864.html
http://www.cvphysiology.com/Cardiac%20Function/CF003.htm
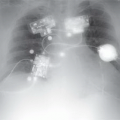
13a A patient underwent a coronary venogram and it showed abnormal connection between the coronary sinus and which structure?
Related posts:
Stay updated, free articles. Join our Telegram channel

Full access? Get Clinical Tree


