103CHAPTER 8
Quality Management
The good practice of a robust quality management (QM) program involves not only the science but also the art of dealing with a variety and complexity of human conditions. The American Association of Physicists in Medicine (AAPM) Task Group 100 (TG-100) provides guidelines to develop a system-based QM program that can produce consistent improved outcomes for treatment processes. Significant effort is required to move from a traditional quality assurance (QA) program that focuses on the machine performance characteristics to a prospective risk-analysis-based QM program to achieve the desired quality across all activities in the workflow. Even with sufficient QA procedures in place, external audits can identify inconsistencies and systematic errors in an institution’s workflow (1). It is essential to develop a robust QM program for stereotactic radiosurgery (SRS) and stereotactic body radiation therapy (SBRT) programs because such treatments require a high level of accuracy and precision compared with conventional three-dimensional (3D) or intensity-modulated radiation therapy (IMRT) treatments. The development and implementation of a good QM program can enable us to treat the patient in the safest possible manner ensuring the best possible outcomes, while conforming to national standards, such that errors are minimized. In essence, quality and safety are two sides of the same coin. Spending time to develop a quality program will provide for a safer environment for patient care.
Policies and procedure manuals are required by The Joint Commission (TJC), formerly the Joint Commission on the Accreditation of Healthcare Organizations (JCAHO). These policies and procedures provide a good guideline to ensure the entire QM team understands the workflow and individual responsibilities. The policies and procedures should include information that extends outside traditional machine QA and are not limited to treatment procedures, treatment planning, or radiation safety. They should be reviewed annually by a QM committee to ensure that procedures remain current and relevant. Documentation of the traditional device-centric QA performed is used to show that the devices are within specifications to treat patients safely. Many institutions are moving to a paperless environment, using databases and/or Excel sheets to collect data. With large databases, data can be plotted and tracked to resolve any trends. Proper training and documentation of the training of personnel performing the QA is required to ensure high-quality work from the QA team. After an initial training period, trainees should undertake competency tests to ensure that they can perform a given task independently. Competencies should be designed to cover each portion of the QM program and be repeated at predetermined intervals.
This chapter discusses the methodologies for establishing a risk-based QM program and the technical specifications of treatment platform QA. The QM of the entire clinical process needs a sound multidisciplinary approach with close cooperation among all the team members and continuous process analysis and reevaluation. The QM of an 104SRS/SBRT system must guarantee that the imaging system, the treatment planning system (TPS), and the treatment delivery systems are functioning within the specifications. A complete end-to-end (E2E) verification of the system is important to ensure that no errors are propagated from commissioning throughout the workflow.
RISK-BASED QUALITY MANAGEMENT PROGRAM
In 2016, the AAPM released TG-100 report: Application of risk analysis methods to radiation therapy quality management (2). This highly anticipated document provided physicists working in radiation oncology guidance on how to establish a QM program in a systematic way on the basis of prospective approaches to risk analysis of clinical processes.
The differences between the AAPM TG-100 report and others are not trivial. This is not a prescriptive document; rather, this report recommends that professionals involved in the care of patients at every institution map out clinical processes that are appropriate to the care of these patients and use the guidance provided in the TG-100 report to develop a risk-based QM program that will be unique to their institution.
Risk Assessment
The authors of TG-100 chose to focus on three industrial engineering risk assessment tools: process mapping, failure modes and effects analysis (FMEA), and fault tree analysis (FTA).
Process Maps
There are many ways to approach quality and safety when developing a QM program. Two approaches that can be used are prospective and reactive. The reactive approach is complementary to the prospective. The prospective approach begins with mapping out a clinical process and the steps involved in that process. TG-100 recommends that professionals, such as physicians, physicists, dosimetrists, therapists, nurses, IT professionals, and administrators, involved in the care of patients should be involved in the design of the process map (3–6). A process map can be regarded as a graphical representation of the steps, actions, or task of a process arranged in a sequential, or sometimes parallel, order. An example of the process map for external beam radiation treatment for a patient may consist of various subprocesses such as patient consults, CT simulation, treatment planning, plan checks, imaging, and treatment. Each subprocess can further be subdivided into many steps that consist of the subprocess. An example of the various steps for the subprocess treatment planning could be importing images in the TPS, registration of image datasets from multiple imaging modalities, contouring, beam weight optimization, dose calculation, plan review, and preparation for treatment. One of the advantages of developing a process map is that every member of the clinical team involved in the care of patients has the same understanding of the process, thereby minimizing the possibilities of errors. Figure 8.1, from TG-100, provides an excellent example of the process map/workflow for the IMRT treatment process from initial diagnosis to successful treatment.
When developing a process, it is important to pay attention to the details. If the process map is too coarse, important details could be left out. On the contrary, if the process map is too fine, then the overall task of developing a risk-based QM program can become unmanageable, thereby leading to frustrations because the task could not be completed in a timely fashion.
Failure Modes and Effects Analysis
TG-100 defines failure as not meeting the desired level of quality. There are many different ways in which a specific process step can fail, each of which constitutes a failure mode. FMEA is a risk assessment tool. It is used to identify weaknesses or deficiencies in a process. It assesses potential errors (unintended process step outcome that compromises overall process success) and the risks associated with each error inherent within a process. It is a step-by-step approach for identifying potential failures (postulated failure modes) in a clinical process.
One needs to start with a process map of the process to be investigated and list each step in the process to complete an FMEA. One then identifies all possible ways by which a process step could fail. These are the potential failure modes (2, 7–9). The next step is to determine the effect of the consequences and severity of each failure mode on the patient when the failure mode occurs. This is determined by a severity rating S that is rated on a scale of 1 to 10. One then determines all the potential root causes for each failure mode and the likelihood of occurrence of the causes of the failure mode. Occurrence O is also rated on a scale of 1 to 10. The next step is to determine the likelihood of detection of each failure mode. The detectability rating D, also rated on a scale of 1 to 10, rates the estimate that the controls in place will not detect the failure mode should it occur. Table 8.1, from TG-100, provides guidance on how to assign the O, S, and D values for different situations.
105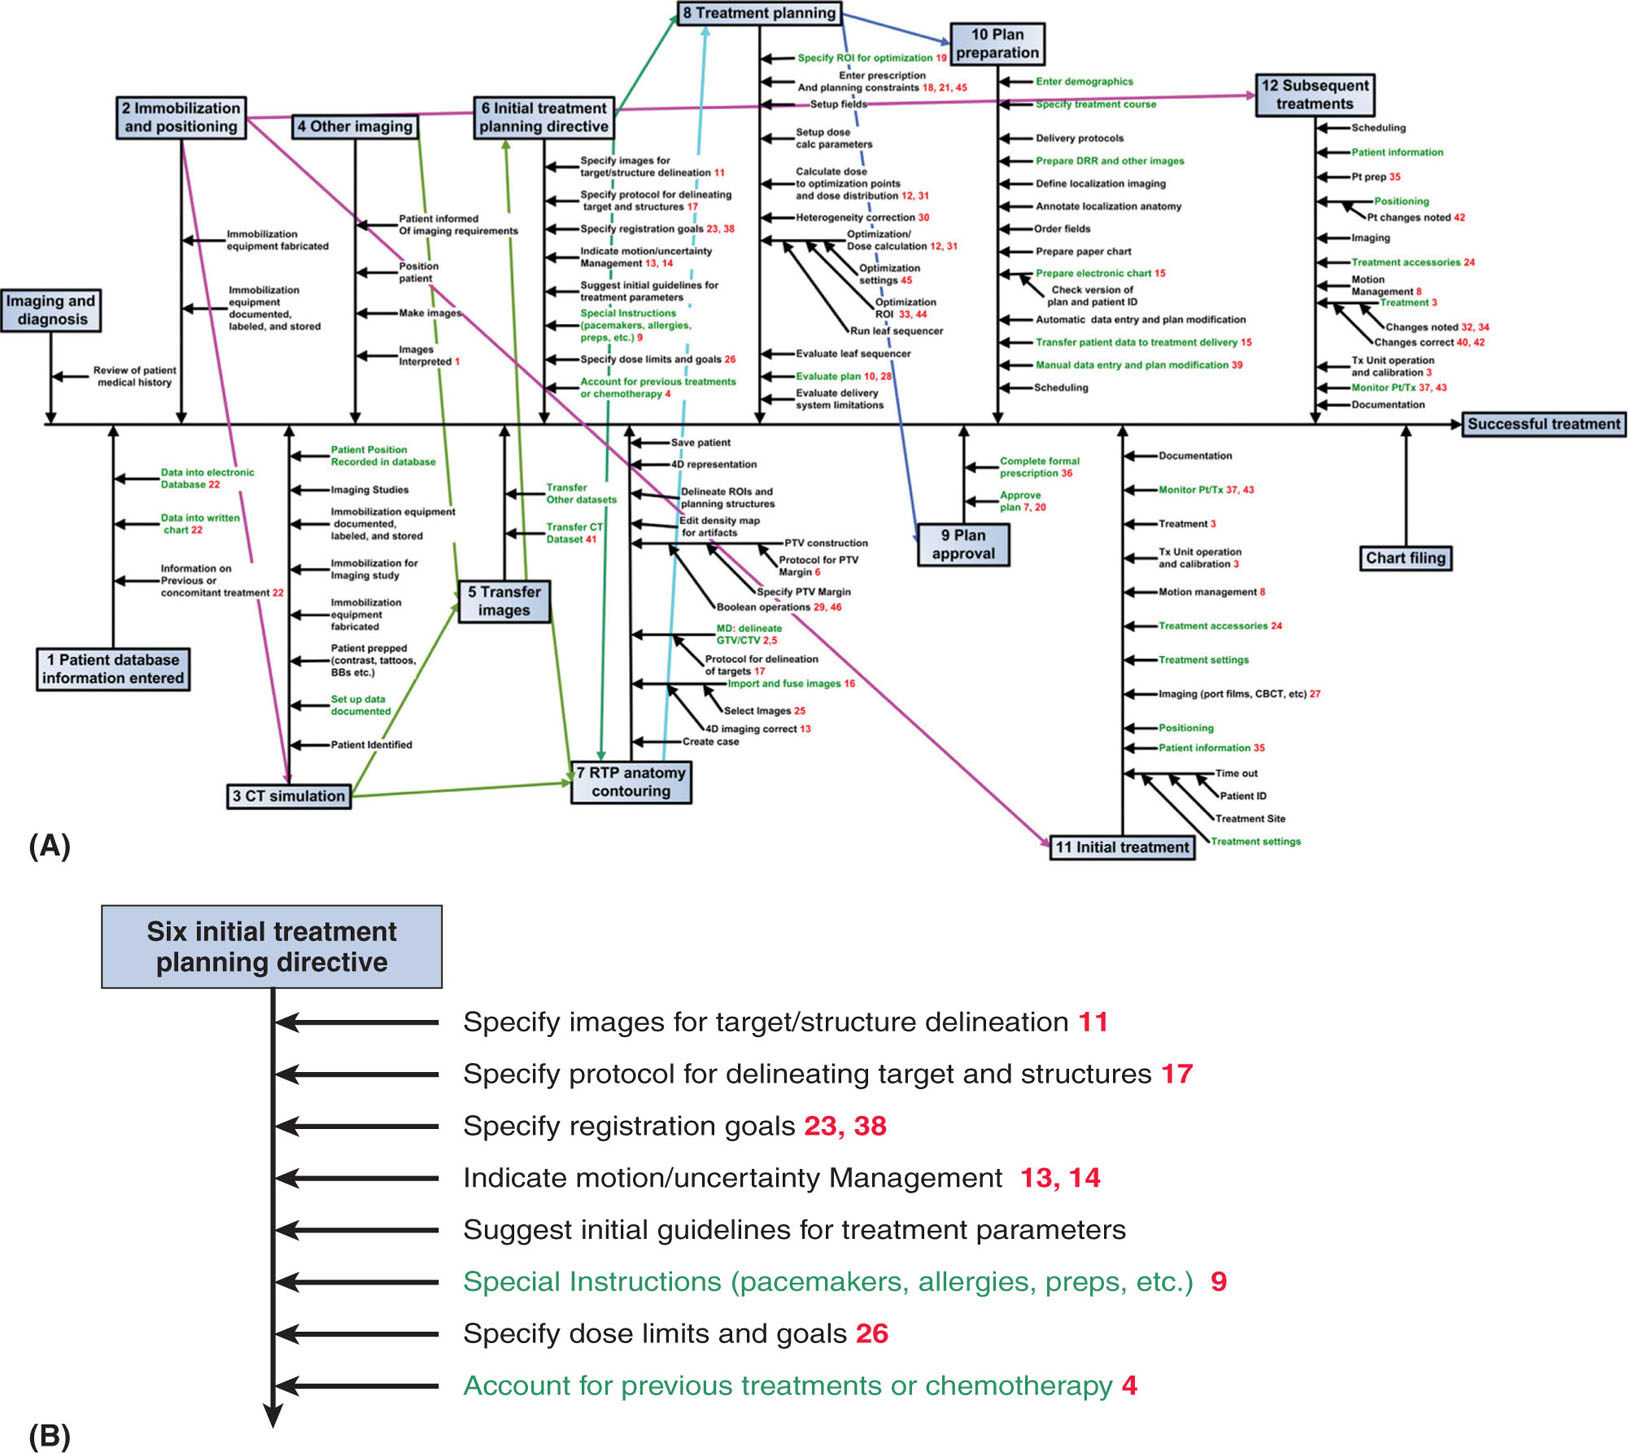
FIGURE 8.1 (A) An IMRT process tree and (B) a magnified view of the initial treatment planning directive branch. The red numbers indicate (hazard ranking) the most hazardous 20% to 25% of the steps as indicated by high-risk priority number values. Steps with high severity hazards are shown in green (see text and Section VIII in reference 64 for details). A hazard is something that can cause harm. A risk is the chance, high or low, that any hazard will actually cause somebody harm.
IMRT, intensity-modulated radiation therapy; RTP, real-time planning.
Source: From Huq MS, Fraass BA, Dunscombe PB, et al. The report of Task Group 100 of the AAPM: application of risk analysis methods to radiation therapy quality management. Med Phys. 2016;43(7):4209-4262. doi: 10.1118/1.4947547. http://onlinelibrary.wiley.com/doi/10.1118/1.4947547/full#f1
From the values of O, S, and D, one calculates a metric called the risk priority number (RPN), which is given as a product of the three indices O, S, and D. The RPN is a measure of hazard for a given step; its value ranges from 1 to 1,000. A very high value of RPN is a measure of a very hazardous step. Similarly, a high value of S is an indication of a very serious step. Once FMEA is completed for all the steps for a given process, the hazard and severity ranks for all the various steps can be prioritized according to their RPN and S values. This information can then be used to develop a risk-based QM program.
106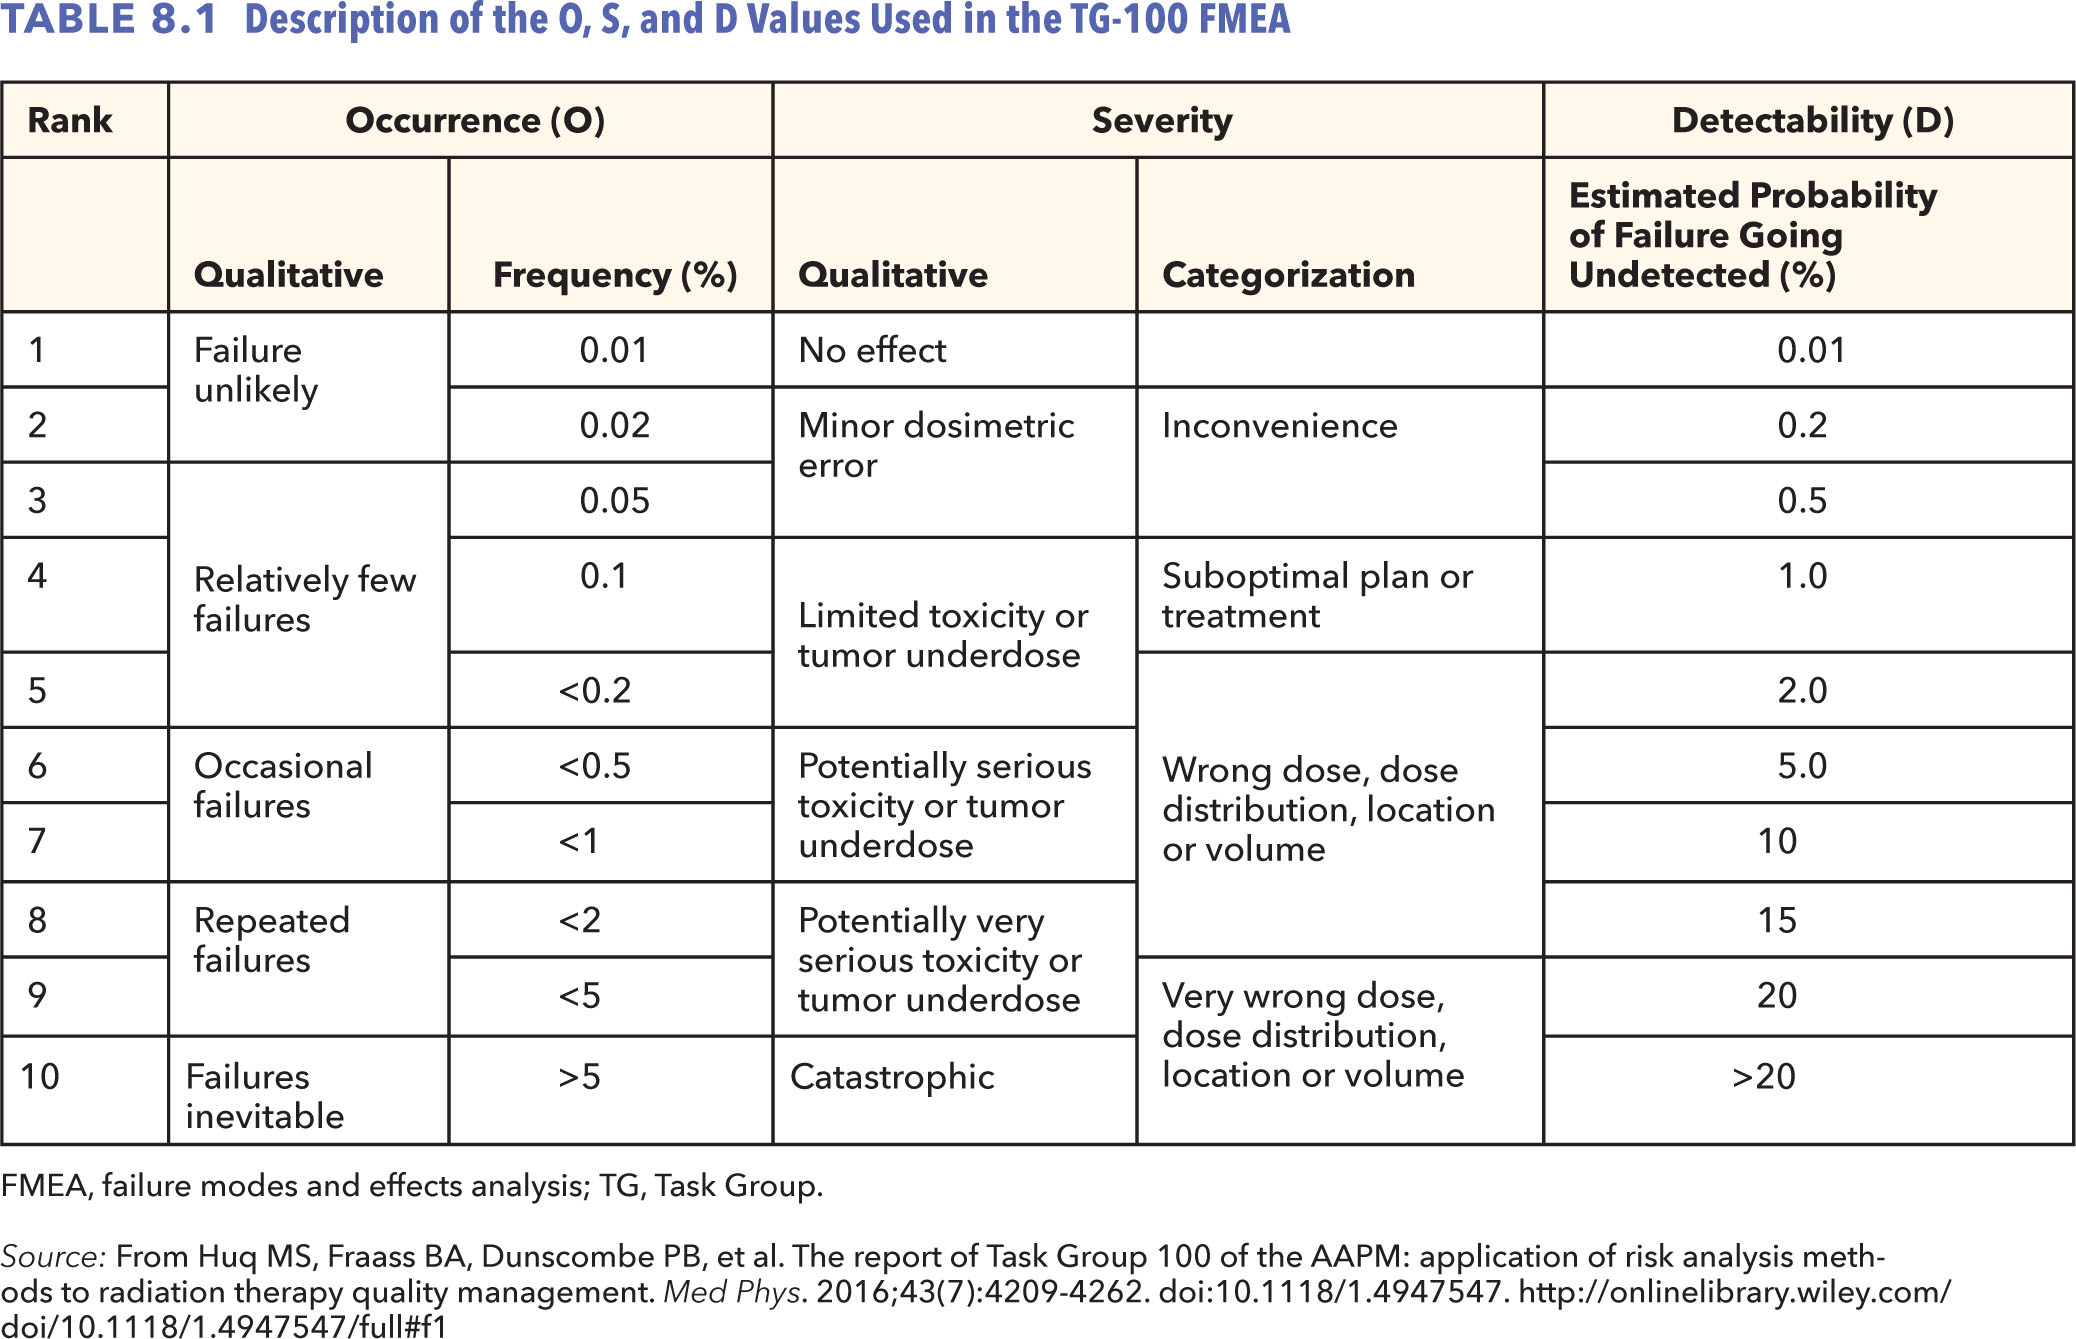
Fault Tree Analysis
During the FMEA, one identifies all the potential failure modes (or the multiple failures) and the causes that initiate each of the failure pathways. Fault tree complements FMEA by adding more detailed information to a FMEA. A fault tree starts with a possible error (i.e., a failure mode) and works backward in time to study what could possibly cause that failure. At every step, the user asks the question what could cause that particular failure and keeps working backward until she or he arrives at causes that are actionable. A fault tree thus gives a visual representation of the propagation of failure in a procedure. FTA is a tool that allows one to visualize potential locations for effective placement of efficient QM measures because the propagation of failures through the process is more visually illustrated in the FTA than in the FMEA spreadsheet. A fault tree thus complements FMEA in making a radiation therapy system safer through using postulated failure modes, tracing the failure pathways back, and, on the basis of the FTA, identifying possible systemic program weaknesses so that the user can place barriers and controls (QA and quality control [QC]) to prevent the failure from propagating through the process and causing harm to the patient.
Figure 8.2, from TG-100, gives an example of a fault tree for an error in calculated value for a patient. This fault tree begins on the left in the figure with the potential failure mode “Error in calculated value for patient” and then progresses all the way to the right where the actionable cause for this failure is identified as “error in data” or “error in data input” or “error in calculation algorithm” or “error in prescription.” Because each of these causes can cause an error in the calculated value for the patient, all of them are joined by what is known as an “OR” gate. Parallel to each of these causes is added a QC measure with an “AND” gate. This indicates that for any of these causes (error in data, error in data input, etc.) to pass into the calculation process, there must be a concomitant failure of the QC that works on the input of each of these causes. Despite these controls, even if an error passes through the OR gate, the QC measure “Failure of QA” placed on the input end of “Error in calculation” box with an “AND” gate should help prevent the propagation of the “error in calculation” to cause an “error in calculated value for patient.”
107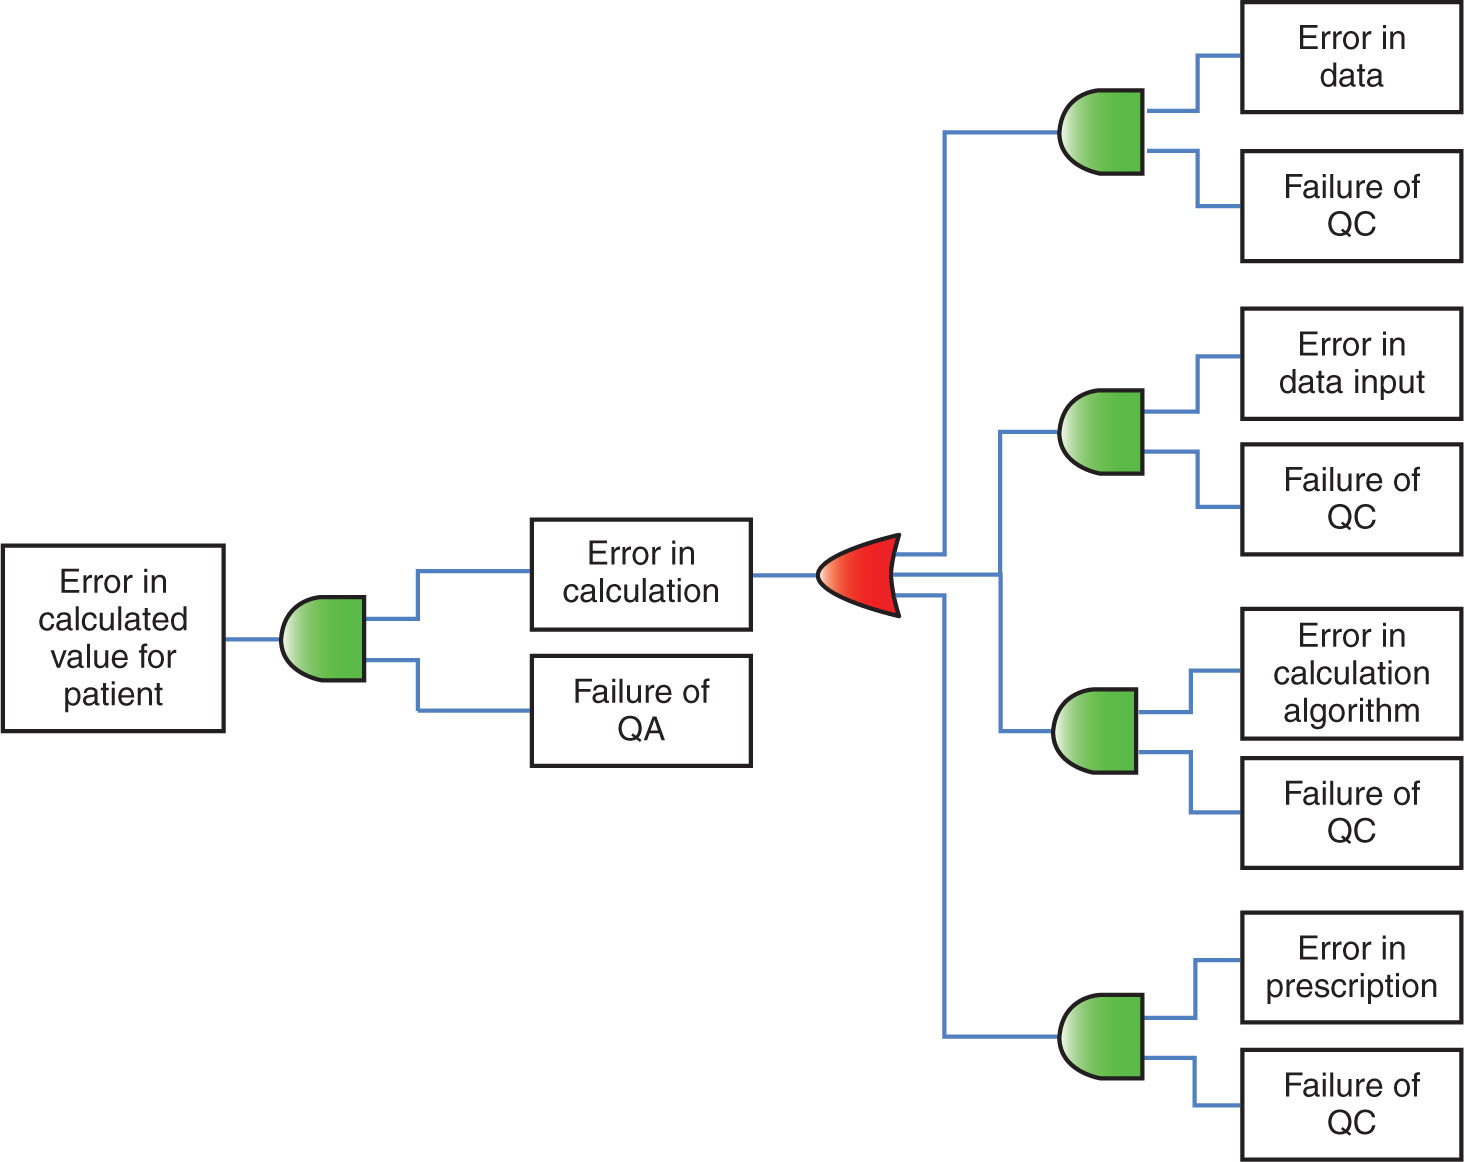
FIGURE 8.2 Example of a fault tree. The figure shows a process with four inputs all the way to the right of the figure, each with QC to maintain the integrity of the process and QA to provide confidence that the output of the process is correct. The red and green symbols represent “OR” and “AND” gates, respectively. Because an error in any of the four inputs can propagate into an error in the calculation, all of them enter into the process through an OR gate (red symbol). Parallel to each of the boxes indicating errors in the inputs are boxes indicating failure of QC associated with the process. Each of the “failure of QC” boxes enters an AND gate (green symbol) with its respective error in input box. This indicates that for the error in the input to pass into the calculation process, there must be a concomitant failure of the QC that works on that input.
QA, quality assurance; QC, quality control.
Source: From Huq MS, Fraass BA, Dunscombe PB, et al. The report of Task Group 100 of the AAPM: application of risk analysis methods to radiation therapy quality management. Med Phys. 2016;43(7):4209-4262. doi: 10.1118/1.4947547. http://onlinelibrary.wiley.com/doi/10.1118/1.4947547/full#f1
Program Design and Goals
Generating process maps and performing FMEA and FTA are only the beginning of the process of establishing a risk-based QM program. The next step is to use the information obtained from process mapping, FMEA, and FTA to design a risk-based QM program. TG-100 recommends that after establishing the goals of the program, one should prioritize the potential failure modes by considering both RPN and severity rankings and then starting with most highly ranked hazardous or severe steps, determined from either RPN or severity rankings, one should place various quality measurement interventions in place to address each failure mode. Various QM tools exist in the literature to address failures or deficiencies. The Institute for Safe Medical Practices (ISMP) recommended different tools on the basis of their effectiveness. This is reproduced in Table 8.2 (2, 10). As can be seen from the table, the most effective methods of mitigation are forcing functions and constraints and automation. This does not, however, minimize the importance of education and information such as training, which are at the bottom of the list in the table as being the least effective. In fact, it is essential to train all professionals frequently on all aspects of a treatment process.
After establishing a risk-based QM program, reevaluation of the effectiveness of the program should be done. This is because establishment of a prospective risk-based QM program sometimes creates unintended hazardous steps and it is important to identify these steps. In addition, during the reevaluation, one often identifies new failure modes that were not thought of during the first iteration. The frequency at which this reevaluation should be done is at the discretion of the user.
Incident Reporting
An incident is an unwanted or unexpected change from a normal system behavior, which causes, or has a potential to cause, an adverse effect to persons or equipment. Incident reporting aims to improve quality and safety of a program through a process that involves discovery of the occurrence of an incident followed by reporting of the incident, performing an investigation of the root causes of the incident, learning from such incidents, and placement of preventive actions so that the probability of occurrence of such incidents is minimized. It is important to report and learn from all incidents, regardless of whether they have a major impact on the patient or they are near misses and had no impact on the patient. It is also important to establish a multidisciplinary committee whose responsibility is to perform an expert analysis of all incidents. Implementation of preventive measures should be disseminated to all staff involved in the care of patients.
108TABLE 8.2 Ranking of QM Tools Based on the Effectiveness, With Examples, Following the Suggestions of ISMP and TG-100
1. Forcing functions and constraints • Interlocks • Hard stops 2. Automation and computerization • Bar codes • Automated monitoring • Computerized verification 3. Protocols, standards, and information • Alarms • Labels • Signs 4. Independent double checks, other redundancies, and checklists • Redundant checks and calculations • Independent review • Comparison with standards • Acceptance testing 5. Rule, policies, and procedures • Priority • Establishing lines of communication • Mandatory pauses • Establish QA and QC 6. Education and training |
Note: The most effective tools are the lowest numbered.
ISMP, Institute for Safe Medical Practices; QA, quality assurance; QC, quality control; QM, quality management; TG, Task Group.
Source: From Huq MS, Fraass BA, Dunscombe PB, et al. The report of Task Group 100 of the AAPM: application of risk analysis methods to radiation therapy quality management. Med Phys. 2016;43(7): 4209-4262. doi: 10.1118/1.4947547. http://onlinelibrary.wiley.com/doi/10.1118/1.4947547/full#f1
Program Audits
Program audits, both internal and external, provide valuable information that can be used to improve the quality of a program. An audit simply consists of having someone review the work who is not only associated with the work or facility but also who is knowledgeable and understands the work to be audited. Internal audits are valuable in that they provide a method to review processes or products followed in the clinic. This gives the auditor the opportunity to review data with a fresh perspective.
External audits provide additional valuable information about the QM program. These audits can be performed by experts in the field, such as Imaging and Radiation Oncology Core (IROC) Houston; by accrediting bodies, such as the American College of Radiology (ACR) or American Society of Radiation Oncologists (ASTRO); or by other knowledgeable individuals in the field capable of performing the audit. These audits should include product audits (for example, chart review or machine output) and process audits in which methodologies and policies and procedures are reviewed. They provide a completely independent review that would not otherwise be possible.
As with the results from the process mapping, FMEA, FTA, and incident learning, a multidisciplinary committee should take the results of internal and external audits and make recommendations for changes to the QM program.
Vendor Customer Technical Bulletin (CTB)
Vendors periodically send out CTBs to users. These bulletins provide users with information about recall notices and potential safety concerns with their products. These documents also contain information about recommended or required actions. The recommended action should be taken, but doing FMEA and a mini-FTA should also be considered (3). These steps can help identify the pathways that could lead to the failure described in the vendor CTB and explain how the described failure affects the clinical process. This information will allow the user to fully understand how the CTB impacts his or her clinic and clinical workflow specifically.
Application of TG-100 Methodology to SRS/SBRT
In this section, we present two simple examples of the application of TG-100 methodology to SRS/SBRT. This discussion is considered “simple” because it does not provide an exhaustive description of the application of TG-100 to SRS/SBRT. Chapter 3 gave a more detailed description 109of SRS and SBRT process following the TG-100 methodology.
Using Multiple Imaging Studies for Treatment Planning
Often, multiple imaging datasets are used for the treatment planning for SRS and SBRT procedures. Depending on the treatment site, these datasets might include PET-CT dataset or multiple MRI dataset and the planning CT dataset, which could include a four-dimensional (4D) CT dataset acquired at the time of simulation. Prior to planning, these datasets are fused to define the target volume and various organs at risk. The process of image fusion and delineation of target volumes and organs at risk might involve many potential failure modes, which include, for example, incorrect patient, incorrect type of imaging scan, incorrect scan parameters, incorrect scan orientation, incorrect organs-at-risk contouring, and incorrect treatment delivery. At the Department of Radiation Oncology at Henry Ford Health System, these failure modes were identified as high-risk steps because of the severity of the impact of these potential failure modes on the patient.
To minimize the likelihood of occurrence of some of these potential failure modes and to improve the detectability of the failure modes, should they occur, we have implemented several QC measures. For example, when datasets are imported into the TPS, there is a checklist item to verify the correct patient and orientation of the dataset. After the image fusion is completed, a physicist reviews the quality of image fusion prior to the contouring of targets and organs at risk. In addition, before contouring is performed, there is a checklist item that requires the physician to verify the correctness of the imaging datasets and image fusion.
Pretreatment Imaging and Localization
Because of the high dose per fraction and limited number of fractions involved in the SRS/SBRT treatments, it is important that imaging for target localization be performed prior to delivery of SBRT and SRS treatments. If the patient is set up incorrectly, then there is the potential to treat the incorrect site. Several failure modes can lead to setting up the patient incorrectly. They include, but are not limited to, inaccurate patient setup, malfunctioning immobilization device, mismatch between the radiation and imaging isocenters, and application of incorrect shift or nonapplication of a required shift. These failure modes can all lead to treating the incorrect disease site, which could have severe adverse effects on the patient. Again, at the Department of Radiation Oncology at Henry Ford Health System, these failure modes were identified as high-risk steps because of the severity of the impact of these failure modes on the patient and the difficulty of detecting these failure modes if they occur if appropriate QC measures are not put into place.
To minimize the likelihood of occurrence of some of these potential failure modes and to improve the detectability of the failure modes, should they occur, we have implemented several QC measures including the use of the Optical Surface Monitoring System (Varian Medical Systems, Milpitas, CA) for initial patient setup, acquiring a cone-beam CT (CBCT) and registering it with the planning CT for target localization, verification of the localization with a kV–kV image pair, and intratreatment kV–kV imaging to verify patient positioning.
Summary of Prospective Approaches to Quality Management
When the AAPM published the much-anticipated TG-100 report, it provided users with a methodology to improve quality and safety in the field of radiation oncology. It is not a prescriptive document; it provides guidance on how to establish prospective approaches to risk-based QM program in a radiation oncology clinic. The tools for prospective assessment that TG-100 recommended include process mapping, FMEA, and FTA. A multi-disciplinary team, consisting of all professionals (e.g., physicians, physicists, dosimetrists, therapists, nurses, IT support, and administrators) involved in the care of the patients, should be involved in the design of process mapping, FMEA, and FTA. TG-100 also provides a very short discussion on retrospective aspects to QM and discusses tools that include incident learning, root cause analysis (RCA), and program audit. CTBs provided by the vendors also provide a useful source of information that should be part of the design of any QM program.
COMMISSIONING OF LINEAR ACCELERATOR AND TREATMENT PLANNING SYSTEMS
High-quality SRS patient treatments begin with high-quality commissioning of the linear accelerator (linac) and TPS. Incorrect commissioning 110of the linac and TPS has the potential to generate systematic errors that propagate to the level of the patient being treated on the machine. Commissioning of the linac consists of radiation safety and mechanical and dosimetry aspects that ensure proper performance and mechanical accuracy of the machine. Commissioning of the treatment planning includes nondosimetric tests and dosimetric tests that ensure that the TPS accurately models the treatment beam produced by the linac.
Developing a QA program is necessary to ensure that the accuracy and precision of the machine used for SRS is maintained throughout the lifetime of the machine. Performance of the treatment platform can be affected suddenly by catastrophic failure of an integral part or auxiliary portion of the machine that prevents patient treatment, or slowly over time as wear-and-tear takes its toll on the mechanical aspects of the machine. Preventive maintenance should be performed as required by the manufacturer, preferably by the engineer, as well as annual, monthly, and daily tests to assure that machine performance has not deviated over time. The responsibility of the machine performance should lie primarily in the hands of the radiation oncology physicist, who in the radiation oncology team should best understand the workflow and be able to assess the machine tolerances needed to accurately deliver patient treatments. However, caring for a machine is a team effort. The team should consist of physicist; therapists, who have the most direct contact with the machine; and the engineers, who are best equipped to fix the machine.
AAPM TG-142 and -40 recommend tests consisting of the following: safety, mechanical, dosimetric, and imaging aspects of the machine (4, 5). These tests can be performed by any personnel on the team who are qualified and properly trained and must be reviewed by the radiation oncology physicist. Daily tests include tests that have the potential to seriously affect patient safety, positioning, and dose. These tests can often be performed by a therapist who is familiar with the procedures and equipment used to perform these tests. Monthly tests are generally performed by a physicist, an engineer, or a physics assistant who is familiar with the equipment and procedures. Annual tests are more thorough and use specialized equipment that has greater precision and accuracy than that used in monthly and daily tests. They include a subsection of items that were performed during commissioning to ensure consistency of the performance of the machine over the year. AAPM TG-142 outlines in detail the minimal tests required.
MLC and Hardware
For SRS treatments, linacs are often fitted with specialty hardware to accurately deliver high doses of radiation to small targets. The specialty hardware used for radiosurgery can be broken down into three major components: beam shaping, patient positioning, and localization devices.
For a linac to be used for radiosurgery, the basic commissioning steps must be performed. This testing includes radiation safety, mechanical, and dosimetric tests. However, the mechanical, dosimetric, and positioning tolerances are often tighter for SRS/SBRT, as recommended in AAPM TG-142 (4).
Multileaf Collimator
The most common beam-shaping device, available on most modern linacs, is the multileaf collimator (MLC). The MLC is used to shape the aperture of the beam to deliver conformal doses of radiation to the target volume while blocking areas of normal tissue. MLCs are typically manufactured using high-density materials (e.g., tungsten alloy) to produce desired attenuation. They can be used to create conformal, static apertures or used to modulate the beam such as in IMRT. In SRS, high-dose gradients are used to minimize dose to normal tissue, and the MLCs are an integral part in achieving rapid dose falloff.
MLC Positional Accuracy
The accuracy of the positioning of the MLC leaves is important in SRS, especially when treating very small lesions. In a study investigating the impact of accurate definition of small fields in step-and-shoot IMRT, it was found that the positional accuracy of the fields can affect the output of the beam. For a 1 × 1 cm2 field, output differences of up to 16% and 8% were found with differences in field size (relative to the planned field size) of 2 and 1 mm, respectively (6). The accuracy of the absolute MLC leaf positions is of particular importance when treating small targets. During commissioning, several tests can be performed to evaluate the positional accuracy of the MLC. As an example, a test can be performed in which 111a film is irradiated with two complementary leaf patterns (see Figure 8.3) with the goal of evaluating the matchline between the leaf tips, and the tongue-and-groove underdosage between the two leaves that straddle the isocenter.
Another method of verifying the absolute position of the MLC is performing a matchline uniformity test (see Figure 8.4A). This test uses a 2-cm-wide MLC opening, where the 2-cm gap is moved in 2-cm intervals in a stepwise fashion. The area under the leaf end will provide a dose variation of ±5% at the matchline. This method has been found to detect MLC leaf position variation at precision levels of 0.2 mm (7, 8).
Another method involves irradiating a small gap, at known, regular intervals (picket fence test). The corresponding irradiated film can be visually inspected to detect improper positioning, with a precision of 0.5 mm (7, 8) (see Figure 8.4B).
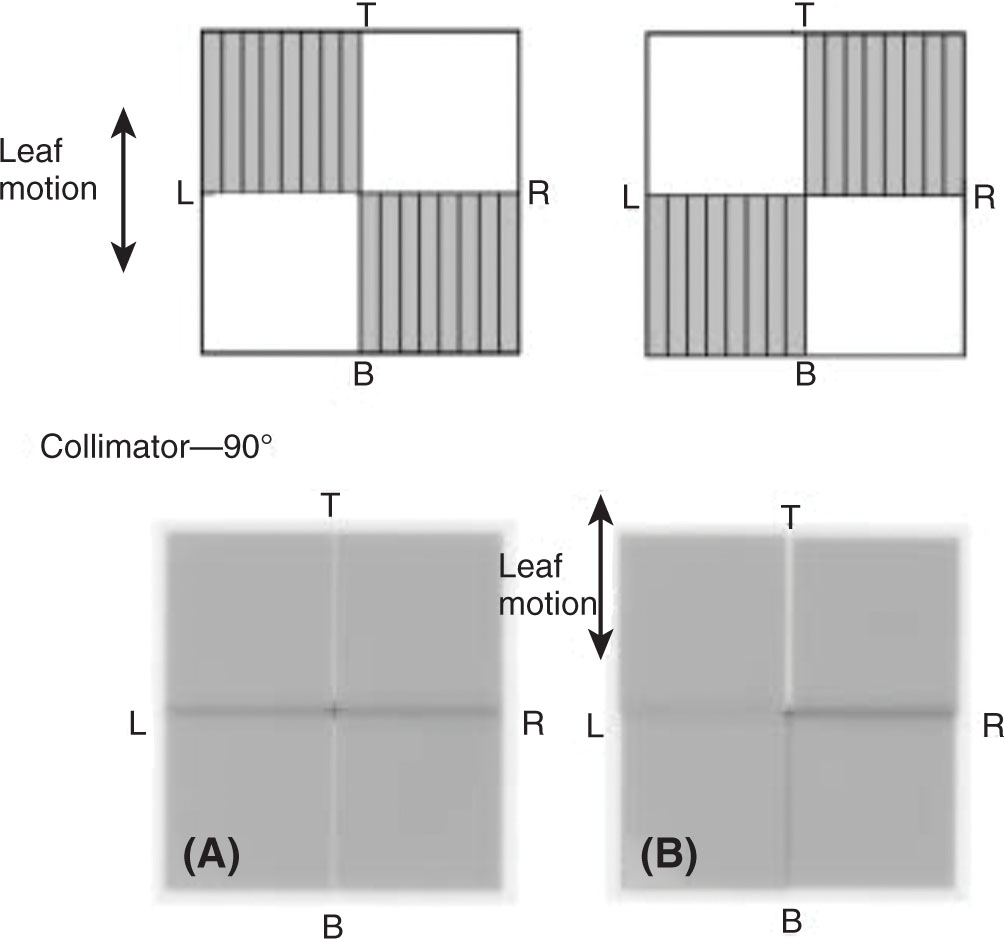
FIGURE 8.3 (Top) MLC pattern to verify misalignment of MLC bank relative to isocenter of machine. Top right and bottom left quadrants are irradiated with a fixed MU; the MLCs move to the second position where top left and bottom right quadrants are irradiated with the same number of MUs. (Bottom) Irradiated films using MLC pattern. (A) A well-aligned MLC system, with a uniform film, with the isocenter bisected by the vertical white line that is underdosage from the tongue-and-groove effect and a straight dark line that is the leakage through the tip of the leaves (B) demonstrates a MLC system that is misaligned in the direction of the leaf motion as well as left and right.
MLC, multileaf collimator; MU, monitor unit.
Source: From LoSasso T. IMRT delivery system QA. In: Palta J, Mackie TR, eds. Intensity Modulated Radiation Therapy: the State of the Art. Medial Physics Monograph, Vol. 29. Colorado Springs, CO: Medical Physics Publishing; 2003:561-591.
Light/Radiation Field Coincidence
An initial test is performed to ensure that the light and radiation fields are congruent. Depending on the manufacturer and design of the MLCs, an offset may exist between the two, as in the case when the MLCs have a rounded leaf end. Users have the option to calibrate the MLC using the light field or radiation field. These positional tests can be performed using film or an electronic portal imaging device and must include the four cardinal gantry angles because the MLC positions may be altered by gravitational effects.
Mechanical Stability of the MLCs
The mechanical stability of the MLCs can be evaluated using a spoke test. To accomplish this, a small gap created with the MLCs, and different axes of the machine (collimator, gantry, and couch), is rotated to different angles and the coincidence of the collimator, gantry, and couch axes with isocenter is evaluated.
Leaf Transmission
The transmission of radiation through the MLCs should be measured during commissioning to ensure that the transmission through the MLCs is within the manufacturer specifications, as well as to measure the MLC transmission characteristics. MLC transmission consists of two components: interleaf and intraleaf leakage. Interleaf leakage is the leakage between the gaps of the leaves, whereas intraleaf leakage relates to the amount of transmission through the leaf. The overall transmission through an MLC can be measured using film or a cylindrical ionization chamber. If film is used, an average value over the interleaf and intraleaf areas is measured. For ion chamber measurements, the ion chamber is oriented parallel to the travel of the leaf, and transmission is measured at multiple locations under the leaves to estimate the average interleaf and intraleaf leakage.
MLC Dynamic Delivery
In dynamic delivery using IMRT or volumetric-modulated arc therapy (VMAT), the MLCs are modeled in the TPS. Different manufacturers use different methods of modeling the dynamic delivery of MLCs. Varian MLCs use an input value called a dynamic leaf gap (DLG) that models the amount of dose transmitted through the rounded leaf ends. This is measured by delivering sweeping gaps of varying widths and interpolating to a gap size of 0 cm. Elekta machines also use a series of tests in an ExpressQA package with a predefined set of MLC shapes to be delivered. However, several studies have found that the value obtained from vendor-recommended methods can be modified to better match measured data using more clinically relevant cases such as TG-119 or clinically treated cases (9, 10).
112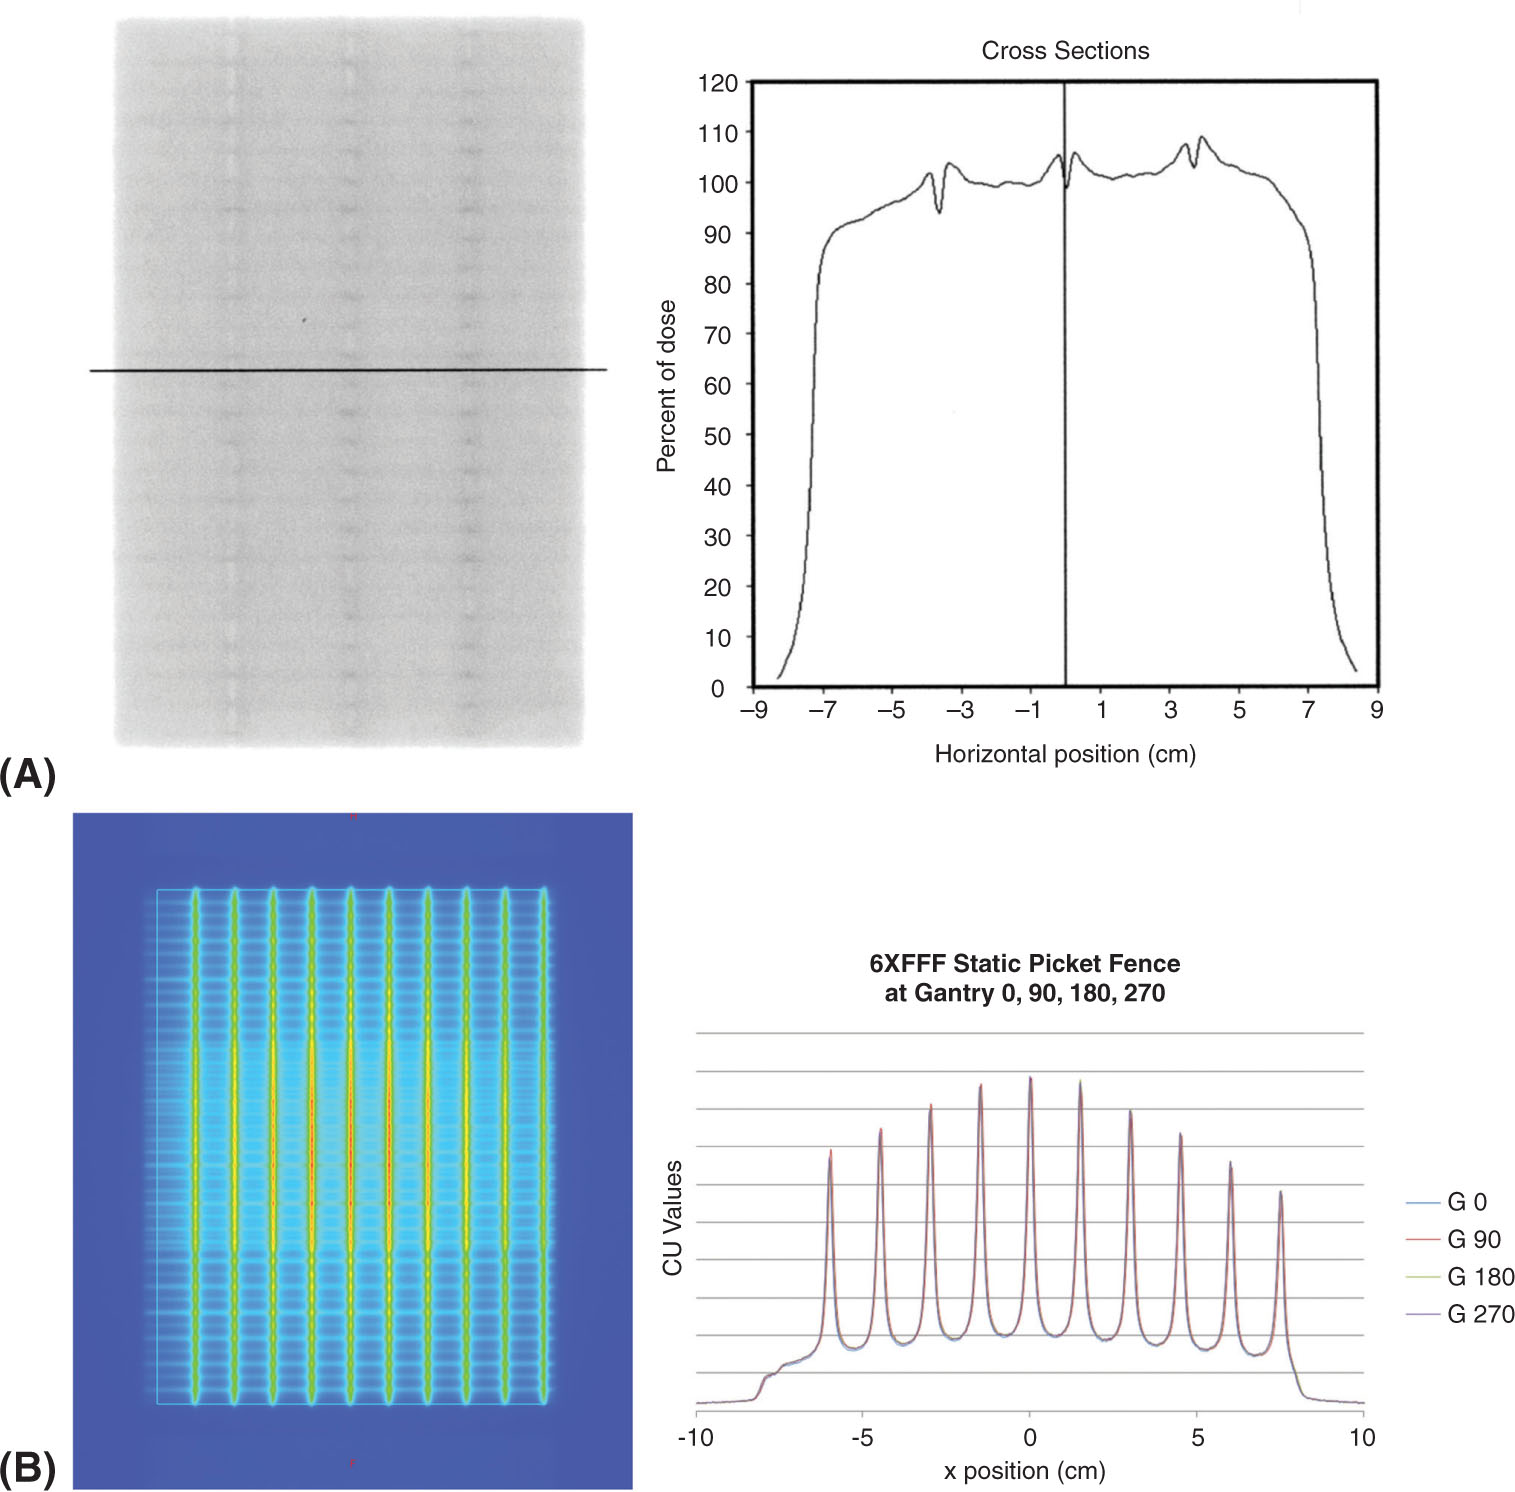
FIGURE 8.4 MLC positional tests. (A) Matchline uniformity tests performed on radiographic film (left) with line profile through the higher dose areas showing location of matchline (right); (B) static picket fence performed on an electronic portal imaging device (left) at four cardinal gantry angles with line profile through isocenter to evaluate the position of MLCs at each gantry angle (right).
MLC, multileaf collimator.
Mechanical and Radiation Isocentricity
The Winston–Lutz test is a classic test used in linac-based radiosurgery to measure the alignment between the mechanical and radiation isocenters (11). A small, high-density metallic ball (commonly called a BB), usually made of tungsten or steel, is aligned to the mechanical or imaging isocenter of the linac. Small fields defined using the jaws, MLCs, or conical cones are then delivered at a combination of collimator, couch, and gantry angles. The difference between the center of the BB and the center of the radiation field represents the difference between the mechanical and radiation isocenters (see Figure 8.5).
Cones
Cones are another beam-shaping device often used in radiosurgery. They are also encountered on other radiosurgery machines, such as in Gamma Knife and CyberKnife. Cones are composed of high-density materials, such as tungsten. The size of cones can vary from 2 to 60 mm in diameter at the isocenter plane.
Cone Alignment
The centering of the cones is often performed after the machine isocenter has been set and collimator rotation isocentricity has been finalized. An analog pressure gauge measuring to the thousandth of an inch is placed inside the cone. The cone is then rotated around the collimator axis and the cone is moved to minimize any deviation in the pressure gauge reading.
113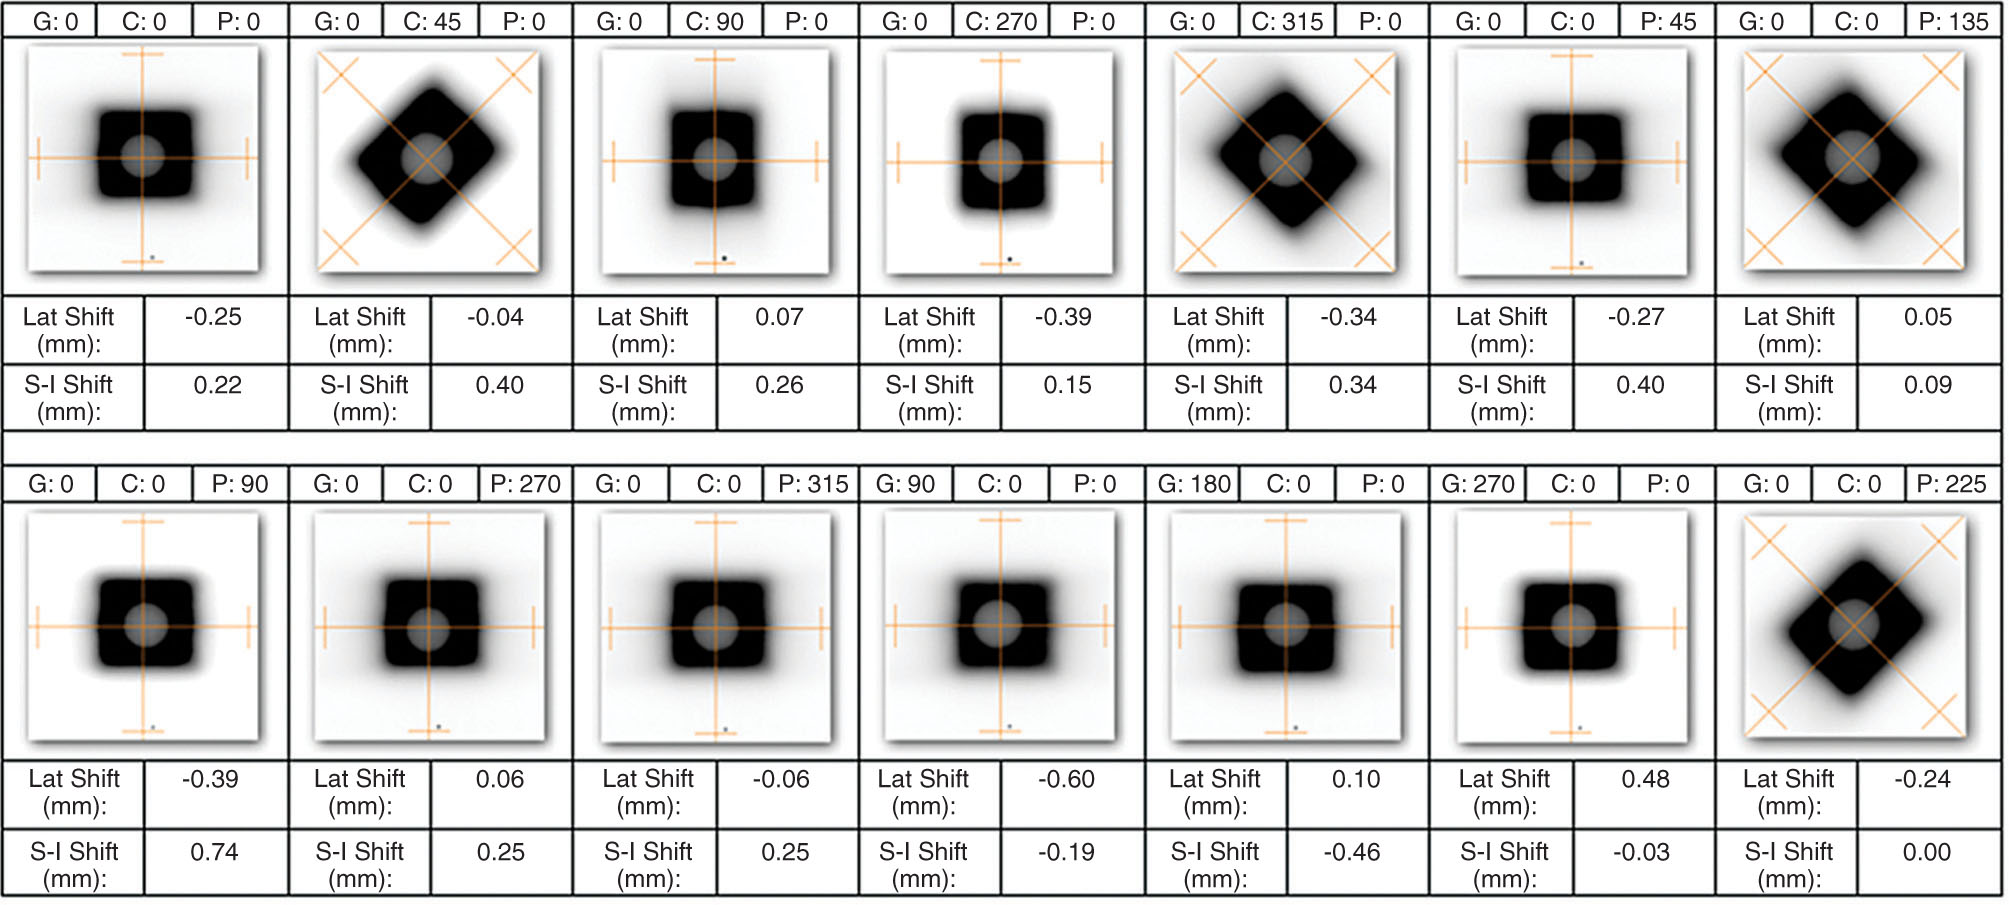
FIGURE 8.5 Example of jaw-based Winston–Lutz test performed at 14 gantry (G), collimator (C), and pedestal (P) angles. The shifts in the lateral (Lat Shift) and superior to inferior (S-I Shift) directions are calculated from the center of the jaw-defined field and the center of the BB. A positive discrepancy in the cross-plane direction indicates a shift to the right; a positive discrepancy in the in-plane direction indicates an inferior shift.
To verify the centering of the cones, a Winston–Lutz test can also be used to quantify the deviation of the mechanical and radiation isocenters. The Winston–Lutz BB must be fixed to a device independent of the gantry and collimator such as the couch. Assuming the BB does not move, the position of the cone relative to the BB can be assessed and the cone aligned to minimize any deviation.
Couch and Positioning Devices
Most modern linacs use 6 degrees of freedom (6DoF) couches to position the patient at the correct treatment position using image guidance. QA of the positioning device should be performed to ensure that the couch is driven to the correct treatment position (12). One method is to offset fiducial markers at known positions within a phantom using an arbitrary translation, pitch, roll, and yaw. After image guidance, the couch must drive the phantom to the correct location (on the basis of a given tolerance) that can then be verified using redundant imaging.
Transmission and modeling of the couch and positioning devices should be verified in the TPS during commissioning. With larger doses of radiation used in SRS, skin dose may exceed clinical tolerance limits if the buildup from immobilization devices is not considered during dose calculation (13).
Small-Field Dosimetry
The use of small fields is ubiquitous in the field of radiation oncology. Examples of treatments using small fields include highly modulated IMRT fields (small field segments), as well as the application of SRS or SBRT. With the increasing use of hypofractionated radiation therapy in clinical treatments, the use of SRS and SBRT to treat small lesions is becoming more commonplace. Two important reviews on the physical and technical issues associated with small fields are provided by the Institute of Physics and Engineering in Medicine (IPEM) Report No. 103—Small Field MV Photon Dosimetry (14), and by Das et al. (15). The IPEM report defines small photon beams to exist when penumbra regions (50%–95% equilibrium distance rather than 20%–80% distance in a small field) occupy most of the field area (14). Das et al. (15) note that a small field can typically be defined as one in which the field size is less than 3 × 3 cm, but that “equilibrium factors” dependent on energy and medium must be used to quantify the term “small.” Small fields are often associated with nonequilibrium conditions, that is, loss of charged particle equilibrium (CPE), which are impacted by the following (14, 15): (a) the size of the source, projected from the detector through the beam aperture; (b) the size of the detector used in measurements; and (c) the electron range in the irradiated medium, which depends on the beam energy. Kumar et al. (16) performed careful Monte Carlo (MC) simulations of the full linac treatment geometry to demonstrate the significant effect of source occlusion on output factor reduction at field sizes less than 1 × 1 cm. They demonstrated, by scoring kerma rather than dose (to remove the 114confounding effect of electron transport), that the output factor was reduced significantly when the MC simulation considered the full target geometry (realistic finite source) rather than a point source (16). This implies that the occlusion of the finite-sized target reduces the total bremsstrahlung output produced, and hence the output factor. If one considers the total output as an integral along the width of the finite source, then if the source is eclipsed, one would expect a reduction in the output factor. Conditions of loss of CPE can also be created when the field size is reduced such that the lateral ranges of the secondary electrons become comparable to (or greater than) the field size (15). This situation is exacerbated in tissues of density much lower than that of water (e.g., lung or air-equivalent tissues) where the ranges of the lateral electrons are increased, as encountered in treatment planning of lung cancer patients treated with SBRT (17).
Accurate measurements under conditions of nonequilibrium, including small fields, tissue interfaces, buildup dose regions, and so forth, are fraught with challenges (14, 15, 18). Under nonequilibrium conditions, detectors introduce perturbations, which are difficult to quantify. Investigators have shown that under nonequilibrium conditions, there is breakdown of the Bragg–Gray cavity theory (16), and that the density and atomic composition of the detector play an important role (19, 20). Scott et al. (20) showed that changes in the ratio of MC-calculated doses delivered to water and detector voxels with field size arise primarily from differences between the densities of the detector materials and water, and recommend that ideal small-field relative dosimeters should have small active volumes and water-like density. Bouchard et al. (21) performed a theoretical investigation invoking Fano’s theorem to demonstrate that beam quality correction factors of small-megavoltage photon fields are mainly caused by differences in electron density between water and the detector medium, and by volume averaging over the detector cavity. They also point out that the impact of other effects, such as the presence of extracameral components and differences in atomic properties of the detection medium with respect to water, may be enhanced in small photon fields relative to standard beams (21). Excellent reviews of the perturbation conditions and other issues associated with reliable measurements under nonstandard conditions are presented in the IPEM report on small-field dosimetry (14) and the article by Das et al. (15).
Recently, the International Atomic Energy Agency (IAEA) and the AAPM have jointly published a Code of Practice (CoP) for dosimetry of small static fields used in external beam radiation therapy. This CoP, TRS483, has provided data and recommendations for performing reference dosimetry in machine-specific reference (msr) fields and relative dosimetry (measurements of field output factor) in small static photon fields. The reader is advised to consult the IAEA website to get access to this CoP (https://www-pub.iaea.org/books/iaeabooks/11075/Dosimetry-of-Small-Static-Fields-Used-in-External-Beam-Radiotherapy).
Beam Modeling in the Treatment Planning System
Most current commercially available TPSs are equipped with convolution/superposition, or MC-based algorithms for dose calculation. Beam modeling for such algorithms involves characterization of the linac treatment head geometry, and such models are typically measurement-driven. A measurement-driven model is one in which the user acquires a base set of measurements to be used as input, to optimize the model parameters. In a measurement-driven beam model, uncertainties associated with measurements will propagate systematically in the dose calculation process. It is therefore critical that the small-field measurements required for SRS and SBRT beam modeling be performed with utmost care and attention to detail. There have been many studies reported on complexities and differences in detector responses associated with accurate small-field measurements (22–25). Consequently, it is incumbent on the medical physicist to follow published standards and practice guidelines on the most appropriate and accurate detectors for small-field depth/profile and output factor measurements (26–28).
SRS-based treatments are typically performed using five or fewer fractions at hypofractionated doses, implying that the margin of error associated with SRS/SBRT treatments is much smaller than for conventionally fractionated treatments. Therefore, dose calculations need to be as accurate as possible. This implies that more stringent criteria are warranted for accuracy in SRS/SBRT beam modeling (4) than the typical 2%/2-mm criterion for agreement between beam model calculations and measurements for conventional beam models (29, 30). At centers offering single-fraction SRS treatments, the criterion for agreement between dose calculations and measurements is most commonly 1%/1 mm. The beam model must be verified carefully with attention to all aspects of the radiation dose profiles as a function of depth in 115the phantom. As recommended in the AAPM TG Report No. 53 (29), the depth dose profiles can be divided into different regions, corresponding to dose buildup, dose at depth, high dose, penumbra, and profile tails. Criteria for agreement between calculations and measurements are suggested in AAPM TG-53 (29), which can be used as a guide to validate the accuracy of the beam model. Beam model calculations should be verified against measurements for a variety of field sizes, and should focus on the most clinically relevant geometries. Comparisons between calculations and measurements for large field sizes (>30 × 30 cm) can be used to assess the accuracy of the beam energy spectrum used in the beam model. For SRS/SBRT-based beam models, it may also be necessary to verify calculations at very small field sizes, possibly down to 0.5 × 0.5 cm, depending on the type of clinical application. Point dose calculations should also be performed for a range of different field sizes and should be verified against measurements along the central axis (CAX) as well as at off-axis points, at multiple depths (29). Accurate modeling of beam-modifying devices, such as the MLC, is of central importance, particularly at small field sizes. The IMRT guidance report published by AAPM IMRT subcommittee provides a comprehensive review of the types of measurements needed to verify that the MLC physical characteristics and control issues are accurately handled by the beam model for both static and dynamic deliveries (31). Issues such as leaf calibration, inter- and intraleaf transmission, tongue-and-groove effect, and leaf scatter are all accentuated at small field sizes. It is imperative that the medical physicist performs comprehensive validation of beam model calculations against measurements to verify that the model accurately characterizes the physical characteristics and motion of the MLC. Similarly, beam model calculations for other beam-modifying devices, such as a cone-based collimation system or use of a dynamic wedge, will need to be validated against measurements. In addition to calculations in a homogeneous, water-tank-like geometry, calculations including inhomogeneities, mimicking heterogeneous body tissues, are necessary (29, 30). Such tests can be used to validate the accuracy of the radiation dose deposition, especially when small fields are used in the presence of low-density tissues (e.g., lung), where nonequilibrium conditions exist (18). The book chapter by Seuntjens (18) includes a useful listing of specific test examples, phantom designs, and detector measurements, intended to serve as a supplement to those reported in AAPM TG-53 (29). These tests should be considered for validation of the beam model under a variety of different circumstances, including tissue heterogeneity. As recommended by the AAPM (29, 31) and ASTRO (28), it is important that redundant systems be incorporated to validate dose calculations for treatment planning. A redundant, second-check system, developed independently of the clinical beam model, is a necessary quality/safety measure. It is also recommended that the beam model, prior to clinical use, be checked by an independent physicist or other qualified individuals external to the institution.
Beam models in most commercially available planning systems include a variety of input parameters, often provided by the manufacturer as “default” settings. It is crucial that the medical physicist verify these default parameters independently, as in some instances, these parameters can indeed have a significant influence on the accuracy of small-field depth and profile calculations. An example of this is provided in Figure 8.6, which shows the effect of varying the source size parameter for an SRS/SBRT beam model within the Eclipse v.11 TPS (Varian Medical Systems, Palo Alto, California). The calculations are shown in the cross-plane direction and were performed for a 0.5 × 0.5-cm field size, at 10-cm depth, using a 1-mm calculation grid. MC calculations were performed using the BEAMnrc/DOSXYZnrc code system (32) (National Research Council of Canada [NRCC]) using a phase space file supplied by the manufacturer for a TrueBeam-type linac (Varian Medical Systems). Collimators were modeled and were set to an aperture of 0.5 × 0.5 cm. Figure 8.6 (left) shows the results for the anisotropic analytic algorithm (AAA), whereas Figure 8.6 (right) corresponds to calculations for the Acuros XB algorithm. It is clear from these figures that the source size setting with the Eclipse beam model has a significant influence on the shape of the profile as well as the CAX dose. For instance, if the default setting for AAA was 0 mm, the relative CAX dose is ~37% versus ~18% for a 3-mm source setting, corresponding to approximately a 20% relative difference. In this example, the MC-computed profile corresponds to a source width of ~1.5 mm. Similarly for the Acuros algorithm, the source size setting has a significant effect on the 0.5 × 0.5-cm profiles. It is also interesting to note that the profile shapes differ between the AAA and Acuros algorithm.
This example serves to illustrate the fact that beam model parameter settings must be validated independently by the medical physicist, especially under small-field circumstances.
116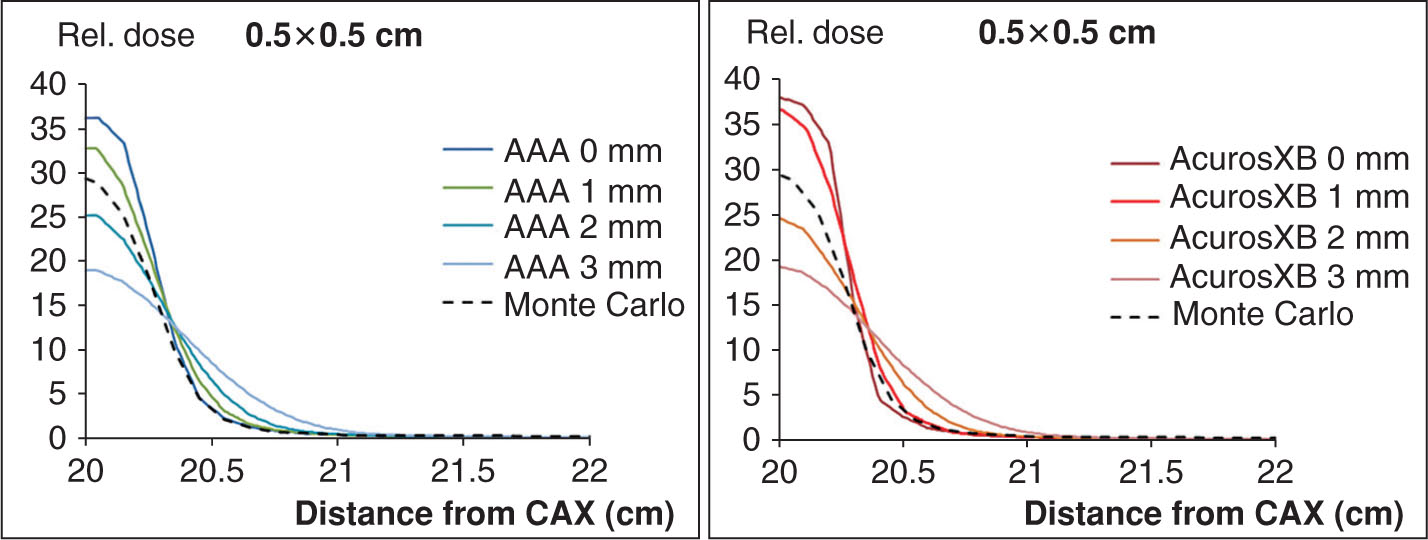
FIGURE 8.6 Effect of varying the source size parameter for an SRS/SBRT beam model within the Eclipse v.11 treatment planning system (Varian Medical Systems, Palo Alto, California). Calculations performed at 0.5 × 0.5 cm field size, at 10 cm depth, using a 1-mm calculation grid, for (left) anisotropic analytic algorithm (AAA) and (right) Acuros XB algorithm. MC calculations were performed using the BEAMnrc/DOSXYZnrc code system 20 (NRCC) using a phase space file supplied by the manufacturer for a TrueBeam-type linear accelerator (Varian Medical Systems).
MC, Monte Carlo; NRCC, National Research Council of Canada; SBRT, stereotactic body radiation therapy; SRS, stereotactic radiosurgery.
Source: From Henry Ford Health System.
Setting up a Treatment Planning System QA Program
Treatment planning is one of the most important components of the entire radiation therapy treatment process. When smaller targets and high-dose gradients are required to achieve organ at risk (OAR) dose constraints, as in the case of SRS treatment planning, shortcomings in the TPS are accentuated.
Acceptance and Commissioning
Treatment planning acceptance and commissioning can be broken down into two parts: nondosimetric and dosimetric.
Nondosimetric Tests
Nondosimetric tests in TPS include items that are not dose related but can lead to systematic errors if not properly verified. This includes items such as transfer of CT data that may include patient position (head first supine or feet first prone), contouring accuracy of 3D structures with known volumes, correct beam descriptions, orientations, and naming conventions. TPS vendors are required to verify these items with the customer during acceptance. The AAPM TG No. 53 provides guidelines for commissioning and QA of radiation therapy TPSs (29).
Dosimetric Tests
Dosimetric validation is required to verify that the beam model is accurate for all possible conditions under which the TPS will be used. Validation should be performed starting from simple basic geometries to more complicated modulated fields such as IMRT and VMAT plans. A variety of tests can be used; however, the experimental requirements and corresponding tolerances have been provided by the AAPM medical physics practice guideline 5.a (33).
Basic photon beam geometries should include simple square fields, small MLC-shaped fields, large MLC-shaped fields, off-axis MLC-shaped fields, asymmetrical fields, and fields at oblique incidences. Measurements should be performed in the high-dose region, penumbra, and out-of-field regions and at various depths, such as dmax, midrange (10–15 cm), and at depth (20–30 cm). Verification of the algorithm under conditions of tissue heterogeneity is also a central requirement. Testing must include validation of the CT-to-density tables, as errors in these tables can result in systematic errors through the treatment planning process. Examples of experimental validation using slab-type geometries are provided in the literature (34, 35).
IMRT and VMAT validation should include measurements using small MLC-shaped fields and appropriate detectors. The AAPM TG-119 report provides a set of test plans including complex, concave-shaped targets for validating patient-like dose distributions (36). In the AAPM TG-119 test suite, measurements are performed in the high-dose and low-dose regions using both an ion chamber and a two-dimensional (2D) detector system for planar measurements. Finally, E2E testing incorporating uncertainties at all stages of the radiation therapy chain, including simulation, treatment planning, and delivery, should be performed. Such tests can be performed using an anthropomorphic phantom, available commercially or through independent auditing services, as provided by the IROC Houston.
117Periodic QA
Periodic QA of the TPS should be performed to verify that no system defaults have changed, as recommended by the AAPM TG-53 and other relevant AAPM guidelines. Testing should also be performed whenever an upgrade of a TPS occurs, to ensure, among other factors, that beam data and machine configuration settings have not been modified accidentally.
Equipment for QA
The equipment needed for basic and stereotactic QA can be broken down into the following components: dosimeters, mechanical QA tools, dosimetric phantoms, and mechanical phantoms.
Detectors
When commissioning a linac, it is important to properly understand the limitations of each detector. Figure 8.7 shows scanned depth profiles for a small 1 × 1 cm2 and a large 40 × 40 cm2 field size with different detectors. Note the position of the Scanditronix-SFD dose data relative to the Exradin-A16 for the small and large field sizes. Each detector responds differently because of the manner in which each detector perturbs the radiation field. Detector perturbations and associated correction factors must be carefully understood especially under small-field conditions.
Ionization Chamber
An ionization chamber is used to measure absolute dose and calibrate the output of the machine. Ionization chambers used for reference dosimetry should be calibrated against a national standard at an Accredited Dosimetry Calibration Laboratory (ADCL). The ionization chambers used for calibration are often Farmer-type cylindrical chambers, with average active collection volume of 0.6 cm3. The AAPM TG-51 protocol provides kQ factors for many of the commercially available Farmer chambers (37, 38) for performing reference dosimetry in a 10 × 10 cm2 reference field size. The IAEA TRS483 CoP provides data for beam quality correction factors for various ionization chambers for performing reference dosimetry in msr fields. It also provided data for output correction factors for various detectors for measurements of field output factors. Again, the reader is advised to consult the IAEA website to get access to TRS483 CoP.
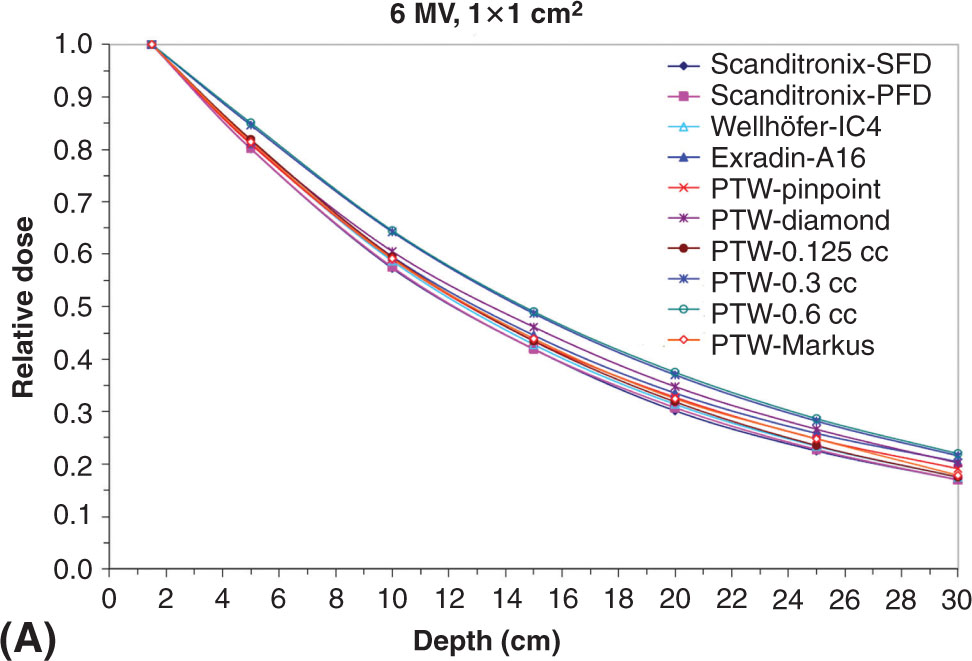
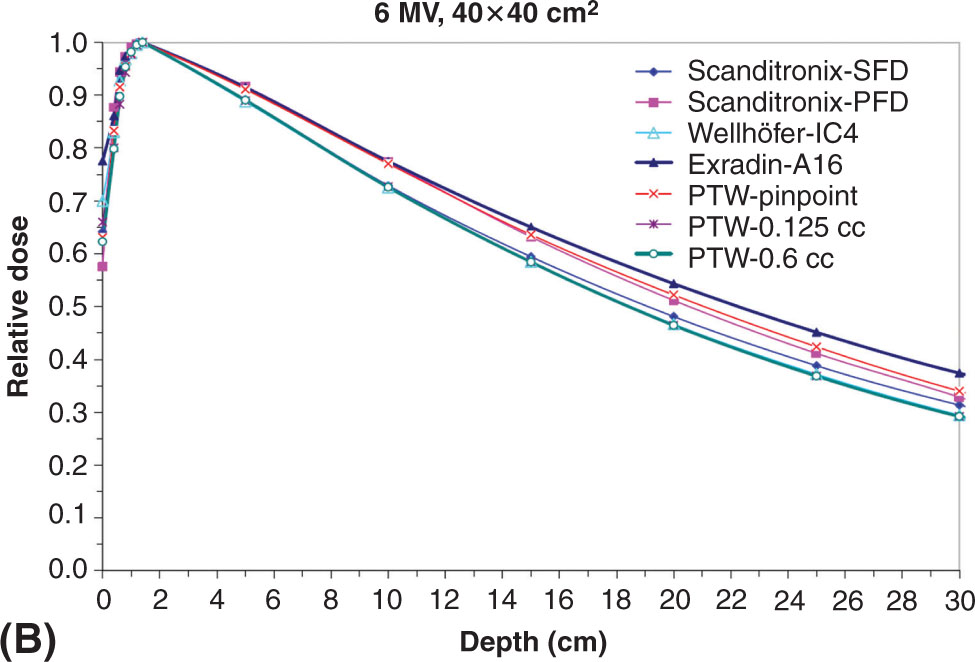
FIGURE 8.7 Percent depth dose for a 6-MV beam for a (A) 1 × 1 cm2 and (B) 40 × 40 cm2 field size using a variety of commercial detectors available on the market.
Source: From Das IJ, Cheng CW, Watts RJ, et al. Accelerator beam data commissioning equipment and procedures: report of the TG-106 of the Therapy Physics Committee of the AAPM. Med Phys. 2008;35:4186-4215. doi: 10.1118/1.2969070
Small chambers are optimal for stereotactic, small-field measurements, as volume-averaging effects are mitigated. However, these chambers have small collection volumes, which limits signal. In order to amplify the signal a higher Z material may be used for the collection electrode; however, this causes an overresponse at large fields and in the field tail region because of the increased contribution of lower energy, scattered photons. Ion chambers also require auxiliary equipment such as cables, connectors, adaptors, and electrometers. The fidelity of the cables, connectors, and adaptors should be checked before use for any leakage or source of noise that may interfere with measurements.
Diodes
Semiconductor diodes have relatively quick read-out responses and spatial resolution, do not require external bias, and are approximately tissue 118equivalent. Most diodes are constructed with high-Z material, which may result in overresponse, especially to lower energy photons. MC simulations have shown that shielded diodes preferentially absorb low-energy photons; however, they also increase the primary electron fluence. Corrected unshielded diodes were shown to have responses comparable to or better than traditional shielded diodes (39). For small field sizes, a daisy chain method, in which the response of the diode is normalized to that of an ion chamber, at a reference field size, is recommended for output factors at smaller field sizes. A typical field reference field size is 3 × 3 cm2 (22).
Film
The resolution of film is very high because of the inherent structure of the film, made up of either grains or polymers. Two common types are radiographic and radiochromic film. Radiographic film is composed of high-Z materials, silver halide or silver bromide grains, which result in overresponse to lower energy photons. Most comercial film products such as extended dose range (EDR) film (Kodak) saturate at ~5 Gy, limiting application to SRS deliveries. Radiographic film is quite sensitive and requires careful handling to obtain good dosimetric results. The AAPM TG-69 report is an excellent resource for radiographic film dosimetry (40). Radiographic film is useful for measurements that involve mechanical QA and to measure leakage from the linac treatment head during commissioning. However, use of radiographic film is becoming less common, as carefully controlled developer process, including necessary chemicals, which require maintenance, is needed to elicit reproducible results.
Radiochromic film is now more commonly used as it is more convenient, does not require a film room and developing chemicals, and, moreover, is near tissue equivalent and thereby has minor energy dependence. The use of radiochromic film for dosimetry has been widely published (41–43).
With radiochromic film, for example, Gafchromic EBT3 (Ashland Inc. Covington, KY), one needs to be cautious of nonuniformities of the film scanning system, as well as differences in response as a function of lag times between radiation dose delivery to the film delivery and film scanning. Studies have shown that for Gafchromic EBT3 films scanned using a flatbed scanner, dosimetric accuracy of 2% can be achieved for doses above 5 Gy (43), with the use of a careful calibration protocol that incorporates nonuniformities in the scanning process. For use in radiosurgery, where doses may range from 10 to 25 Gy, the uncertainties become greater because of the saturation of the red channel, typically used for analysis. A study using Gafchromic EBT3 films for SRS and SBRT found 1.5% dose uncertainty in the 18- to 20-Gy range (44). A newer film, Gafchromic EBT-XD (Ashland Inc.), has been designed for use in higher doses. Preliminary studies have shown good agreement and stability at these high doses (45).
Diamond and Plastic Scintillation Detectors
Other specialty detectors used in SRS include diamond detectors and plastic scintillation detectors (PSDs). Diamond detectors are solid-state semiconductor detectors. They are very similar to diode devices, as they are tissue equivalent and have high response and high spatial resolution. They have shown good performance when used for scanning and relative dosimetry (46). However, because they are difficult to manufacture, they are more expensive than other detector types.
PSDs also are well suited for use in the radiosurgery setting. They have high spatial resolution; are water equivalent, energy independent, and nearly temperature independent; and have good dose reproducibility and linearity. With PSDs, photons impinging on the scintillating material excite atoms that when decayed produce photons in the visible spectrum (47). The photons are then guided to a photodetector and are converted into an electric signal that is read out by an electrometer. One issue with PSDs is the presence of blue Cerenkov radiation, which is emitted for electron energies greater than 146 keV impinging on plastic and is interspersed with the scintillation signal. Cerenkov light can be subtracted or filtered from the signal.
Phantoms
Scanning Tank
A scanning tank is used in conjunction with detectors and electrometers to obtain beam data. Modern scanning tanks are very accurate; however, before use, simple QA should be performed to ensure the mechanical integrity of the scanner, as well as to prevent any errors while acquiring beam data. AAPM TG-106 (48) provides guidance to test 119the mechanical axes and travel of the chamber prior to scanning. Other example tests for initial commissioning and acceptance of a scanning tank are provided elsewhere (49).
Anthropomorphic Phantoms
During commissioning of a TPS, anthropomorphic phantoms can be used to verify dose measurements in heterogeneous materials such as in the thorax, in areas of low-density lung tissue, and in high-density, rib-like structures. They can be used for E2E tests to evaluate the overall accuracy of the treatment planning workflow. They can also be useful when implementing new treatment techniques that require measurements prior to implementation in the clinic.
Miscellaneous Phantoms
For periodic QA, such as monthly and daily QA, other phantoms can be used to expedite and collate tests. This includes solid water phantoms that can be used for easy output measurements. Other phantoms with embedded BBs and scribes located at the center of the BB, such as a Winston–Lutz jig, can be used for localization and imaging. A variety of commercially available phantoms can be used to improve workflow.
Patient-Specific QA
Patient-specific QA is necessary to ensure that the plan created in the TPS is deliverable, and that the delivered and planned dose distributions are in agreement.
2D/3D Measurements
For small targets and high dose gradients in radiosurgery, spatial resolution is extremely important. As such, film is an ideal detector for such measurements. However, film is very labor intensive, requiring lag time to allow for film self-developing and scanning, and needing a careful calibration protocol, in which scanner nonuniformities are properly accounted for (44). The 2D detector arrays, consisting of ion chambers or diodes, can be also be used; however, one needs to be cautious of the spatial resolution of such systems especially for very small targets. The 3D measurement devices such as gel dosimetry can be used to capture the dose distributions in all three dimensions; however, gel dosimeters are currently not commonly used in the clinic.
A common method of quantitatively assessing differences between the measured and the planned dose is the gamma analysis (50). A pass rate percentage such as 90% or higher is recommended for a given criterion, such as 3% dose difference and 3-mm distance to agreement. In SRS in which high dose gradients are commonplace, gamma analysis may not be sensitive enough to detect all errors.
Dynalog Files and Dose–Volume Histograms (DVH) Recalculation
Other methods to assess differences between planned and delivered dose distributions include evaluation of the Dynalog (dynamic treatment log) file, which provides the actual delivered MLC positions (51), as well as exit dosimetry, in which the exit dose measured using a detector system is back projected to estimate the actual dose delivered to the patient (52).
QUALITY MANAGEMENT OF IMAGING SYSTEMS
The goal of the QM program of imaging systems is to evaluate the imaging system performance in relation to manufacturer specifications and guideline documents. The AAPM Task Report No. 66 addresses in detail a QA program for the CT simulator (53). The AAPM TG-142 report provides recommendations on QA for imaging devices that are part of the linac including x-ray imaging, portal imaging, and CBCT (4). The ACR committee’s manual on MRI QC helps establish and maintain a QC program for magnetic resonance (MR). The following sections discuss the image quality characterization for CT, CBCT, and MRI and the E2E tests to assess the systematic accuracy of image-guided treatment platform.
Image Quality and Imaging Dose Assessment for CT and CBCT
Image quality tests should include analysis of the following parameters: low contrast resolution, spatial resolution, uniformity index (UI), contrast-to-noise ratio (CNR), signal-to-noise ratio, and accuracy of the image slice width. The Catphan phantom (Phantom Laboratory, Salem, New York) is one of the most commonly used phantoms for assessing CBCT image quality. This cylindrical phantom has multiple modules including one with 120eight inhomogeneity inserts, one containing a uniform water equivalent disk, one with 21 line pairs/cm, one with a tungsten-carbide beam, and one with inserts of varying contrast.
Uniformity Index
Intensity profiles can be used to visually check the uniformity. The UI is defined as follows:
UI = HUmax – HUmin
The uniformity depends on the imaging protocol and patient size and it generally degrades as the patient size increases especially for the low kVp protocols. Gardner et al. compared the UI of three imaging systems: GE LightSpeed 16 slice, Varian On-Board Imager (OBI), and Elekta x-ray volume imaging (XVI), using multiple imaging protocols and two different phantom sizes (54). Figure 8.8 shows the UI for each system and horizontal intensity profiles. The fan-beam CT system has greater uniformity than the CBCT system because the CBCT images are more prone to ring artifacts and cupping effects (55). The average CT number for water in the sampled region should be 0 ± 4 HU. The uniformity of CBCT/OBI head protocol shows higher dependence on phantom size, whereas the uniformities of the pelvis, thorax, and spotlight protocols are similar between two different phantom sizes. On the XVI system, the uniformity decreases as the phantom size increases. The OBI system is more susceptible to ring artifacts, whereas the XVI system exhibits cupping artifacts as shown in the horizontal intensity profiles (54).
Spatial Resolution
The modulation transfer function (MTF) can be used to characterize the spatial resolution of an imaging system in the frequency domain. A bar pattern target with a variety of low and high spatial frequencies (lines/mm) is typically used to determine the MTF. The MTF is generated by calculating modulation of the bar patterns at these various frequencies. Intensity profiles along the bar patterns are acquired and fit with a Gaussian function. The MTF is determined by the Fourier transform of this Gaussian curve (56). An alternative way to calculate MTF is to analyze the system response to a small tungsten bead to mimic a point source input (57). The bead has a finite size, so a correction at each spatial frequency should be made to obtain the final MTF curve (58). Gardner et al. compared the image quality characteristics of the OBI and XVI systems with a GE LightSpeed scanner for both small (26 cm) and large (46 cm) field-of-view (FOV) settings (54). The OBI system has comparable spatial resolution as the GE scanner considering that both have similar detector size (~194 μm) and image pixel size (~0.5 mm for head protocol and 0.9 mm for body protocol). The XVI system offers less spatial resolution because of relative larger detector size (~400 μm) and pixel size (~1.0 mm). The CBCT systems also exhibit slightly lower spatial resolution as the phantom thickness increases. Table 8.3 shows the number of visible line pair objects for each system. The MTF curves for all imaging systems are shown in Figure 8.9.
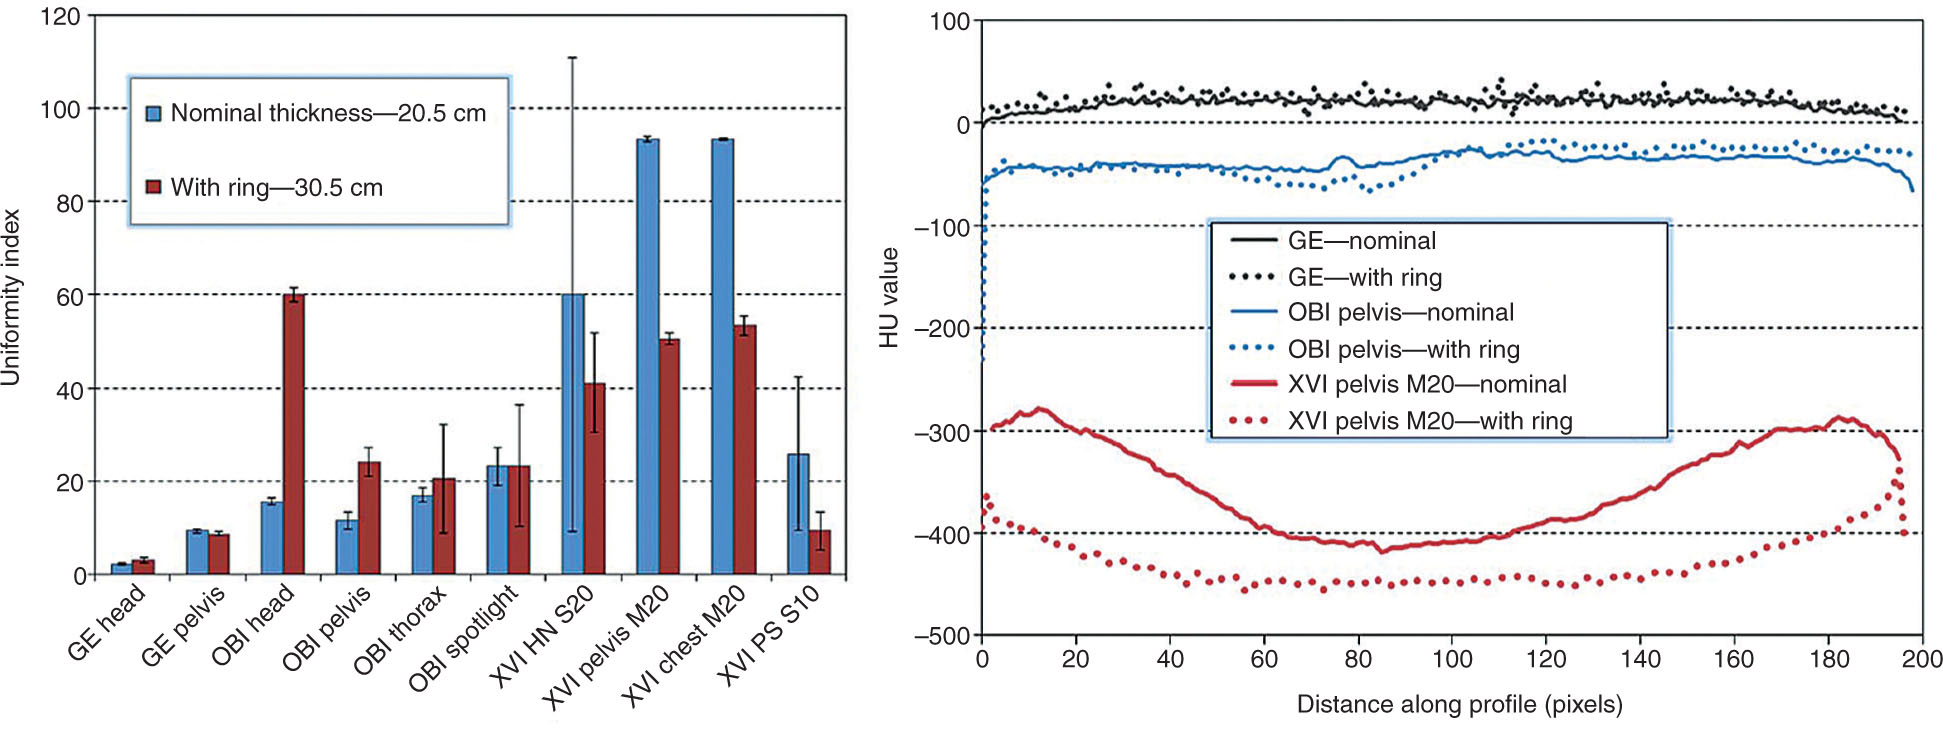
FIGURE 8.8 (Left) Uniformity index for each of the three imaging systems, including results for nominal Catphan phantom thickness (20.5 cm) and results with additional phantom thickness (30.5 cm total thickness). The error bars represent the standard deviation. (Right) Horizontal intensity profiles through the uniformity module of the Catphan phantom.
Source: From Gardner SJ, Studenski MT, Giaddui T, et al. Investigation into image quality and dose for different patient geometries with multiple cone-beam CT systems. Med Phys. 2014;41(3):031908. doi: 10.1118/1.4865788. http://onlinelibrary.wiley.com/wol1/doi/10.1118/1.4865788/full
121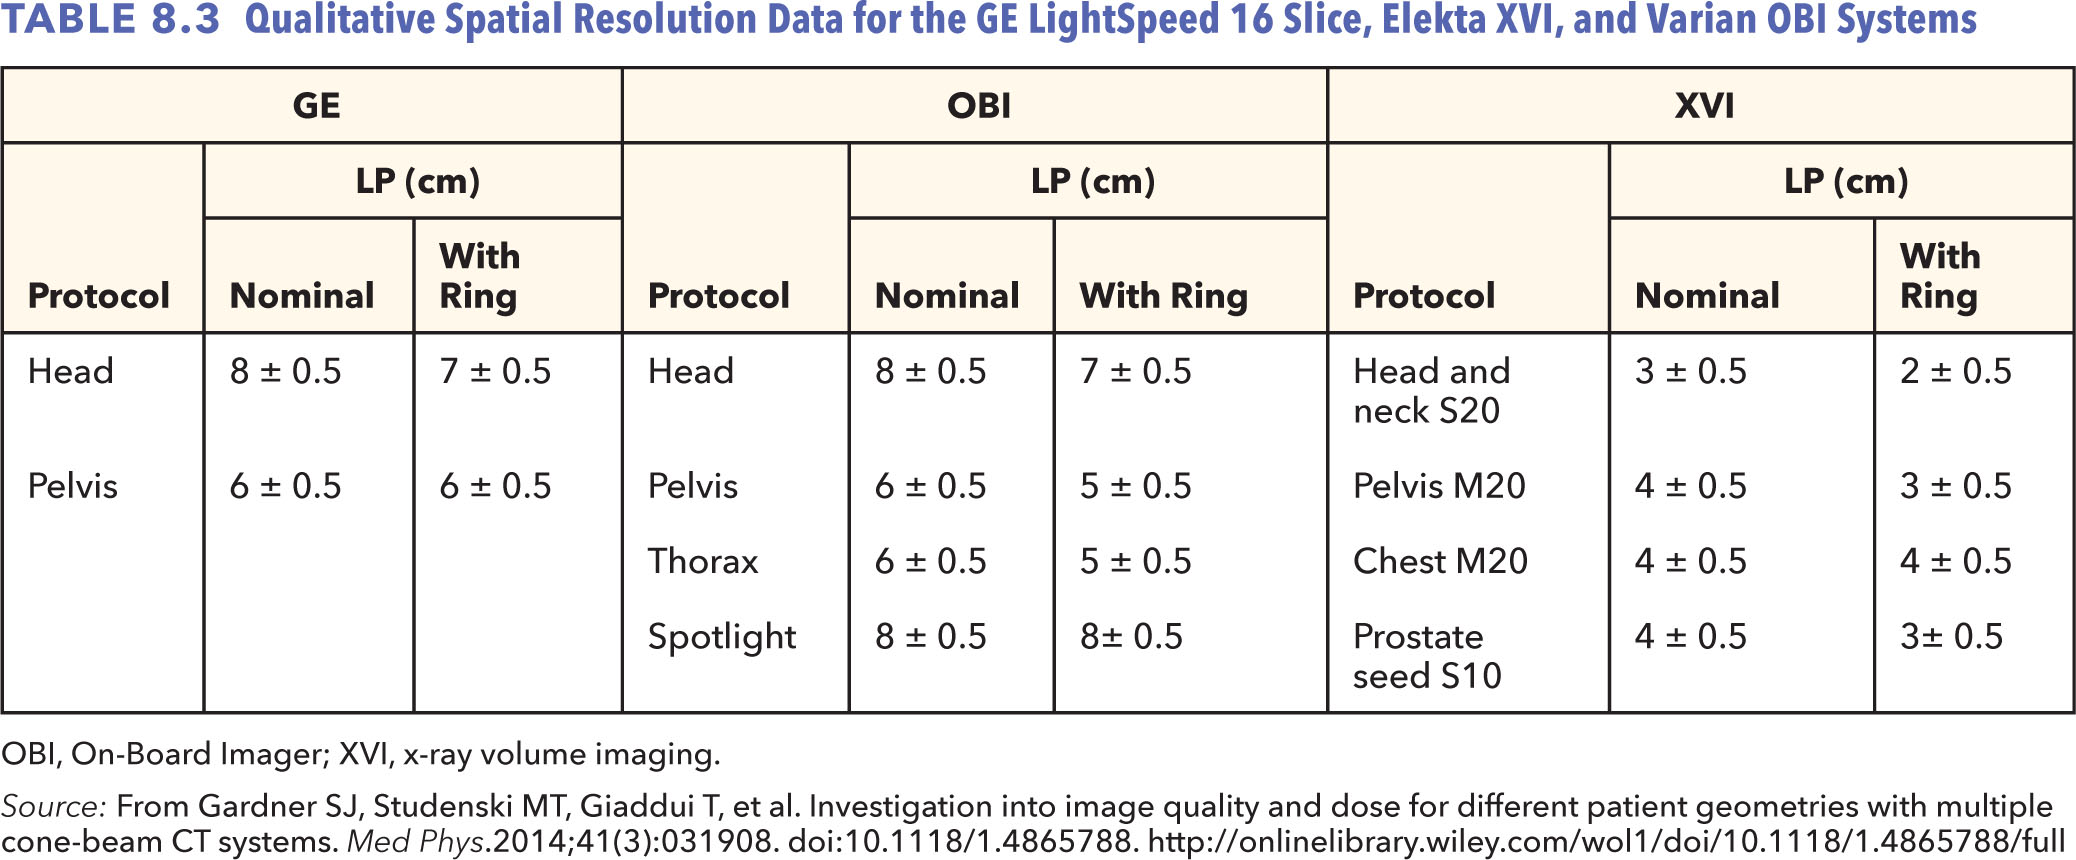
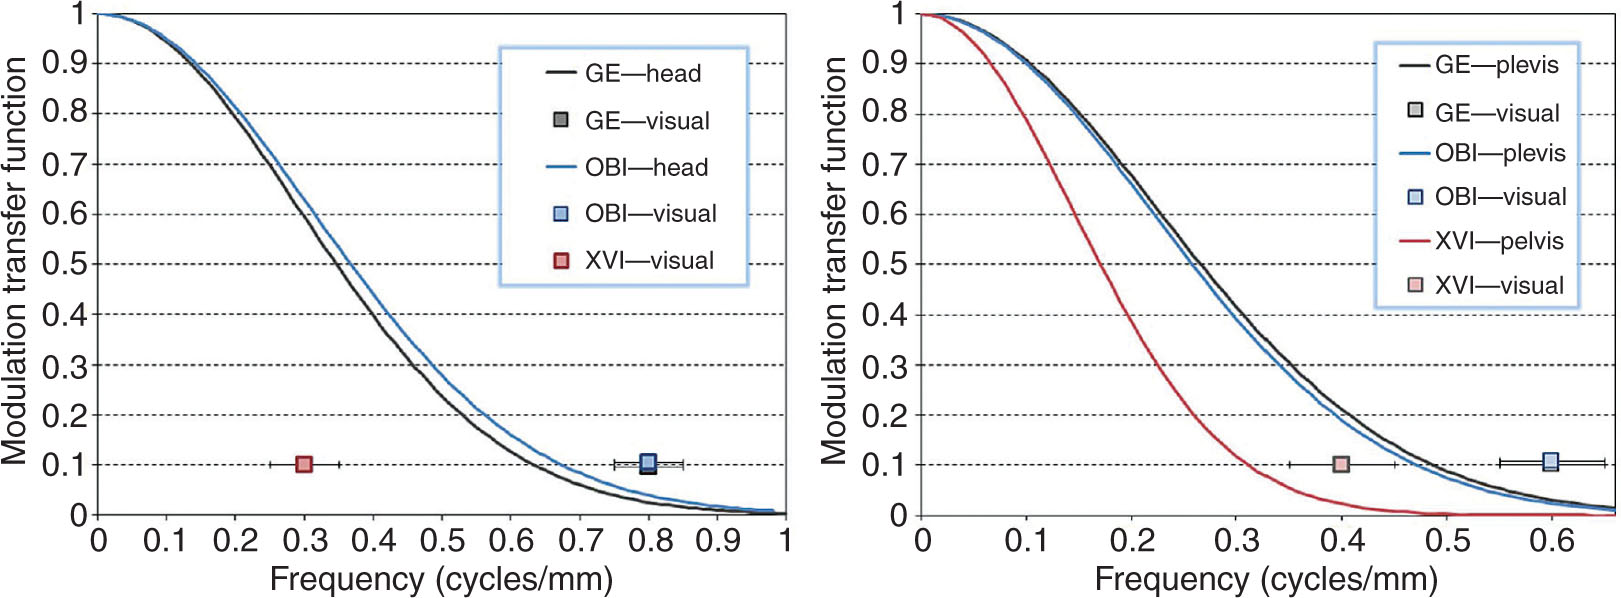
FIGURE 8.9 (Left) The MTF curves for the head protocol for GE LightSpeed 16 slice and Varian OBI. (Right) The MTF curves for the pelvis protocol for all three imaging systems.
MTF, modulation transfer function; OBI, On-Board Imager.
Source: From Gardner SJ, Studenski MT, Giaddui T, et al. Investigation into image quality and dose for different patient geometries with multiple cone-beam CT systems. Med Phys. 2014;41(3):031908. doi: 10.1118/1.4865788. http://onlinelibrary.wiley.com/wol1/doi/10.1118/1.4865788/full
Contrast-to-Noise Ratio
CNR determines the low contrast detectability of an imaging system and is defined as follows:
![]()
where ![]() represents the mean Hounsfield unit in the region of interest (ROI), whereas
represents the mean Hounsfield unit in the region of interest (ROI), whereas ![]() and
and ![]() represent the mean and standard deviation of the background. Fan-beam CT has better low contrast detectability than CBCT because of less photon scattering and better uniformity of the images. As the phantom size increases, the noise is also increased, hence reducing the CNR. Figure 8.10 shows the low contrast detectability at various gantry speeds of the OBI system. As the gantry speed increases from 1 to 6° per second, low contrast detectability decreases linearly with CNR ranging from 4.80 to 1.82 (56).
represent the mean and standard deviation of the background. Fan-beam CT has better low contrast detectability than CBCT because of less photon scattering and better uniformity of the images. As the phantom size increases, the noise is also increased, hence reducing the CNR. Figure 8.10 shows the low contrast detectability at various gantry speeds of the OBI system. As the gantry speed increases from 1 to 6° per second, low contrast detectability decreases linearly with CNR ranging from 4.80 to 1.82 (56).
Hounsfield Unit Accuracy
Figure 8.11 shows the Hounsfield unit sensitivity for three imaging systems using the Catphan 504 phantom. When changing the phantom thickness by 10 cm (i.e., comparing nominal thickness of 20.5 cm with thicker phantom with 30.5 cm thickness), the average change in Hounsfield unit for a typical pelvis helical CT scan with GE unit was less than 2% (16 HU). The full trajectory scan with half-fan bow-tie filter of the OBI system is also dependent on the phantom thickness. Santoso et al. investigated the variations of Hounsfield unit-electron density curves at different gantry speeds (from 1 to 6°/sec) using the Varian OBI system. The average Hounsfield unit values acquired at each gantry speed were within one standard deviation of each other (56). The XVI system shows relatively higher dependence on scanning protocols and patient thickness.
122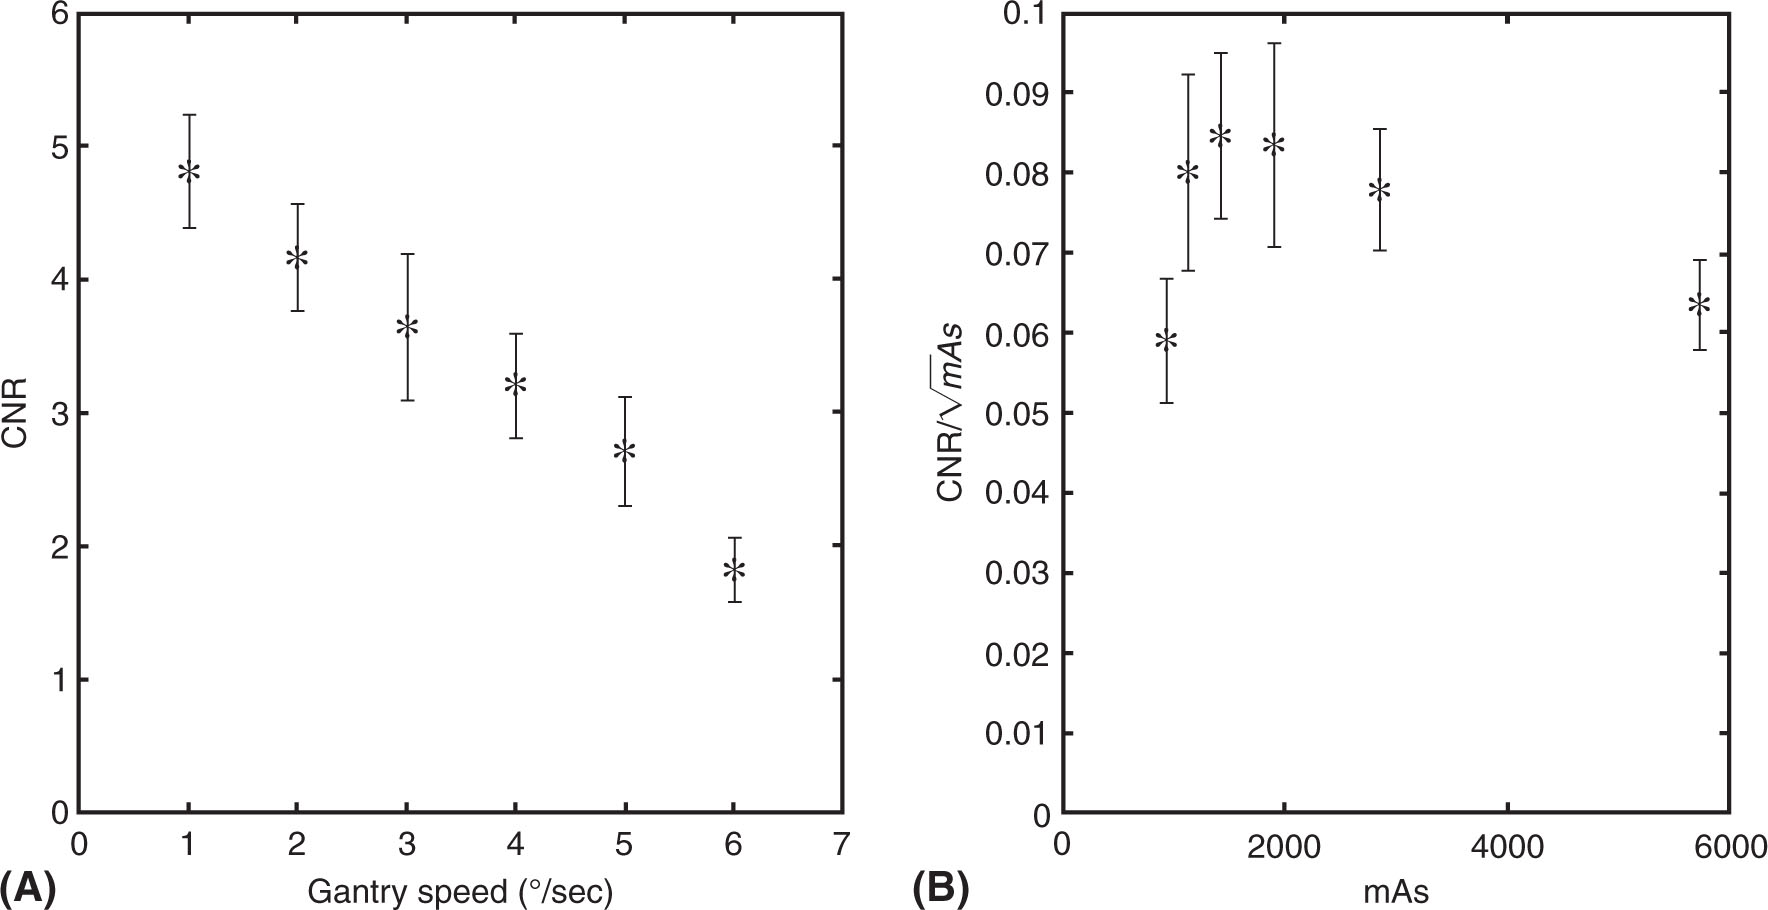
FIGURE 8.10 CNR for CBCT. All values were calculated over 10 individual slices and then averaged. Error bars represent standard error. (A) CNR exhibits a linear trend as a function of gantry speed (R2 = 0.988) and (B) CNR normalized to the square root of milliampere-second.
CBCT, cone-beam CT; CNR, contrast-to-noise ratio.
Source: From Santoso AP, Song KH, Qin Y, et al. Evaluation of gantry speed on image quality and imaging dose for 4D cone-beam CT acquisition. Radiat Oncol. 2016;11:98. doi: 10.1186/s13014-016-0677-8. http://ro-journal.biomedcentral.com/articles/10.1186/s13014-016-0677-8
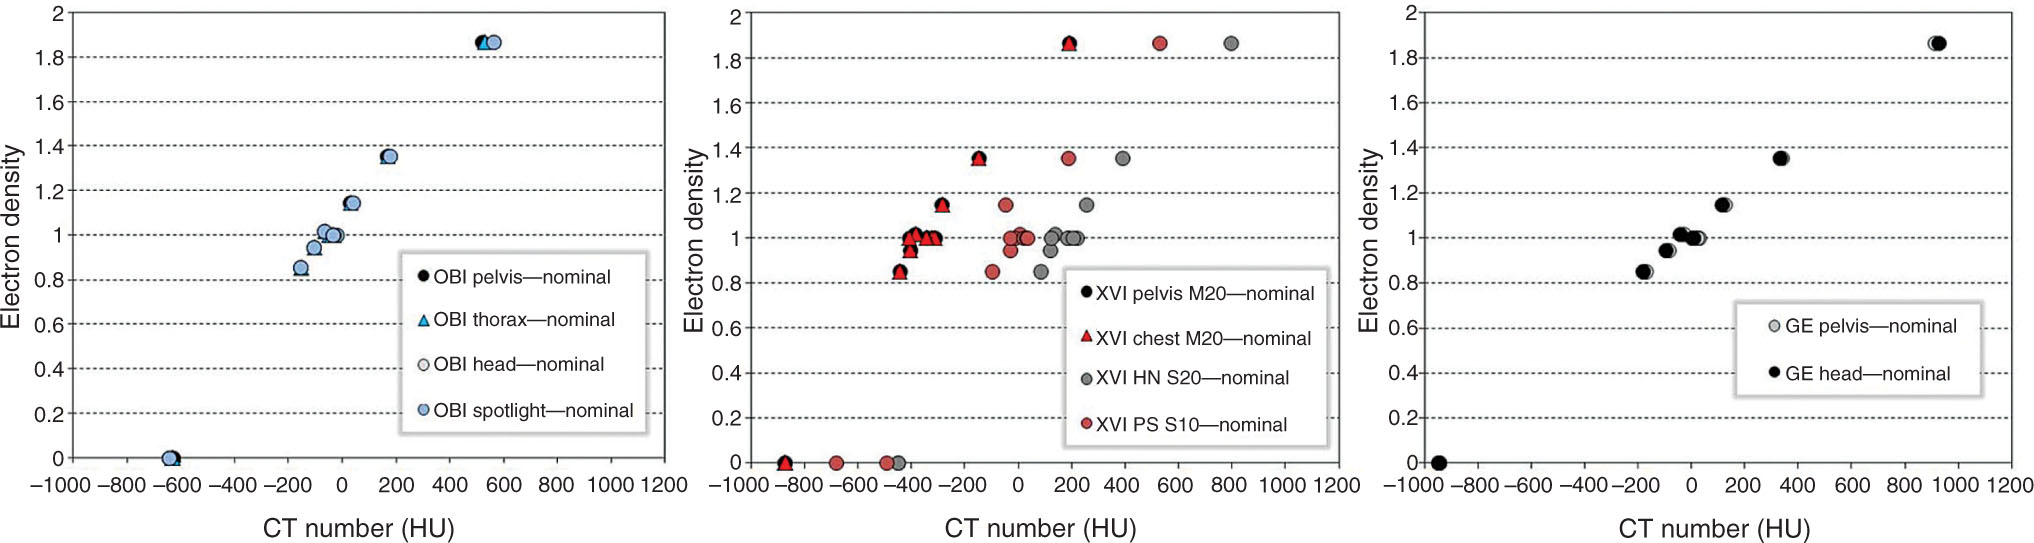
FIGURE 8.11 Hounsfield unit sensitivity data for each imaging system using the Catphan phantom. CT–electron density curves are constructed for each scan protocol of Varian OBI system (left), Elekta XVI system (middle), and LightSpeed scanner (right).
OBI, On-Board Imager; XVI, x-ray volume imaging.
Source: From Gardner SJ, Studenski MT, Giaddui T, et al. Investigation into image quality and dose for different patient geometries with multiple cone-beam CT systems. Med Phys. 2014;41(3):031908. doi: 10.1118/1.4865788. http://onlinelibrary.wiley.com/wol1/doi/10.1118/1.4865788/full
Imaging Dose
Volume CT dose index (CTDIvol) is the primary CT scanner dose descriptor and is also the key parameter used by multiple accreditation agencies including the ACR for CT scanner accreditation. CTDIvol is obtained by using a 100-mm-long pencil-shaped ionization chamber in one of the two circular plastic reference phantoms: a 16-cm phantom for pediatric and adult head and a 32-cm phantom for adult torso measurement. CTDIvol is directly proportional to tube current time product. The relationship between CTDIvol and pitch depends on the vendor settings. Automatic exposure control (AEC) aims to achieve a specified image quality across a range of patient sizes through automatic adjustment of tube current. AEC decreases CTDIvol 123with decreasing size of the patients. An advantage of CTDIvol is that it measures the radiation output of a CT scanner in a consistent manner. However, it can be used only as a surrogate for patient dose because it lacks corrections for patient size. To estimate patient dose more accurately, a known exponential correction between patient size and absorbed dose should be applied (59). CTDI should be measured during the commissioning and on an annual basis with a tolerance of ±20% of the manufacturer specification.
Imaging dose of the CBCT system is generally measured with calibrated ion chambers in the kV energy range (60), thermoluminescent dosimeters (TLDs), optically stimulated luminescent dosimeters (OSLDs), or Gafchromic film (61–63). The AAPM TG-61 report provides recommendations on how to calculate the absolute dose in the kV range (60). Santoso et al. measured dose rate of 3.0 × 10⁻³ cGy/mAs at isocenter within a thorax phantom (CIRS Inc., Norfolk, Virginia) of the CBCT on the TrueBeam linac (Varian Medical Systems, Palo Alto, California) (56). Gardner et al. used Gafchromic films to measure the CBCT dose on a Wellhofer Scanditronix phantom and reported isocenter doses of (2.72 ± 0.11) × 10–3 cGy/mAs (54). The imaging dose decreases as the patient thickness increases. The imaging dose for the OBI system is on the order of ~2 cGy for the pelvis protocol, ~0.5 cGy for the thorax protocol, and ~1 cGy for the half-trajectory spotlight protocol. For the XVI system, the imaging dose is about 2 cGy for the pelvis M20 and chest M20 protocol and 0.5 cGy for the prostate seed S10 protocol.
Summary
A summary of QA recommendations distributed among daily, monthly, and annual QA is as follows.
Daily QA (image quality is assessed for CBCT only) is used to verify:
1. CT number for water, 0 ± 5 HU
2. Field uniformity within ±5 HU
3. Image noise within manufacturer tolerance
4. In-plane spatial integrity within ±1 mm
Monthly QA is used to verify:
1. CT number accuracy
2. In-plane spatial integrity in x and y directions (±1 mm)
3. Radiation profile width within manufacturer specifications
4. Accuracy of the electron density to CT number conversion
5. Spatial resolution (using the MTF)
6. Contrast resolution (low-contrast test)
Annual QA is used to verify:
1. CTDIvol from scanning within ±20% of the manufacturer specifications
Image Quality and Geometric Distortion Assessment for MRI
As radiation oncology departments start incorporating MRI into routine clinical workflow, there is a demand to develop a robust QM program to ensure accuracy and avoid errors. The AAPM TG-117 has been working on providing guidance for optimization of MRI protocols with high spatial accuracy, and proposing QM tests to ensure safe implementation of MRI data in treatment planning and stereotactic procedures. The AAPM TG-284 has been addressing the acceptance, commissioning, and QA procedures for MR simulators in radiation therapy. However, currently there is a lack of guidance documents describing the unique radiation therapy QA activities associated with MRI for simulation and treatment. The ACR MRI accreditation program provides clinical image quality guidance on topics such as exam pulse sequences, image contrast, imaging planes, spatial/temporal resolution, and imaging artifacts. Even though the facility may not pursue accreditation from the ACR, it is still helpful to implement an effective QA program following the ACR phantom tests and recommended acceptance criteria (64).
The American College of Radiology Phantom
The ACR MRI phantom is a hollow cylinder of acrylic plastic that is filled with a solution of nickel chloride and sodium chloride. The phantom has seven structures to determine the performance level of MR systems: geometric accuracy, high-contrast spatial resolution, slice thickness and position accuracy, slice position accuracy, image intensity uniformity, percentage signal ghosting, and low-contrast object detectability.
Five image sets are usually acquired to evaluate scanner performance: a sagittal localizer using a 20-mm-thick single-slice spine-echo acquisition, T1- and T2-weighted axial series defined by the ACR, and T1- and T2-weighted axial series used by the site. Figure 8.12 shows a sagittal localizer with two pairs of 45° wedges lying at each end of the phantom. The 11 axial slices span between the vertices of the two pairs of wedges with 5-mm slice thickness and 5-mm gap.
124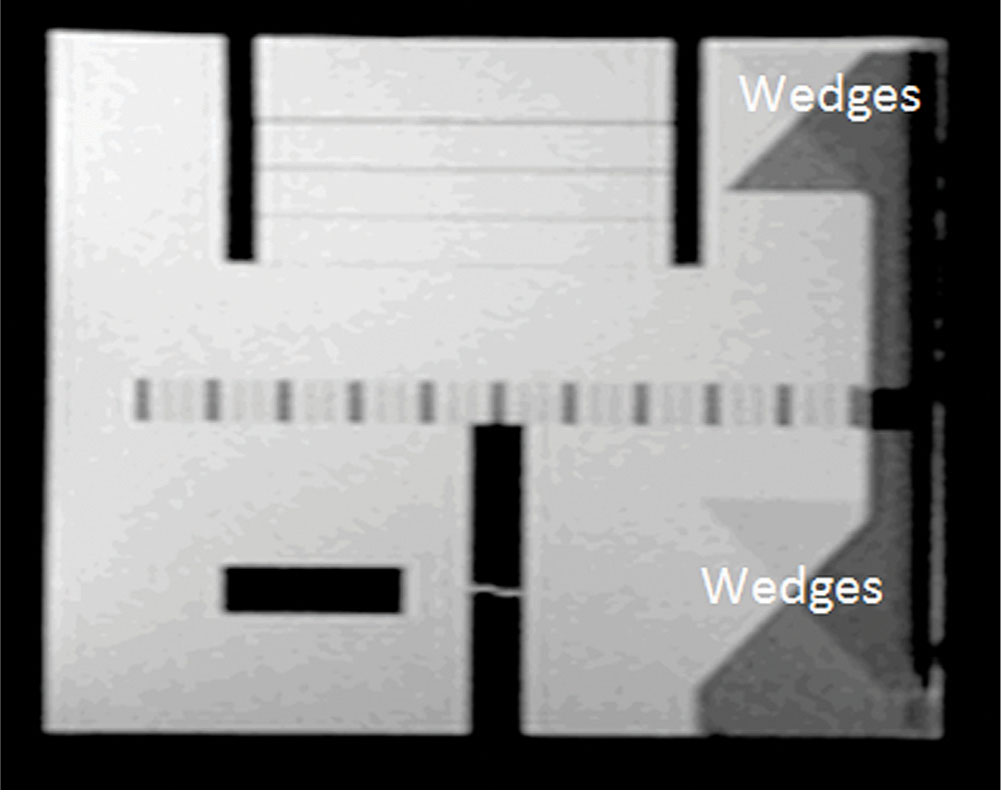
FIGURE 8.12 Sagittal localizer of the ACR phantom. Two pairs of 45° wedges lie at each end of the phantom.
ACR, American College of Radiology.
Geometric Accuracy
The length of the ACR phantom is 148 mm and the diameter is 190 mm. The length is measured along a line at the center of the phantom in the sagittal localizer. The diameter is measured in four directions in the axial slices: top-to-bottom, left-to-right, and two diagonals. The measured lengths should be within 2 mm of the true values.
High-Contrast Spatial Resolution
Figure 8.13 shows an image of axial slice with three pairs of arrays of holes in the resolution insert. Each pair of hole arrays consists of an upper left and a lower right hole array, each of which comprises four columns of four holes. The hole diameter of the left pair is 1.1 mm, the center pair 1.0 mm, and the right pair 0.9 mm. A resolution of 1.0 mm or better in both row and column directions is recommended.
Slice Thickness Accuracy
The slice thickness insert has two crossing signal ramps with positive and negative slopes of 10 to 1 with respect to the image plane. Therefore, the ramps shown in the image are 10 times the thickness of the slice. The slice thickness is calculated with the following formula:
Slice thickness = 0.2 × (length of top ramp × length of bottom ramp)/(length of top ramp + length of bottom ramp)
For example, as shown in Figure 8.14, the top ramp length is 50.2 mm and the bottom length is 55.9 mm. The slice thickness is 0.2 × (50.2 × 55.9)/(50.2 + 55.9) = 5.29 mm. The measured slice thickness using the ACR series should be within 5.0 ± 0.7 mm.
Slice Position Accuracy
The slice position accuracy test assesses the difference between the prescribed and actual positions at both inferior and superior ends of the phantom. These two axial slices are aligned with the vertices of the crossed wedges, which appear as a pair of vertical bars at the anterior side of the phantom. If the slice is displaced superiorly (inferiorly) with respect to the vertex of the wedges, the bar at the right (left) side will be longer. The recommended bar length difference should be within 5.0 mm. Figure 8.15 shows that the right bar is 2.8 mm longer than the left bar, implying that the slice is dispositioned superiorly.
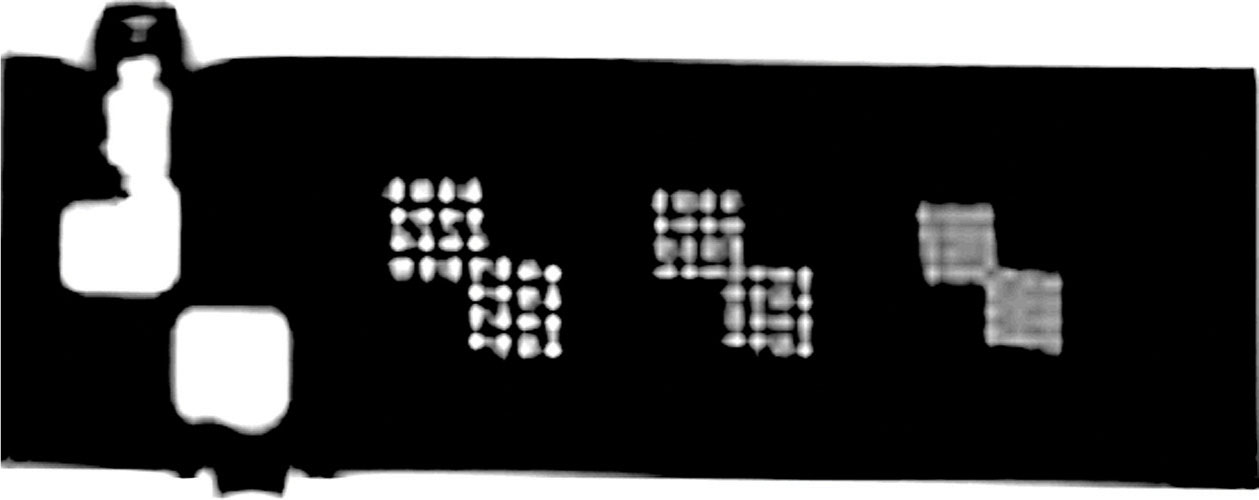
FIGURE 8.13 Three pairs of arrays of holes (left: 1.1 mm; middle: 1.0 mm; right: 0.9 mm) in the resolution insert. The 1.0-mm array is visible in both row and column directions.
125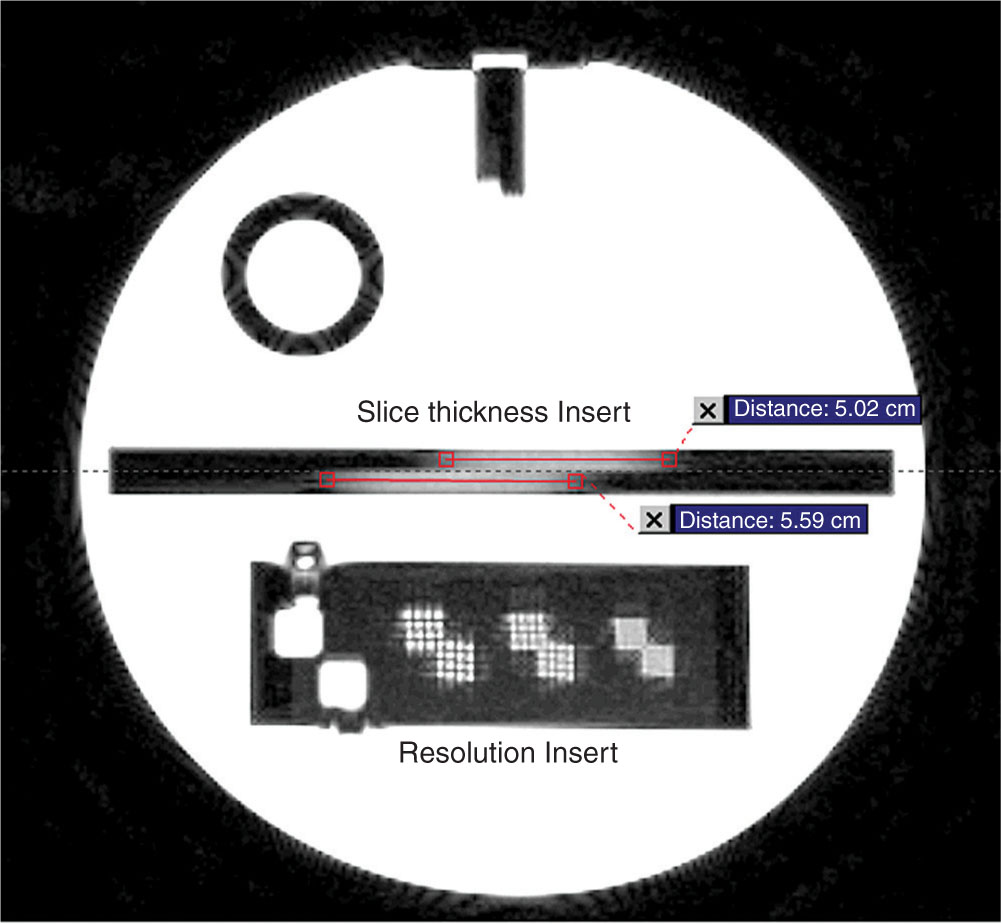
FIGURE 8.14 The slice thickness insert with two crossed signal ramps. The top ramp length is 5.02 cm and the bottom length is 5.59 cm. The slice thickness is calculated on the basis of these two measures.
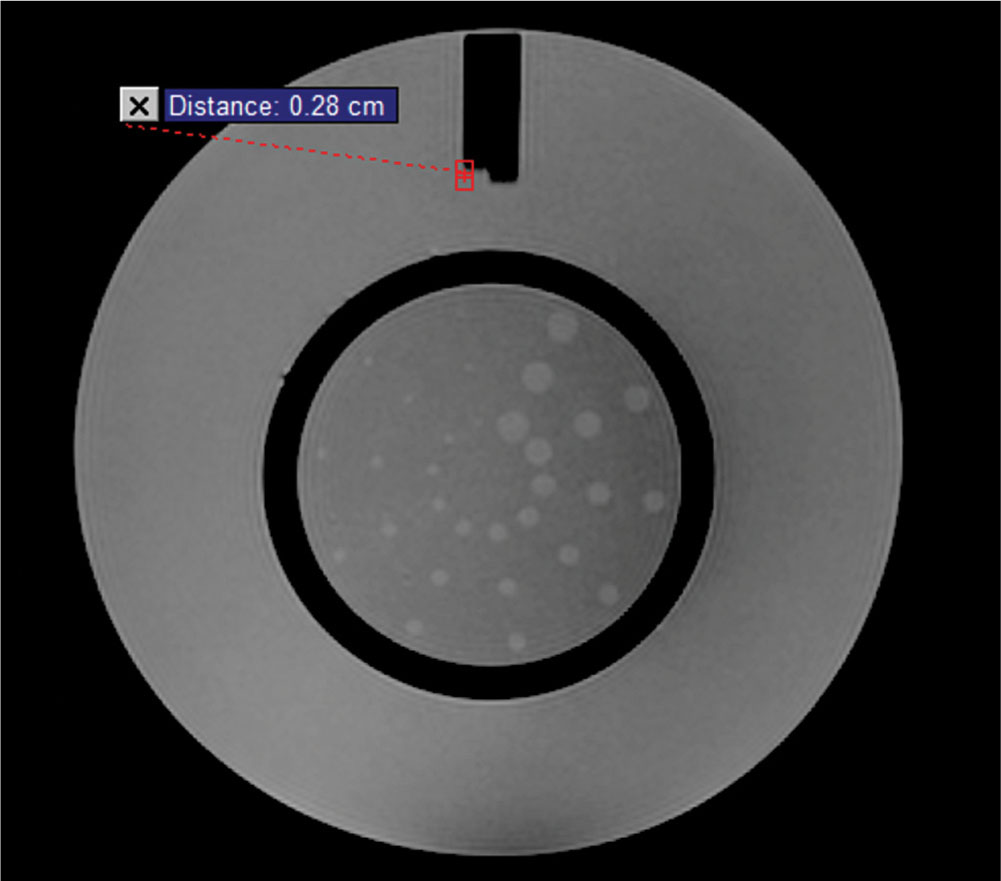
FIGURE 8.15 The insert for slice position accuracy test and low-contrast object detectability. The vertices of the crossed wedges are aligned in this slice that appears as a pair of vertical bars at the anterior side. The bar length difference tells how much the phantom is dispositioned. The center of the slice shows the low-contrast objects with spokes of small disks radiating from the center of a circle. All 10 spokes are visible in this image.
Low-Contrast Object Detectability
The low-contrast objects have spokes of small disks radiating from the center of a circle. There are 10 spokes with the disk diameter ranging from 7.0 to 1.5 mm. The low-contrast objects appear on four axial slices with the contrast values of 1.4%, 2.5%, 3.6%, and 5.1%. The passing score is 37 complete spokes over four slices for a 3-T MRI system and nine for a scanner with less than 3-T field strength. Figure 8.15 shows the circle of low-contrast objects with a score of 10 spokes.
Geometric Fidelity Test
The inhomogeneity in the static magnetic field and nonlinearities in the spatial encoding gradients contribute to system-level distortions. The system-level geometric accuracy should be evaluated using a 3D phantom (commissioning and annual QA) and a 2D phantom (daily or weekly QA) considering the high geometric fidelity requirement in radiation oncology. The phantom used to characterize distortion contains a grid of phantom markers with a dimension in the order of 30 to 40 cm. Considering the phantom size, a body coil that is integrated into the MR system can be used for phantom scanning. A planar phantom is usually used for 2D distortion evaluation and it is scanned in each of three planes to verify the amount of in-plane distortion. The vendor typically provides a package for routine 2D distortion characterization including the phantom, exam card, and image analysis software package. Deviations between the expected and measured values for each marker are calculated and a distortion map is derived in a defined ROI. Figure 8.16 shows a vendor-provided geometric planar distortion phantom scanned in axial, sagittal, and coronal planes. The isocontours ranging from 2 to 6 mm are interpolated in the image on the basis of the calculated deviations on each plane. In this manner, 2D distortion can be assessed qualitatively and quantitatively on a regular basis.
A more systematic evaluation of 3D distortion and correction has been investigated and reported in the literature (65–70).
Summary
In addition to the ACR-recommended image quality QA test, other tests should include characterization of static magnetic homogeneity, receiver gain (to amplify and digitize the signal), transmitter gain (the radiofrequency energy to apply a 90° pulse), and central frequency. This information can be extracted from the scanner’s log files directly. Tests needed include the offset distance between external laser and imaging isocenter, the 3D gradient distortion, the couch position accuracy, and the residual errors for patient simulation and treatment localization.
126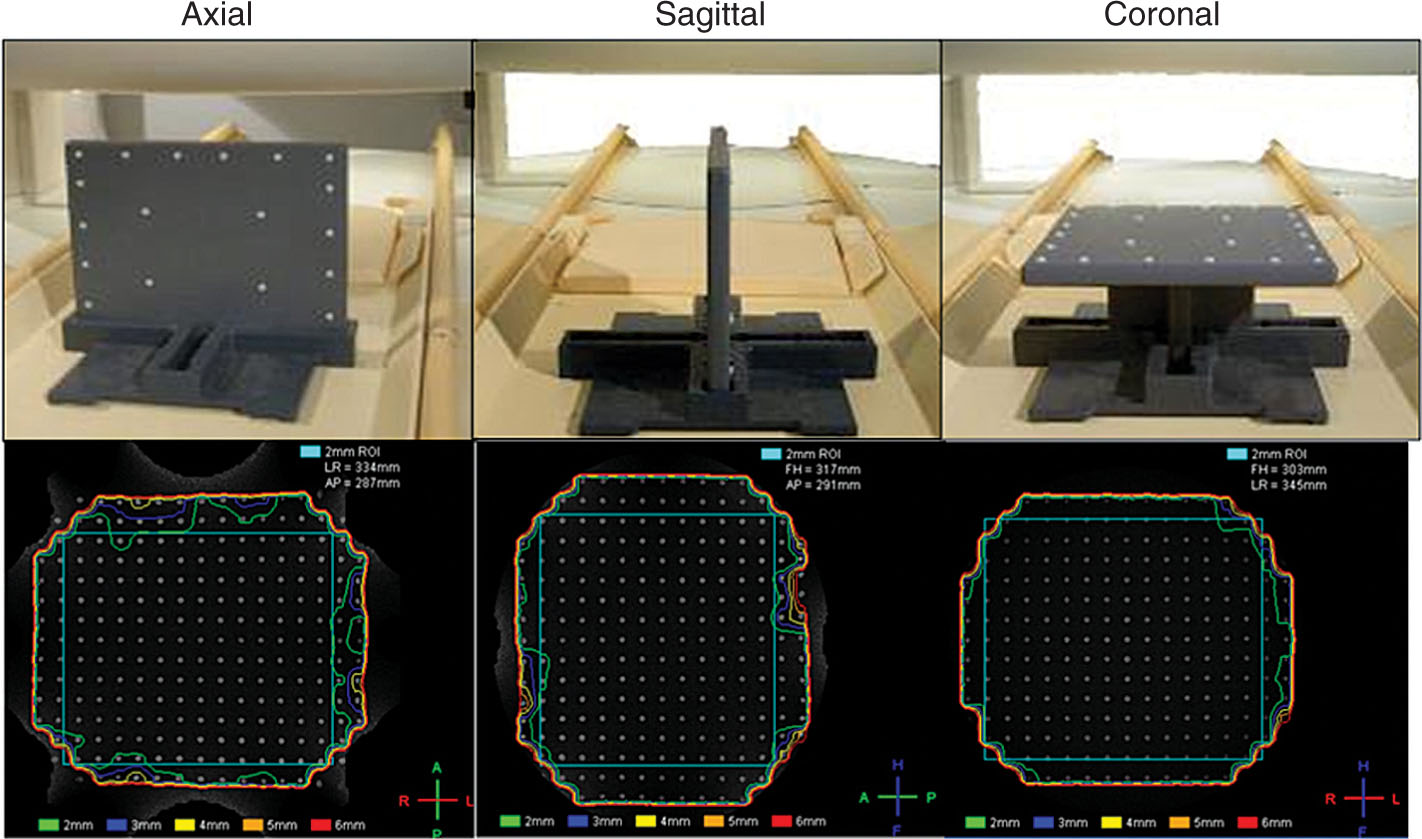
FIGURE 8.16 (Top) 2D phantom provided by the manufacturer for 2D distortion evaluation; (bottom) distortion plots with isocontours ranging from 2 to 6 mm.
2D, two-dimensional.
Source: From Glide-Hurst CK, Wen N, Hearshen D, et al. Initial clinical experience with a radiation oncology dedicated open 1.0T MR-simulation. J Appl Clin Med Phys. 2015;16(2):218-240. doi: 10.1120/jacmp.v16i2.5201. http://onlinelibrary.wiley.com/doi/10.1120/jacmp.v16i2.5201/full
End-to-End Tests
The Winston–Lutz test has become a standard test to evaluate the isocentricity of conventional linacs (11). The E2E test procedure should be performed during the commissioning and should be tested on an annual basis to check the geometric and dosimetric uncertainties of the SRS system. Modern E2E test phantoms consist of a comprehensive package for multimodality image acquisition and fusion tests, image quality QA, geometric isocenter evaluation, and dose calculation accuracy QA. E2E tests can incorporate the volumetric and spatial fidelity between different image modalities, the coincidence of each image modality with the radiation center, the coincidence of gantry, collimator, and couch axes with the radiation isocenter, and the dosimetric accuracy of delivery.
Volumetric and Spatial Fidelity
The E2E test phantom typically has MRI/PET/CT target inserts to compare shapes and volumes using different imaging modalities, and to evaluate the accuracy of image registration including deformable image registration. For PET or MR imaging, the target cavity is filled with compatible liquids with known volumes. Figure 8.17 shows the insert appearance of volumetric inserts of a Lucy phantom (Standard Imaging, Middleton, Wisconsin) acquired with a CT scanner (120 kVp, 284 mAs) and 1.0-T MR simulator (3D T1-weighted fast field echo, TR = 25 milliseconds, TE = 6.9 milliseconds) (65). The difference between the scanned volumes and manufacturer-stated volumes can be computed to evaluate volumetric fidelity of each imaging system.
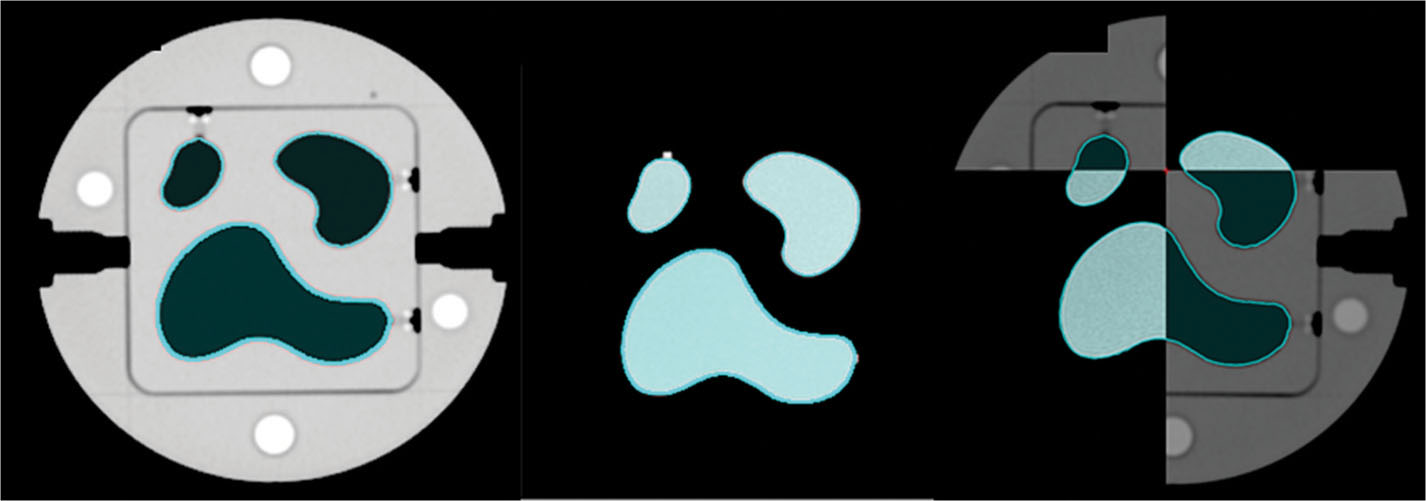
FIGURE 8.17 Lucy 3D QA Phantom CT-SIM, MR-SIM, image fusion, and volumetric comparisons.
3D, three-dimensional; MR, magnetic resonance; QA, quality assurance; SIM, simulator.
127A 3D spatial distortion grid can be used to evaluate spatial fidelity, image registration accuracy, and image distortion across the multiple modalities. The grid consists of an array of orthogonal wires embedded in an acrylic box. It is filled with MR- or PET-compatible liquids. The grid spacing is usually in the order of 10 mm. After the image sets from CT, MR, or PET dataset are fused together, the displacement for each marker between the two image sets can be computed to assess the fusion accuracy and spatial fidelity. The measured grid dimensions can be used to evaluate the image distortion.
Evaluation of the Localization Accuracy
To evaluate the coincidence of imaging to radiation isocenter, the phantom should be localized with the imaging modality used for patient localization. After the couch correction is made on the basis of the image registration results, the Winston–Lutz test can be performed using a combined gantry, collimator, and couch angles to quantify systematic and random errors of the localization accuracy. MLC-defined field size, jaw-defined field size, and cone-defined field size should be tested individually to evaluate the targeting accuracy of each collimation system. Figure 8.5 shows Winston–Lutz results with a 2 × 2 cm2 MLC-defined field sizes taken at a combination of 14 gantry, collimator, and couch angles using the portal imager. Deviation was calculated by measuring radial distance between the center of the central BB and the full width at half-maximum of the radiation field. If multiple imaging modalities are available for patient localization, the localization accuracy should be evaluated for each imaging system. Wen et al. measured the targeting accuracy of the Edge radiosurgical platform (Varian Medical Systems, Palo Alto, California). The radial distance at a combination of gantry, collimator, and couch angles was 0.44 ± 0.25, 0.47 ± 0.26, and 0.43 ± 0.13 mm with jaw-, MLC-, and cone-defined field sizes, respectively, using CBCT-based localization (66). The localization accuracy was 0.03 ± 0.11, 0.05 ± 0.11, and 0.04 ± 0.08 mm along the lateral, longitudinal, and vertical directions, respectively, for the optical surface management system, and –0.04 ± 0.07, 0.00 ± 0.20, and –0.03 ± 0.38 mm, respectively, for the Calypso system. The image resolution of simulation CT has impact on the localization accuracy. Murphy reported that the localization accuracy was improved by a factor of 2 when the CT slice thickness was reduced from 3.0 to 1.5 mm on a CyberKnife unit (67). High-resolution digitally reconstructed radiographs (DRRs) generated from finer CT slice thickness could improve the fusion accuracy of 2D–3D image registration algorithm. However, no further improvement was noticed as the slice thickness was reduced from 2 to 0.625 mm (68). There was no correlation between the CBCT slice thickness and the localization accuracy because of redundant information provided from CBCT images for 3D–3D image registration (69).
Independent Verification With IROC Houston Phantom and OSLD Measurements
After commissioning, an independent verification should be performed to verify that no systematic or dosimetric errors occurred during commissioning. Independent verification can be performed in multiple ways by using an independent measurement device, having an independent user perform measurements, having a consulting group do independent verifications, having an audit performed by another party, or performing irradiations of a dosimeter to be read out by a third party. The IROC Houston Quality Assurance Center at MD Anderson is an excellent resource to perform independent measurements (70).
OSLD Measurements
IROC Houston uses OSLD devices to perform independent external dosimetry audits of photon and electron beams. The OSLDs are shipped from IROC Houston to the requesting institution where they are irradiated by the institution.
Anthropomorphic Phantom Irradiation
IROC Houston also has available a variety of anthropomorphic phantoms for irradiation used for independent verification, including the following: an SRS head phantom, an IMRT head and neck phantom, a spine phantom, a thorax phantom, a liver phantom, and a pelvis/prostate phantom. Each phantom is used to simulate a specific clinical site and treatment and can be used to validate the treatment workflow at a given institution (Figure 8.18).
Typical acceptable TLD/OSLD deviations are ±5% or 7%, given that the dosimetric precision of the TLD is 3%. Depending on the phantom, the film gamma passing criteria range from 7%, 4 mm for the head and neck phantom to 5%, 3 mm for the spine phantom, where the acceptable pass rate is above 85%.
128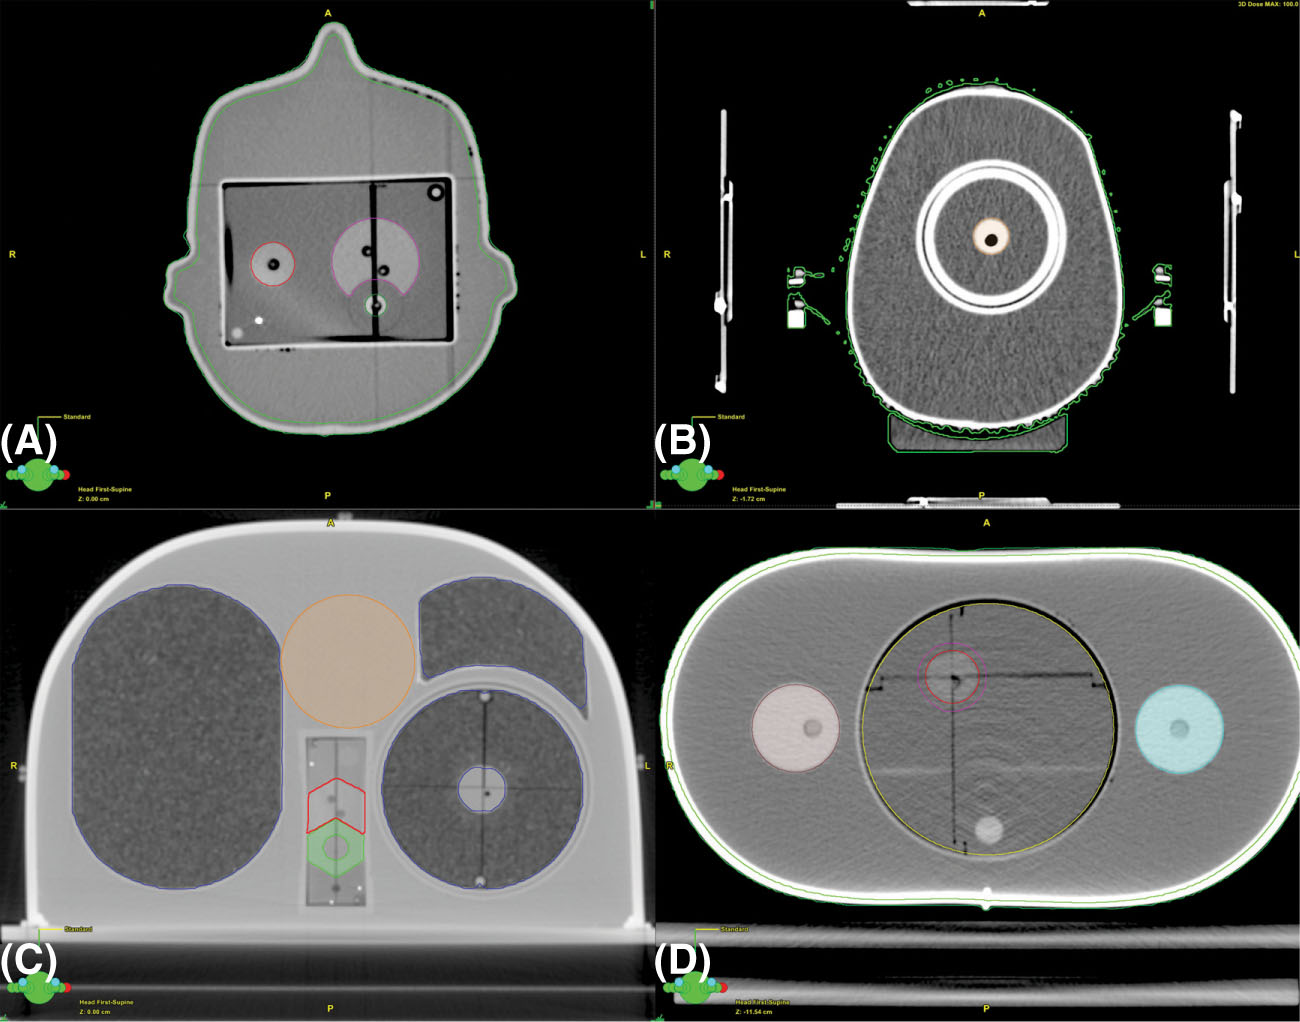
FIGURE 8.18 Axial cross-section of a selection of IROC Houston phantoms including (A) head and neck IMRT phantom; (B) SRS phantom; (C) thorax phantom for spine, lung, and spine/lung irradiations; and (D) liver phantom showing axial cut through PTV2.
IMRT, intensity-modulated radiation therapy; IROC, Imaging and Radiation Oncology Core; PTV, planning target volume; SRS, stereotactic radiosurgery.
Daily Localization QA
The Winston–Lutz test and imaging and treatment coordinate coincidence should be evaluated on a daily basis with 1-mm tolerance for SRS/SBRT QA. An integrated daily test was proposed by Wen et al. to assess the overall accuracy of image-based localization and treatment delivery in one setting (71). The phantom was set up on top of an acrylic base plate and fixed to the pegs of an indexing bar for consistent setup (vertical: 10.0 cm; longitudinal: 98.5 cm; lateral: 0.0 cm, pitch: 0.5°, and roll: 0.5°). The optical system was first used to localize the phantom surface and CBCT images were acquired and six-dimensional fusion shifts were recorded and applied after CT and CBCT image fusion. The phantom position in the optical system after correction was recorded to compare the results against the initial setup. An orthogonal MV/kV image pair was taken and 2D–3D image registration was performed to quantify the residual errors. Twelve 2 × 2 cm2, MLC-defined portal images were acquired at four gantry, four couch, and four collimator angles to verify the isocenter targeting accuracy. Figure 8.19 shows the phantom setup and images acquired from optical system and CBCT. Using this phantom, the coincidence between different imaging modalities (optical system vs. CBCT, CBCT vs. MV/kV), the accuracy of 6DoF correction of the couch, the coincidence between the imaging system and the radiation isocenter, and the Winston–Lutz test can all be assessed efficiently on a daily basis.
Summary
The AAPM TG-142 report summarized the machine tolerances for SRS deliveries (27). The net uncertainty in target localization and treatment delivery was 2.4 mm when considering all the factors including the mechanical position uncertainty of a stereotactic frame, the CT/MRI image resolution, and the isocentric alignment accuracy. The uncertainty has been further reduced with the improvement of CT/MRI image resolution. It is essential to assess the cumulative errors of linac-based, image-guided frameless SRS with a robust E2E test procedure on a regular basis to ensure high accuracy required for SRS.
A robust QM program is essential for safe and effective treatment of patients using SRS/SBRT. The program should be developed with input from all practicing team members, including physicists, physicians, dosimetrists, and other relevant professionals. The program should include comprehensive tests for commissioning, daily, monthly, and annual QA, patient-specific QA, as well as checklists to capture the salient safety checks needed during simulation, planning, and treatment. Independent checks of commissioning, linac calibration, and routine QA procedures are strongly recommended. An auditing program to ensure proper updates of regular QA procedures, as well as reporting of potential errors or near misses, is strongly recommended.
129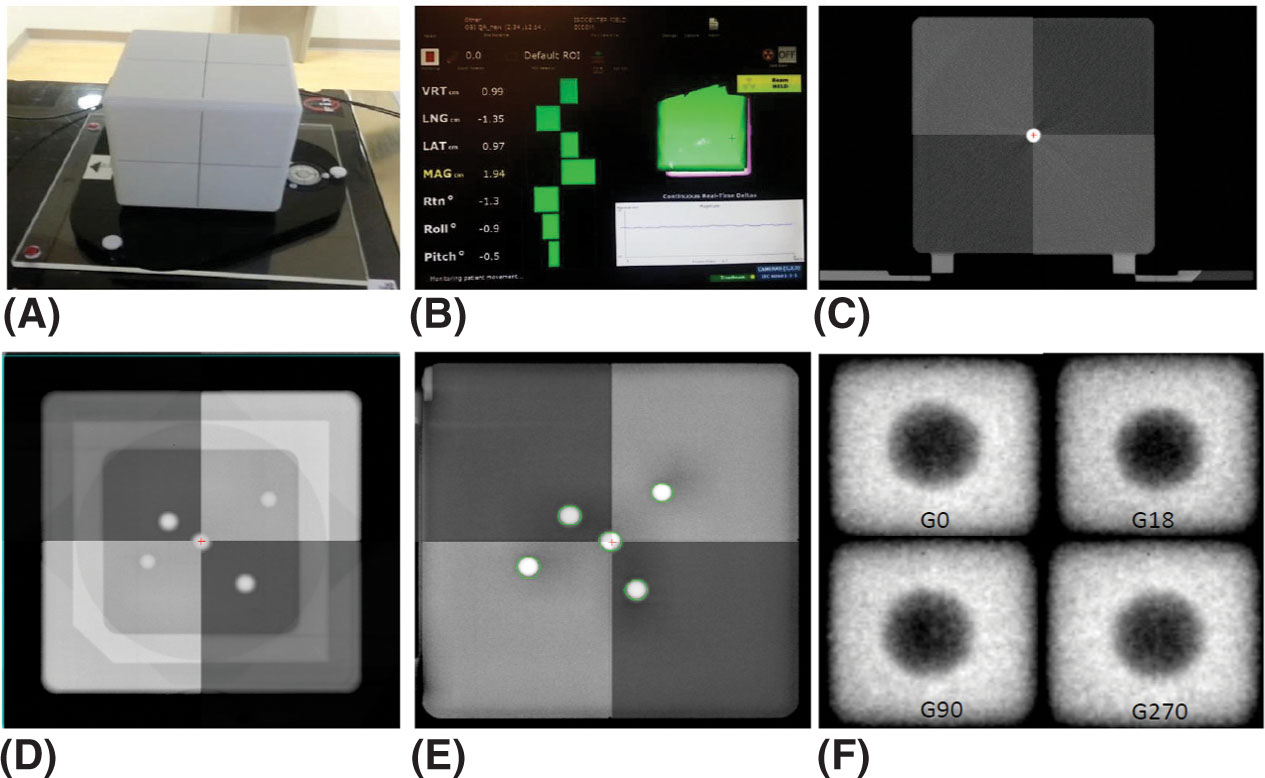
FIGURE 8.19 The QA phantom (A) on top of an acrylic base plate. The localization (B) of phantom surface using the optical system. The difference (delta) between the current position of the Optical Surface Monitoring System (OSMS) phantom and its reference position is shown in 6DoF. The 6° automatic fusion (C) between planning CT and CBCT after adjusting the contrast of the acquired image and reference image to achieve optimal visualization of the BBs. An orthogonal MV (D)/kV (E) image set is taken and 2D–3D image fusion is performed to quantify the residual error. Four representative (F) MLC-defined portal images of the Winston–Lutz test.
CBCT, cone-beam CT; DoF, degrees of freedom; MLC, multileaf collimator; OSMS, optical surface monitoring system; QA, quality assurance.
Source: From Wen N, Li H, Song K, et al. Characteristics of a novel treatment system for linear accelerator-based stereotactic radiosurgery. J Appl Clin Med Phys. 2015;16(4)125-148. doi: 10.1120/jacmp.v16i4.5313. http://onlinelibrary.wiley.com/doi/10.1120/jacmp.v16i4.5313/full
ACKNOWLEDGMENT
This work was supported by the American Cancer Society under a Research Scholar Grant RSG-15-137-01-CCE.
REFERENCES
1. Kry SF, Molineu A, Kerns JR, et al. Institutional patient-specific IMRT QA does not predict unacceptable plan delivery. Int J Radiat Oncol Biol Phys. 2014;90:1195-1201. doi: 10.1016/j.ijrobp.2014.08.334
2. Huq MS, Fraass BA, Dunscombe PB, et al. The report of Task Group 100 of the AAPM: application of risk analysis methods to radiation therapy quality management. Med Phys. 2016;43: 4209. doi: 10.1118/1.4947547
3. Miller B, Movsas B, Siddiqui M, et al. FMEA and fault tree ananlysis applied to vendor customer technical bulletins. Med Phys. 2013;40:493. doi: 10.1118/1.4815600
4. Klein EE, Hanley J, Bayouth J, et al. Task Group 142 report: quality assurance of medical accelerators. Med Phys. 2009; 36:4197-4212. doi: 10.1118/1.3190392
5. Kutcher GJ, Coia L, Gillin M, et al. Comprehensive QA for radiation oncology: report of AAPM Radiation Therapy Committee Task Group 40. Med Phys. 1994;21:581-618. doi: 10.1118/1.597316
6. Sharpe MB, Miller BM, Yan D, et al. Monitor unit settings for intensity modulated beams delivered using a step-and-shoot approach. Med Phys. 2000;27:2719-2725. doi: 10.1118/1.1328383
7. Chui CS, Spirou S, LoSasso T. Testing of dynamic multileaf collimation. Med Phys. 1996;23:635-641. doi: 10.1118/1.597699
8. Low DA, Sohn JW, Klein EE, et al. Characterization of a commercial multileaf collimator used for intensity modulated radiation therapy. Med Phys. 2001;28:752-756. doi: 10.1118/1.1367863
9. Kielar KN, Mok E, Hsu A, et al. Verification of dosimetric accuracy on the TrueBeam STx: rounded leaf effect of the high definition MLC. Med Phys. 2012;39:6360-6371. doi: 10.1118/1.4752444
10. Snyder M, Halford R, Knill C, et al. Modeling the Agility MLC in the Monaco treatment planning system. J Appl Clin Med Phys. 2016;17:190-202. doi: 10.1120/jacmp.v17i3.6044
11. Winston KR, Lutz W. Linear accelerator as a neurosurgical tool for stereotactic radiosurgery. Neurosurgery. 1988;22: 454-464. PubMed PMID: 3129667.
12. Schmidhalter D, Fix MK, Wyss M, et al. Evaluation of a new six degrees of freedom couch for radiation therapy. Med Phys. 2013;40:111710. doi: 10.1118/1.4823789
13. Olch AJ, Gerig L, Li H, et al. Dosimetric effects caused by couch tops and immobilization devices: report of AAPM Task Group 176. Med Phys. 2014;41:061501. doi: 10.1118/1.4876299
14. Aspradakis MM, Byrne JP, Palmans H, et al. Institute of physics and engineering in medicine (IPEM) report no. 103—small field MV photon dosimetry. 2010.
Related posts:
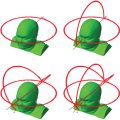
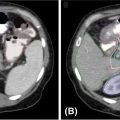
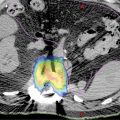
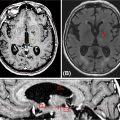

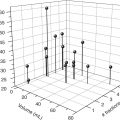
Stay updated, free articles. Join our Telegram channel

Full access? Get Clinical Tree


