Key Points
- •
Understanding ultrasound physics is essential to acquire and interpret images accurately.
- •
Higher-frequency transducers produce higher-resolution images but penetrate shallower. Lower-frequency transducers produce lower-resolution images but penetrate deeper.
- •
Basic modes of ultrasound include two-dimensional, M-mode, and Doppler.
Background
Ultrasound has been used for diagnostic purposes in medicine since the late 1940s, but the history of ultrasound physics dates back to ancient Greece. In the sixth century BC, Pythagoras described harmonics of stringed instruments, which established the unique characteristics of sound waves. By the late eighteenth century, Lazzaro Spallanzani had developed a deeper understanding of sound wave physics based on his studies of echolocation in bats. The field of ultrasonography would not have evolved without an understanding of piezoelectric properties of certain materials, as described by Pierre and Jacques Curie in 1880. Multiple other milestones, such as the invention of sonar by Fessenden and Langevin following the sinking of the Titanic and the development of radar by Watson-Watt, improved our understanding of ultrasound physics. Ultrasound use in medicine started in the late 1940s with the works of Dr. George Ludwig and Dr. John Wild in the United States and Karl Theodore Dussik in Europe.
Modern ultrasound machines still rely on the same original physical principles from centuries ago, even though advances in technology have refined devices and improved image quality. A thorough understanding of ultrasound physics is essential to capture high-quality images and interpret them correctly. This chapter broadly reviews the physics of ultrasound.
Principles
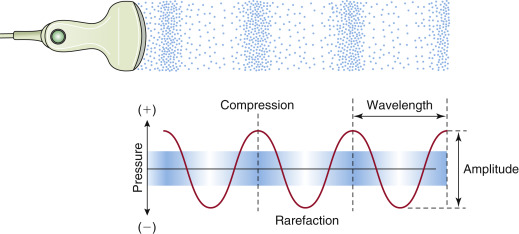
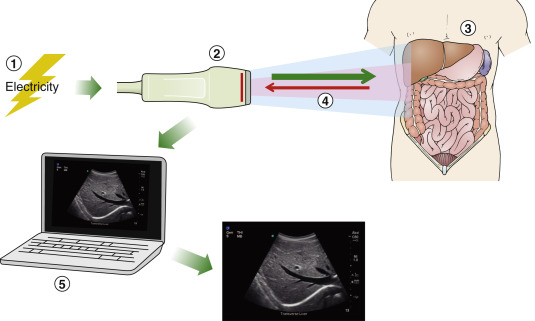
Sound waves are emitted by piezoelectric material, most often synthetic ceramic material (lead zirconate titanate [PZT]), that is contained in ultrasound transducers. When a rapidly alternating electrical voltage is applied to piezoelectric material, the material experiences corresponding oscillations in mechanical strain. As this material expands and contracts rapidly, vibrations in the adjacent material are produced and sound waves are generated. Mechanical properties of piezoelectric material determine the range of sound wave frequencies that are produced. Sound waves propagate through media by creating compressions and rarefactions of spacing between molecules ( Figure 2.1 ). This process of generating mechanical strain from the application of an electrical signal to piezoelectric material is known as the reverse piezoelectric effect . The opposite process, or generation of an electrical signal from mechanical strain of piezoelectric material, is known as the direct piezoelectric effect . Transducers produce ultrasound waves by the reverse piezoelectric effect, and reflected ultrasound waves, or echoes, are received by the same transducer and converted to an electrical signal by the direct piezoelectric effect. The electrical signal is analyzed by a processor and, based on the amplitude of the signal received, a gray-scale image is displayed on the screen. Key parameters of ultrasound waves include frequency, wavelength, velocity, power, and intensity.
Frequency and Wavelength
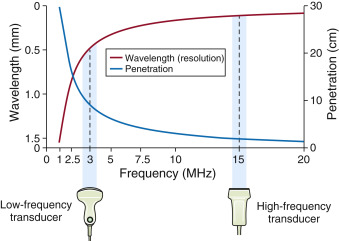
By definition, “ultrasound” refers to sound waves at a frequency above the normal human audible range (>20 kHz). Frequencies used in ultrasonography range from 2 to 18 MHz. Frequency ( f ) is inversely proportional to wavelength ( λ ) and varies according to the specific velocity of sound in a given tissue ( c ) according to the formula: λ = c / f . Two important considerations in ultrasonography are the penetration depth and resolution, or sharpness, of the image; the latter is generally measured by the wavelength used. For example, when wavelengths of 1 mm are used, the image appears blurry when examined at scales smaller than 1 mm. Ultrasound waves with shorter wavelengths have higher frequency and produce higher-resolution images, but penetrate to shallower depths. Conversely, ultrasound waves with longer wavelengths have lower frequency and produce lower-resolution images, but penetrate deeper. The relationship between frequency, resolution, and penetration for a typical biologic material is demonstrated in Figure 2.2 . Maximizing axial resolution while maintaining adequate penetration is a key consideration when choosing an appropriate transducer frequency. Higher frequencies are used in linear-array transducers to visualize superficial structures, such as vasculature and peripheral nerves. Lower frequencies are used in curvilinear and phased-array transducers to visualize deeper structures in the thorax, abdomen, and pelvis.
Power and Intensity
Average power is the total energy incident on a tissue in a specified time (W). Intensity is the concentration of power per unit area (W/cm 2 ), and intensity represents the “strength” of the sound wave. The intensity of ultrasound waves determines how much heat is generated in tissues. Heat generation is usually insignificant in diagnostic ultrasound imaging but becomes important in therapeutic ultrasound applications, such as lithotripsy (see “ Safety ”).
Resolution
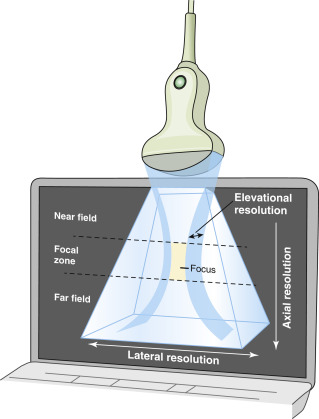
Image resolution is divided into axial, lateral, elevational, and temporal components ( Figure 2.3 ). Axial resolution is the ability to differentiate two objects along the axis of the ultrasound beam and is the vertical resolution on the screen. Axial resolution depends on transducer frequency. Higher frequencies generate images with better axial resolution, but higher frequencies have shallower penetration. Lateral resolution, or horizontal resolution, is the ability to differentiate two objects perpendicular to the ultrasound beam and is dependent on the width of the beam at a given depth. Lateral resolution can be optimized by placing the target structure in the focal zone of the ultrasound beam. The focal zone is the narrowest portion of the ultrasound beam. The ultrasound beam has a curved shape, and the focal zone is the region of highest intensity of the emitted beam. Lateral resolution decreases as deeper structures are imaged due to divergence and increased scattering of the ultrasound beam. Elevational resolution is a fixed property of the transducer that refers to the ability to resolve objects within the height, or thickness, of the ultrasound beam. The number of individual PZT crystals emitting and receiving ultrasound waves, as well as their sensitivity, affects image resolution, precision, and clarity. Temporal resolution refers to the clarity, or resolution, of moving structures. (See Chapter 3, Transducers , for additional details about image resolution.)
Generation of Ultrasound Images
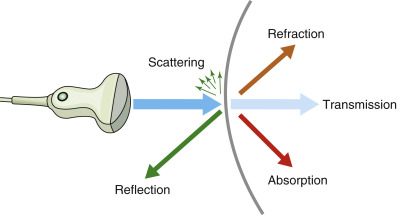
Sound waves are reflected, refracted, scattered, transmitted, and absorbed by tissues due to differences in physical properties of tissues ( Figure 2.4 ). Ultrasound images are generated by sound waves reflected and scattered back to the transducer. Transducers receive and record the intensity of returning sound waves. Specifically, mechanical deformation of the transducer’s piezoelectric material generates an electrical impulse proportional to the amplitude of these returning sound waves. Electrical impulses cumulatively generate a map of gray-scale points seen as an ultrasound image. Depth of structures along the axis of the ultrasound beam is determined by the time delay for echoes to return to the transducer. The process of emitting and receiving sound waves is repeated sequentially by the transducer, resulting in a dynamic picture ( Figure 2.5 ). Reflection and propagation of sound waves through tissues depend on two important parameters: acoustic impedance and attenuation.
Acoustic Impedance
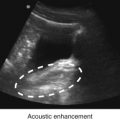
Propagation speed is the velocity of sound in tissues and varies depending on physical properties of tissues. Acoustic impedance is the resistance to propagation of sound waves through tissues and is a fixed property of tissues determined by mass density and propagation speed of sound in a specific tissue ( Table 2.1 ). Differences in acoustic impedance determine reflectivity of sound waves at tissue interfaces. Greater differences in acoustic impedance lead to greater reflection of sound waves. For example, sound waves reflect in all directions, or scatter, at air-tissue interfaces due to a large difference in acoustic impedance between air and bodily tissues. Scattering of sound waves at air-tissue interfaces explains why sufficient gel is needed between the transducer and skin to facilitate propagation of ultrasound waves into the body. Ultrasound machines are calibrated to rely on small differences in impedance because only 1% of sounds waves are reflected back to the transducer. The majority of sound waves (99%) do not return to the transducer.
| Tissue or Material | Density (g/cm 3 ) | Speed of Sound (m/s) | Acoustic Impedance (kg/(s m 2 )) × 10 6 |
|---|---|---|---|
| Air | 0.001225 | 340 | 0.0004 |
| Fat | 0.95 | 1450 | 1.38 |
| Blood | 1.055 | 1575 | 1.66 |
| Liver | 1.06 | 1590 | 1.69 |
| Bone | 1.9 | 4080 | 7.75 |
| Metal (e.g., titanium) | 4.5 | 5090 | 22.9 |
Related posts:
Stay updated, free articles. Join our Telegram channel

Full access? Get Clinical Tree


