Abstract
Objective
To develop and validate an automated deep learning-based model for focal liver lesion (FLL) segmentation in a dynamic contrast-enhanced ultrasound (CEUS) video.
Methods
In this multi-center and retrospective study, patients with FLL who underwent dynamic CEUS exam were included from September 2021 to December 2021 (model development and internal test sets), and from March 2023 to May 2023 (external test sets). A bi-modal temporal segmentation network (BTS-Net) was developed and its performance was evaluated using Dice score, intersection over union (IoU) and Hausdorff distance, and compared against several segmentation methods. Time-intensity curves (TICs) were obtained automatically from BTS-Net and manually de-lineated by an experienced radiologist, and evaluated by intra-class correlation and Pearson correlation co-efficients. Multiple characteristics were analyzed to evaluate the influencing factors of BTS-Net.
Results
A total of 232 patients (160 men, median age 56 y) with single FLL were enrolled. BTS-Net achieved mean Dice scores of 0.78, 0.74 and 0.80, mean IoUs of 0.67, 0.62 and 0.68, and mean Hausdorff distances of 15.83, 16.01 and 15.04 in the internal test set and two external test sets, respectively. The mean intra-class correlation and Pearson correlation co-efficients of TIC were 0.89, 0.92 and 0.98, and 0.91, 0.93 and 0.99, respectively. BTS-Net demonstrated a significantly higher mean Dice score and IoU in large (0.82, 0.72), homogeneous positive enhanced (0.81, 0.70) or stable (0.81, 0.70) lesions in pooled test sets.
Conclusion
Our study proposed BTS-Net for automated FLL segmentation of dynamic CEUS video, achieving favorable performance in the test sets. Downstream TIC generation based on BTS-Net performed well, demonstrating its potential as an effective segmentation tool in clinical practice.
Introduction
Contrast-enhanced ultrasound (CEUS) is one of the new techniques of ultrasound (US) and is recommended for newly detected focal liver lesions (FLLs) [ , ]. FLLs, in particular hepatocellular carcinoma, display specific enhanced patterns during CEUS [ ]. Thus, CEUS can serve as a reliable screening method during hepatocellular carcinoma surveillance in high-risk patients [ ]. The sonologist follows a fixed region containing the target lesion over the CEUS examination process and studies the enhanced pattern of each lesion, thus making a diagnosis. However, CEUS interpretation strongly relies on sonologist experience [ ], making it difficult to apply manual analysis of real-time CEUS on a large scale.
Time-intensity curves (TICs) and deep learning techniques can aid in the diagnosis of FLLs by providing semi-quantitative parameters or identifying additional image features [ , ]. Effective segmentation of the target lesion is a pre-requisite for both TIC plotting and image analysis by deep learning techniques. Manual image segmentation frame by frame varies by sonologist and is also time-consuming and labor-intensive. Thus, it is essential to automatically segment FLLs in a dynamic CEUS video.
Several methods have been developed that use time series information for CEUS segmentation tasks, such as DpRAN for thyroid nodule [ ], CEUSegNet for metastasis cervical lymph node and breast lesion [ ], and a U-Net model for pancreatic tumor [ ]. Although artificial intelligence (AI) algorithms have been designed for liver lesion segmentation based on B-mode US imaging [ ], a few studies have focused on CEUS image sequences for FLL segmentation [ , ]. Different from B-mode US, dynamic CEUS examination usually requires several minutes [ ], during which time the dynamic CEUS image will change considerably temporally with contrast agent perfusion, while it will be displaced spatially with respiratory motion ( Supplementary Material 1 ). All of these challenges make it extremely difficult to automatically segment liver lesions in a dynamic CEUS video. Herein, we developed and validated an automated deep learning-based model (bi-modal temporal segmentation network [BTS-Net]) for FLL segmentation with dynamic CEUS video.
Materials and methods
Participants
This was a multicenter, retrospective study. Data were collected from September to December 2021 from the First Affiliated Hospital of Sun Yat-sen University (Guangzhou, China), and from March to May 2023 from the Sixth Affiliated Hospital of Sun Yat-sen University (Guangzhou, China) and SanMing First Hospital (Sanming, China). All included patients underwent real-time dual-screen visualization with both B-mode and CEUS images for FLLs. Key exclusion criteria included: (i) multiple lesions in the same section during CEUS; (ii) lesions with a maximum diameter less than 1 cm or larger than 5 cm; and (iii) lesions not able to be clearly identified in either B-mode or contrast-enhanced images.
This study was approved by the institutional review board of the First Affiliated Hospital of Sun Yat-sen University.
CEUS examinations were performed using an Aplio i900 TUS-AI900 (Canon Medical Systems, Tochigi, Japan) equipped with a i8CX1 transducer at the First Affiliated Hospital of Sun Yat-sen University, a Resona R9 (Mindray Healthcare and Medical Technology, Shenzhen, China) equipped with a SC6-1U transducer at the Six Affiliated Hospital of Sun Yat-sen University and an Acuson Sequoia (Siemens Healthcare, Erlangen, Germany) equipped with a 5C1 transducer at SanMing First Hospital. All CEUS examinations were performed according to standard protocols ( Supplementary Material 2 ) and all sonologists had at least 5 y of experience with CEUS examinations. CEUS data were exported in digital imaging and communications in medicine (DICOM) format. The CEUS clips and their corresponding B-mode US clips were first re-arranged into image pairs. A pre-defined region of interest was utilized to crop the images, eliminating extraneous information. All clips were then reviewed by a radiologist (Y.D.) with at least 5 y of experience in the evaluation of liver CEUS images, and the FLLs were manually de-lineated with every third frame as the ground truth of lesion segmentation using the Microport Prohecy ( https://ai-data.microport.com.cn ) annotation platform. The de-lineated lesions were re-evaluated by another radiologist (M.X.L.) with at least 10 y of experience in the evaluation of CEUS images. In case of disagreement, a third radiologist (X.Y.X.) with at least 15 y of experience in liver CEUS made the final decision.
BTS-Net architecture
BTS-Net was designed by extending and adapting the Atkinson-Shiffrin memory model (XMem) [ ] for a multi-modal purpose. This proposed model took a series of image pairs, composed of CEUS scans and B-mode scans, as input and output of the predicted lesion masks. The architecture of this proposed model is shown in Figure 1 .

The model consisted of three main modules, comprising the bi-modal swin transformer encoder, the bi-modal XMem module and the bi-modal decoder. The bi-modal swin transformer encoder included two key encoders and one value encoder to effectively capture features from two different image modalities, CEUS and B-mode scans. The key encoders were implemented using swin transformers [ ] with two separate branches: one branch for the CEUS scan frames and the other for B-mode scan frames. Each swin transformer key encoder retained only the first three stages, preserving multi-scale features at 1/4, 1/8 and 1/16 of the original input resolution. The value encoder used was a ResNet-18 [ ], which extracted features at a 1/16 scale of the input resolution, complementing the key encoders. To merge bi-modal information, the feature maps from both key encoders were averaged at each stage, providing a comprehensive representation of target and location information for both modalities. Following the hyper-parameter settings from XMem [ ], the channel dimension for the key was set to 64, the value channel to 512 and the hidden state channel to 64.
The bi-modal XMem module integrates bi-modal image pairs and includes the predicted lesion mask from the previous time point, as well as the fused bi-modal feature maps from the bi-modal swin transformer encoder. This module leverages a memory structure inspired by XMem, which includes sensory memory, working memory and long-term memory, enabling the model to store diverse temporal contextual features. For sequential frames in the same video, where the shape and position of FLLs change continuously, the prior predicted mask and extracted feature information from previous frames enhance segmentation performance for subsequent frames. The XMem module has been adapted to handle bi-modal input by re-arranging channels: red, green and blue channels correspond to the CEUS scan, B-mode scan and a fused sum of the two, respectively, rather than extending the module into separate branches for each modality.
The outputs from the bi-modal swin transformer encoder and the bi-modal XMem module, together with the hidden representation from the previous time point, form the input to the bi-modal decoder. The decoder concatenates the retrieved memory of hidden state and feature, then iteratively up-samples by integrating skip connections from the query encoder at each level, according to the structure of space-time memory networks [ ]. This process enables the decoder to refine and segment the lesion mask accurately for the current image pairs by fusing the extracted bi-modal features and processing them as hidden representations, ultimately generating a high-resolution segmentation mask.
Detailed training equipment and parameters are presented in Supplementary Material 3 and implementation details are at https://github.com/Stoney-S/bts_ceus .
Stratified analysis: characters and definition
Multiple CEUS characteristics of FLLs were analyzed in a pooled test set to find the influence factors of model performance: (i) lesion diameter, classified into “small” and “large” lesions; (ii) lesion position, grouped into “poor” and “good” positions; (iii) enhanced pattern, grouped into homogeneous positive enhancement, heterogenous positive enhancement and negative enhancement; (iv) respiratory amplitude, defined as “heavy breathing” or “smooth breathing”; (v) lesion stability, defined as “unstable” or “stable”. Detailed definitions of CEUS characteristics are described in Supplementary Material 4 .
Comparative analysis
To provide a comprehensive evaluation, the performance of BTS-Net was compared against several segmentation methods. U-Net [ ] and Swin-Unet [ ] adapted for dual-modality inputs with CEUS and B-mode images were included to establish a benchmark for dual-modality segmentation. Additionally, single-modality variants of BTS-Net were also included, namely BTS-Net (CEUS), trained using only the CEUS modality, and BTS-Net (B-mode), trained using only the B-mode modality.
Performance evaluation metrics
Dice score, intersection over union (IoU) and Hausdorff distance were used to evaluate the segmentation performance of the proposed method. The equations of these metrics are described in Supplementary Material 5 .
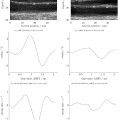
FLLs in dynamic CEUS videos were manually de-lineated by an experienced radiologist as label mask and automatically segmented by BTS-Net as predicted mask. Mean intensity pertains to computation of the average pixel value (0–255) within the label or predicted mask. The frame index refers to the sequential identifier assigned to a specific frame within the video under analysis. Graph lines were plotted with mean intensity as the vertical axis and temporal frame index as the horizontal axis, and then smoothed using a Kalman filter to form TICs. TICs were obtained from label masks (TIC manual ) and predicted masks (TIC auto ), respectively. One-way intra-class correlation co-efficient (ICC) and Pearson’s correlation co-efficient (PCC) were utilized to gauge the reliability and consistency of TIC auto and TIC manual .
Categorical variables were summarized using frequencies and percentages, while continuous variables were summarized using means and standard deviations (SDs). Student’s t -test or analysis of variance was used to compare differences in model performance metrics in the sub-group analysis. All analyses were performed using R version 4.2.3 software.
Results
Baseline characteristics
The demographic and clinical characteristics of the 232 enrolled patients (160 men, median age: 56 y) are listed in Table 1 . The lesions were studied, including 189 lesions from our institution as model development and internal test sets, and 28 and 15 lesions from other two institutions as external test sets A and B, respectively. The 189 lesions were randomly divided into development (n = 141) and internal test sets (n = 48).
| Feature | All (n = 232) | Training and validation (n = 141) | Internal test (n = 48) | External test A (n = 28) | External test B (n = 15) |
|---|---|---|---|---|---|
| Age, y | 56 (46, 66) | 56 (46, 66) | 56 (46, 66) | 54.5 (48, 61) | 58 (54, 67) |
| Sex, n (%) | |||||
| Female | 72 (31) | 40 (28) | 20 (42) | 7 (25) | 5 (33) |
| Male | 160 (69) | 101 (72) | 28 (58) | 21 (75) | 10 (67) |
| Hepatic fibrosis or cirrhosis, n (%) | |||||
| With | 113 (48) | 64 (45) | 29 (60) | 12 (43) | 8 (53) |
| Without | 119 (52) | 77 (55) | 19 (40) | 16 (57) | 7 (47) |
| Lesion diameter, mm | 26 (17, 34) | 22 (16, 35) | 29.5 (19, 39) | 23 (14, 30) | 30 (22, 34) |
| Lesion position, n (%) | |||||
| Poor | 73 (31) | 44 (31) | 17 (35) | 9 (32) | 3 (20) |
| Good | 159 (69) | 97 (69) | 31 (65) | 19 (68) | 12 (80) |
| Enhanced pattern, n (%) | |||||
| Homogeneous positive enhancement | 123 (53) | 86 (61) | 19 (40) | 9 (32) | 9 (60) |
| Negative enhancement | 41 (18) | 19 (13) | 14 (29) | 8 (29) | 0 (0) |
| Heterogeneous positive enhancement | 68 (29) | 36 (26) | 15 (31) | 11 (39) | 6 (40) |
| Respiratory amplitude, n (%) | |||||
| Heavy breathing | 50 (22) | 22 (16) | 15 (31) | 9 (32) | 4 (27) |
| Smooth breathing | 182 (78) | 119 (84) | 33 (69) | 19 (68) | 11 (73) |
| Lesion stability, n (%) | |||||
| Stable | 166 (72) | 110 (78) | 29 (60) | 15 (54) | 12 (80) |
| Unstable | 66 (28) | 31 (22) | 19 (40) | 13 (46) | 3 (20) |
Segmentation performance of BTS-Net
Segmentation performance was evaluated in terms of Dice score, IoU and Hausdorff distance, and summarized in Table 2 . In the internal test set, the mean (± SD) Dice score, IoU and Hausdorff distance were 0.78 ± 0.11, 0.67 ± 0.12 and 15.3 ± 6.95, respectively. In external test sets A and B, the mean (± SD) Dice scores were 0.74 ± 0.11 and 0.80 ± 0.10, IoUs were 0.62 ± 0.13 and 0.68 ± 0.13, and Hausdorff distances were 16.01 ± 8.92 and 15.04 ± 9.24, respectively. Column bar graphs depicting the distribution of Dice score, IoU and Hausdorff distance for the three test sets are shown in Figure 2 .
Related posts:
 Sonosensitizers for Sonodynamic Therapy: Current Progress and Future Perspectives
 Quantitative Analysis of Contrast-Enhanced Ultrasound Images of Brain-Dead Donor Livers: Prediction of Early Allograft Dysfunction
 Safety of Shear Wave Elastography as Evidenced From Carotid Artery Strain and Strain Rate Induced by Acoustic Radiation Force Impulse and Arterial Pulsations
 SegFormer3D: Improving the Robustness of Deep Learning Model-Based Image Segmentation in Ultrasound Volumes of the Pediatric Hip
 Low-Intensity Ultrasound Facilitation of Intranasal Drug Delivery to Olfactory Bulb and Trigeminal Nerves
 Ocular Ultrasound
Stay updated, free articles. Join our Telegram channel

Full access? Get Clinical Tree


