ABSTRACT
Objective
This work aimed to promote the interaction of a modified gas vesicle (GV) with cathepsin B (CTSB) protease and analysed their backscattered signal by ultrasound (US).
Methods
We modified the sequence of the gene coding for GvpC to contain a CTSB cleavage and expressed the protein in an Escherichia coli recombinant system. The protein was purified and added to GVs preparations in which the original GvpC was removed (ΔGV), constituting the modified GV (GV*). Western blot testing was used to compare GVs with GvpC and engineered GvpC at starting (T0) and after 24 h (T24) reacting with CTSB. A 21 MHz US B-mode and non-linear contrast mode (5% total power) imaged US phantoms having samples of GVwt, ΔGV (stripped GV), GV* and CTSB + GV*. Also, a 21 MHz US B-mode imaged US phantoms having a tumour cell line extracellular fraction (TCEF) and the TCEF + GV* sample. A 100% total US power was applied to collapse the GV structure.
Results
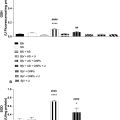
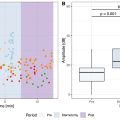
On Western blotting, we detected a decrease in engineered GvpC levels 24 h after the incubation of GV* with CTSB, compared with the concentration at T0, suggesting that CTSB cleaved the engineered GvpC. Regions-of-interest over image of phantom cross-sections were determined and the B-mode image mean grey-level intensity resulted in a significant ( p < 0.05) increase comparing CTSB + GV* with PBS (control), GVwt, ΔGV and GV*. Non-linear mode image grey-level intensity from CTSB + GV* increased by 11.79, 7.86 and 14.75 dB from samples containing GVwt, ΔGV and GV*, respectively. GV preparations incubated with TCEF and the TCEF + GV* sample showed an increase of 81% in signal compared with TCEF + GVwt.
Conclusion
The increased US backscattered signal intensity suggests GVs as a potential biosensor for protease activity, possibly aiding the detection of protease-rich tissue regions.
Introduction
Molecular imaging is the field of biomedical research devoted to the inspection and characterization of biological processes at the molecular and cellular levels. It has the ability to offer insights into the structure, function and interactions of molecules and cells within living organisms [ ]. Among the various molecular imaging modalities, ultrasound biomicroscopy (UBM) stands out as a potential ultrasound (US) imaging method. It typically operates utilizing high-frequency US waves (>20 MHz) to enhance the spatial resolution of the image [ , ] and offers several advantages, including low cost, real-time imaging, portability and non-ionizing radiation emission [ ]. UBM applications include the imaging of submillimetre tissue anatomical sites such as blood vessel walls, skin layers, tumours and structures of the eye anterior segments [ ]. Furthermore, UBM is used highly in preclinical research, based on small animal (rat or mouse) disease models, as an imaging tool to visualize tissue and organ structures, to determine blood flow dynamics and to inspect molecular biomarkers specific of some diseases [ ].
UBM can also be associated with US contrast agents (UCAs) to enhance image contrast quality with microbubbles being currently the most widely used commercial contrast agents for US imaging [ , ]. Microbubbles, with a typical diameter between 2 and 10 μm, are encapsulated with a protein, lipid or polymeric coating and contain an internalized inert gas [ ]. The dimensions of microbubbles, which are comparable with those of red blood cells, allow them to circulate throughout the entire network of blood vessels without forming aggregates, thereby eliminating the possibility of an embolism. The size of the microbubbles confines them to the blood vessels. Yet, in a tumour environment where the blood vessels have enlarged endothelial pores, structures up to 0.8 µm in size can pass through the vessel walls. However, owing to their size, microbubbles are still incapable of crossing the endothelial barrier [ , ].
In 2014, Shapiro et al. [ ] introduced gas vesicles (GVs) as biomolecules that respond to acoustic excitations, offering an alternative to UCAs. They demonstrated the US backscatter capability of GVs produced by micro-organisms, such as Halobacterium salinarum NRC-1 and Anabaena flos-aquae (ANA), which use GVs to regulate their buoyancy in the water [ ]. GVs, which have a composition akin to protein microbubbles, are made up of a protein shell that encapsulates and maintains air within. They exhibit a diameter that varies from 0.045 to 0.25 μm and a length that spans from 0.1 to 0.8 μm [ ]. The major proteins constituting the GVs shell are GvpA, a small hydrophobic protein (7–8 kDa) that forms the main structure, and GvpC, a larger (approximately 20 kDa) hydrophilic protein that stabilizes the structure [ ].
Lakshmanan et al. [ ] demonstrated that engineered versions of GV proteins can be expressed in recombinant ( E. coli ) systems to produce modified GVs (GVs*). In particular, the GvpC protein can be engineered to be able to interact with specific proteases, by inserting a cleavage amino acid sequence into the corresponding gvpC DNA sequence. The strategy of exploring the interaction of GVs with proteases may prove important for molecular imaging, particularly when the protease is cathepsin B (CTSB), which is overexpressed in the several tumours, such as colon, prostate and breast [ ]. CTSB, which is involved in the degradation and remodelling of protein structures, plays an important role in the extracellular space of the tumour environment, contributing to growth and invasion by degrading extracellular matrix components [ ].
These characteristics make CTSB an important target for tumour diagnosis and treatment. In this context, this research work aimed to produce bioengineered GVs, obtained originally from ANA, to interact with the CTSB, and detect the in vitro extracellular interaction between CTSB and GVs by means of molecular imaging using US BMU and non-linear contrast (NC) mode, thus presenting a technique that may allow for future advances in detailing the tumour development process in small animals.
Materials and methods
Production of a CTSB-sensitive bioengineered GV nanosystem
A diagram of the strategy used to modify native GVs from ANA into CTSB-sensitive GVs is depicted in Figure 1 , followed by a description of the main steps.

Obtaining, purifying and quantifying GVs
Initially, the GVs were collected from ANA cultures, obtained from Culture Collection of Algae and Protozoa, Scottish Marine Institute, cat. no. Culture Collection of Algae and Protozoa 1403/13F, following the Lakshmanan et al. (2017) protocol [ ]. Briefly, ANA is a well-established organism used for production of purified GVs [ , ]. ANA cells were cultured in BG-11 medium (Sigma Aldrich, St. Louis, MO), under a 12 h light–dark cycle, 100 μM photons (m-2 s-1), for 2 weeks.
The next step involved transferring the culture to a separating funnel, where cells were let to sit for 1–2 days, which allowed buoyant cells to rise to the top of the liquid. Cells were collected from the superficial layer and treated with a lysis solution (0.5% Tween, 500 mmol/L sorbitol, 10 mmol/L Tris pH 7.5) in a 1:1 ratio for 2 h at 4°C to release the GVs. Finally, GVs were retrieved by centrifugation of the lysed sample (200 g, 24 h, 4°C). The subnatant was removed and the remaining volume was suspended in phosphate-buffered saline (PBS). This process was repeated three times, and the final sample was stored at 4°C. GVs concentration was determined by measuring the suspension optical density (OD), at 500 nm (OD500), using a Synergy H4 hybrid microplate reader (Agilent Biotek, Santa Clara, CA).
GvpC engineering and purification of recombinant GvpC
The modification of the ANA GvpC protein-coding sequence was performed using the plasmid WT C-His ANA GvpC pET28a (Addgene, Watertown, MA), developed to express ANA GvpC in E. coli [ , ]. To obtain a GvpC able to interact with the CTSB protease, a five-codon sequence corresponding to the amino acid sequence Gly–Leu–Phe–Gly–Lys (cathepsin cleavage site) [ ] was added in the gvpC gene at a location corresponding with the GvpC second repeat [ , , ]. The synthetic version of the gene including this modification was constructed by the company GenOne Biotech (Rio do Janeiro, RJ, Brazil).
To obtain the recombinant proteins, the same procedure was performed for the native ANA GvpC and the engineered ANA GvpC, each produced from their respective vectors. The plasmids were transformed into competent E. coli BL21(DE3) cells (Invitrogen, Waltham, MA) by electroporation. Clones were selected from colonies grown on Luria Broth agar plates with 50 μg mL −1 of kanamycin, after incubation at 37°C for 18 h. Thereafter, cultures started inoculating one colony in 2 mL of Luria Broth medium (50 μg·mL −1 of kanamycin) and incubating overnight at 200 rpm at 30°C. To obtain a culture in the exponential growth phase, the overnight culture was diluted 1:75 in 50 mL of Luria Broth (50 μ·gmL −1 kanamycin) and grown during 3 h at 200 rpm at 30°C or until the OD600 reached 0.4–0.6. Protein expression was induced by adding 400 μM of isopropyl-ß-D-thiogalactopyranoside to the culture and incubating for 12 h at 200 rpm at 30°C. Cells were collected by centrifugation (15,000 g × 10 min, 4°C). The cell pellet was resuspended in 4 mL solulyse with 4 μL DNase I (10 μg·mL −1 ), kept on ice for 10 min and centrifuged (15,000 g , 15 min, 4°C). The cell pellet was resuspended in 4 mL solulyse with 40 μL lysozyme (0.25 mg·mL −1 ), kept on ice for 10 min and centrifuged as before. The final pellet was resuspended in a solubilization buffer (20 mmol/L Tris-HCl, 500 mmol/L NaCl, 6 mol/L urea, pH 8.0) and centrifuged (20,000 g , 20 min, 4°C). The supernatant was added to Ni-NTA resin (QIAGEN, Germantown, MD) and incubated for 1 h, 30 rpm, 4°C. The resin was placed in a column and washed with solubilization buffer with 20 mmol/L imidazole. The recombinant protein was eluted by adding solubilization buffer with 250 mmol/L imidazole. The purification of GvpC was confirmed by SDS-polyacrylamide gel electrophoresis (PAGE) analysis.
Protein concentrations were measured using the Synergy H4 hybrid microplate reader (Agilent Biotek), corresponding with 0.5 and 0.6 mg·mL −1 of ANA GvpC and engineered ANA GvpC, respectively.
GV modification to incorporate the engineered GvpC
ANA GV (GVwt) was obtained as described previously. To remove the original GvpC ( Fig. 1 c), a GVwt preparation (OD500 = 10) was treated with 6 mol/L urea in 100 mmol/L Tris-HCl (pH 8.0) [ , ]. This included three rounds, each one consisting of an agitation step (50 rpm) during 1 h at 4°C, followed by centrifugation (200 g , 24 h, 4°C). The supernatant was removed at the end of the first two rounds, and a 6 mol/L urea solution was added to the remaining GV fraction. Thereafter, PBS was added to the GV fraction. The resulting GV preparation, from which GvpC was removed, was named ΔGV and was stored at 4°C.
The obtained GV*, the ΔGV preparation was incubated with purified recombinant GvpC: either ANA GvpC (wt) or the engineered ANA GvpC. The re-addition process consisted of three sequential dialysis steps, against 6 mol/L urea, 3 mol/L urea, and PBS, each for 24 h at 4°C, to gradually refold the protein onto the surface of the stripped GVs. The proteins were maintained in a dialysis tube with a 6–8 kDa molecular weight cutoff. The amount of GVs and GvpC used was based on the work of Lakshmanan et al. (2017) [ ]. Briefly, the amount of engineered GvpC (in nanomoles) to be added to stripped GVs was calculated as 2 x OD (GV) × 198 nm × volume of GVs (in litres) according to a 1:25 binding ratio of GvpC:GvpA. In this case, the GvpC protein was used at a final concentration of 0.45 mg·mL −1 in a volume of 4 mL of ΔGV at an OD500 of 4. After the final dialysis step, samples were centrifuged (200 g , 4 h, 4°C) to reduce the concentration of unbounded GvpC, and the GVs were then stored at 4°C. The preparations of ΔGV that received either the ANA GvpCwt or the engineered ANA GvpC, are herein referred to as GVwt* and GV*, respectively. The ΔGV, GVwt* and GV* concentrations were determined by OD500 using a Synergy H4 (Agilent Biotek).
Detection of GvpC in GVwt, ΔGV and GV* samples
The presence of GvpC in GV preparations was analysed by SDS-PAGE (10%–15%). Samples of GVwt, ΔGV and GV* ( n = 3 each) with an OD500 of 2, were mixed 1:1 with 2× Laemmli sample buffer (Bio-Rad, Hercules, CA), incubated at 95°C for 5 min and loaded into a pre-made polyacrylamide gel (Bio-Rad). Electrophoresis was performed at 100 V for 90 min. The gel was stained for 1 h with Coomassie Brilliant Blue and de-stained with 50% methanol and 10% acetic acid in water in a shaker. The gel was visualized in a ChemiDoc Gel Imaging System (Bio-Rad) and the image scanned. The scanned images were processed using ImageJ software (Version 1.53t, Bethesda MD), to increase band contrast.
CTSB reaction with GV* in vitro
CTSB reaction in solution
To analyse the GV* interaction with CTSB, an in vitro reaction was performed using human CTSB (SRP0289; Sigma Aldrich). Initially, 10 μL of CTSB (0.1 μg·mL −1 ) was diluted in 490 μL PBS (pH 6.0) and incubated at 37°C, 200 rpm for 15 min, to stabilize the enzyme. The concentration of CTSB was based on prior studies and had the intention of reproducing the concentration found in tumours [ , , , , , , ]. An aliquot (500 μL) of the GV* preparation (OD500 = 2) was added and mixed. An initial sample (100 μL) was immediately removed (instant T0) and stored at 4°C. After 24 h (T24) of incubation at 37°C, 200 rpm, another sample was obtained and stored at 4°C. The duration of the reaction (24 h) was set to enhance the interaction between GVs and CTSB. The same procedure was carried out for GVwt*, to act as a negative control for CTSB cleavage. Three replicates ( n = 3) were included in each CTSB reaction with the GV samples: GVwt* and GV*.
GV* incubation with the extracellular fraction of a culture of colon tumour cells
A preparation of GV* was incubated with the extracellular fraction retrieved from a colon tumour cell culture known for producing CTSB. Human HCT 116 cell line (91091005; Sigma Aldrich) was cultured in DMEM high glucose medium (12800017, Thermo Fisher Scientific, Waltham, MA), enriched with 10% foetal bovine serum (F2442 Sigma Aldrich) and 1% penicillin-streptomycin (15070063, Thermo Fisher Scientific). The cells were maintained in culture for 48 h until they achieved 90% confluence in a T-75 flask [ ]. At this point, the culture medium was pipetted and used as the tumour cell line extracellular fraction (TCEF).
TCEF (500 μL) was mixed with GV* (500 μL) and incubated for 24 h at 37°C, constituting of (TCEF + GV*). A similar procedure was followed for GVwt (resulting in TCEF + GVwt). In each case, six replicates were included for the reactions with TCEF ( n = 6).
Detection of CTSB reaction with GV*
After incubation of GVwt* or GV* with CTSB, the products were analysed through the Western blot (WB) using an antibody with C-His as a target. Protein samples were separated on SDS-PAGE, the gel was placed in the Trans-blot Turbo Transfer System cassette and transferred to a nitrocellulose membrane (Bio-Rad) and at 2.5 A during 10 min. The membrane was blocked with 10 mL of 5% milk powder in a shaker at room temperature for 1 h. Then, the membrane was incubated with the primary antibody (mouse) anti-His-TAG (Sigma Aldrich) in 5 mL of 3% milk powder at 4°C, overnight. After washing three times with ultrapure water, the secondary antibody (anti-mouse) (Sigma Aldrich) was added into 5 mL of 3% milk powder and incubated for 1–2 h at 4°C. Signals were detected after addition of mixed Clarity Max Substrate Kit components (Bio-Rad) in a 1:1 ratio and incubation for 5 min. The chemiluminescent signals on the blot were visualized in a (Bio-Rad). The scanned images were processed using ImageJ software (Version 1.53t), with regions of interest (ROIs) drawn over each band and the signal intensity for each ROI determined.
UBM image acquisition
An US phantom containing GV samples was inspected with an UBM image system (Vevo 2100; VisualSonics, Toronto, Ontario Canada) operating in either B-mode or NC mode imaging, using a 21 MHz transducer (MS-250; VisualSonics). The power of the US signal transmission was set to either 5%, to avoid GV collapse, or 100%, to promote the GV irreversible collapse.
The phantom ( Fig. 2 a ) was made with a mixture of agarose (2%, v/v) in PBS and contained 10 cylindrical wells (diameter of 4.0 mm and height of 20 mm), which were filled separately with either PBS ( n = 4), representing the negative control, or GV samples ( n = 6) at a final OD500 of 2. This phantom system assists in examining the backscattered signal from GVs; we did not perform tissue attenuation testing. Immediately after filling the wells, a layer of agarose (2%, v/v) in PBS was added to the top of the phantom to seal the wells and, therefore, maintain the PBS and GV solutions stocked in their respective wells ( Fig. 2 a).

Related posts:
 Strain Patterns With Ultrasound for Assessment of Abdominal Aortic Aneurysm Vessel Wall Biomechanics
 Contrast-Enhanced Ultrasound of Mouse Models of Hindlimb Ischemia Reveals Persistent Perfusion Deficits and Distinctive Muscle Perfusion Patterns
 Classification of Neoadjuvant Therapy Response in Patients With Colorectal Liver Metastases Using Contrast-Enhanced Ultrasound—With Histological Pathology as the Gold Standard
 Attenuation Measuring Ultrasound Shearwave Elastography (AMUSE) as Noninvasive Imaging Biomarker for Liver Acute Cellular Rejection
 Ultrasound and Gold Nanoparticles Improve Tissue Repair for Muscle Injury Caused by Snake Venom
 Perioperative Detection of Cerebral Fat Emboli From Bone Using High-Frequency Doppler Ultrasound
Stay updated, free articles. Join our Telegram channel

Full access? Get Clinical Tree


