Abstract
Objective
This study explored a new method for automatic O-RADS classification of sonograms based on a deep convolutional neural network (DCNN).
Methods
A development dataset (DD) of 2,455 2D grayscale sonograms of 870 ovarian adnexal lesions and an intertemporal validation dataset (IVD) of 426 sonograms of 280 lesions were collected and classified according to O-RADS v2022 (categories 2–5) by three senior sonographers. Classification results verified by a two-tailed z-test to be consistent with the O-RADS v2022 malignancy rate indicated the diagnostic performance was comparable to that of a previous study and were used for training; otherwise, the classification was repeated by two different sonographers. The DD was used to develop three DCNN models (ResNet34, DenseNet121, and ConvNeXt-Tiny) that employed transfer learning techniques. Model performance was assessed for accuracy, precision, and F1 score, among others. The optimal model was selected and validated over time using the IVD and to analyze whether the efficiency of O-RADS classification was improved with the assistance of this model for three sonographers with different years of experience.
Results
The proportion of malignant tumors in the DD and IVD in each O-RADS-defined risk category was verified using a two-tailed z-test. Malignant lesions (O-RADS categories 4 and 5) were diagnosed in the DD and IVD with sensitivities of 0.949 and 0.962 and specificities of 0.892 and 0.842, respectively. ResNet34, DenseNet121, and ConvNeXt-Tiny had overall accuracies of 0.737, 0.752, and 0.878, respectively, for sonogram prediction in the DD. The ConvNeXt-Tiny model’s accuracy for sonogram prediction in the IVD was 0.859, with no significant difference between test sets. The modeling aid significantly reduced O-RADS classification time for three sonographers (Cohen’s d = 5.75).
Conclusion
ConvNeXt-Tiny showed robust and stable performance in classifying O-RADS 2–5, improving sonologists’ classification efficacy.
Introduction
The prevalence of ovarian adnexal lesions is considerable. Up to 324,398 new cases of ovarian cancer were diagnosed globally in 2022 [ ], representing about 30% of all ovarian adnexal lesions [ , ]. Compared with MRI and CT, ultrasound is the most useful noninvasive tool for diagnosing ovarian adnexal lesions because of its low cost, general safety, ease of access, and lack of specific contraindications [ ].
However, there are notable discrepancies in the proficiency and expertise of medical practitioners when interpreting sonograms [ ]. To ensure uniformity in the interpretation of sonographic reports, enhance the accuracy of malignancy risk assessment, and provide clear management recommendations for different risk levels, the Ovarian-Adnexal Imaging-Reporting-Data System (O-RADS) classification system was introduced in 2019 [ ]. While the O-RADS diagnostic performance is comparable to that of the International Ovarian Tumor Analysis Simple Rules (IOTA SR) and ADNEX models [ ], it is the only system that provides comprehensive risk classification and management guidelines. O-RADS has been validated by extensive studies to provide the expected risk stratification for malignant lesions, with high sensitivity and moderate specificity when categories 4 and 5 are used as predictive criteria [ ]. An update will be implemented in 2022 (O-RADS v2022) to enhance system specificity [ ]. However, some issues remain. In the practical application of O-RADS, doctors must invest considerable time and effort to comprehensively analyze complex sonographic features of the lesions for accurate classification, and junior ultrasonographers are typically required to undergo specialized training before applying O-RADS [ , ]. This has reduced the acceptance of O-RADS to a certain extent. Therefore, this study aimed to explore a new method to easily and efficiently use O-RADS to increase its popularity and effectiveness.
Recently, deep learning methods have been extensively employed in medical image processing [ ], among which the deep convolutional neural network (DCNN) model is a significant branch. The roles of DCNN in medical ultrasound image-assisted diagnosis has been extensively validated in several studies, including qualitative analysis of liver disease [ , ], precise differentiation of benign and malignant thyroid and breast nodules [ ], and effective differentiation between benign and malignant lymph nodes [ , ]. Some scholars, such as Gao et al., used DCNN to differentiate benign and malignant ovarian lesions on sonograms [ ]. Wu et al. also utilized DCNN to classify ovarian lesions in ultrasound images according to multiple histological types [ ]. However, DCNN has not yet been applied to automatic classification with O-RADS. This study addresses the existing gap in this field and provides a novel strategy to enhance the efficiency of O-RADS classification of ovarian adnexal lesions on sonograms to improve the popularity and application of this system.
Methods
Data collection
Two datasets were retrospectively collected in this study. The developmental dataset (DD) included data from patients who underwent surgery for ovarian adnexal lesions with preoperative transvaginal ultrasonography (transabdominal ultrasonography may be considered for women with large masses or no sexual experience) at the Fourth Affiliated Hospital of Harbin Medical University from August 2017 to October 2021 and who had obtained definitive histopathological results of postoperative ovarian adnexal lesions. For the intertemporal validation dataset (IVD), data was collected from the same patient types from September 2022 to November 2023. The exclusion criteria were as follows: (i) poor sonographic quality; (ii) O-RADS category 0 or 1, or images in which it was not possible to determine the blood flow score of the lesion; (iii) history of previous treatment of the adnexal lesion before the ultrasound examination; (iv) history of malignant adnexal lesions; (v) pathological confirmation of inflammatory disease and ectopic pregnancy; and (vi) discrepancy between the ultrasound depiction of the lesion site and the actual site of surgical resection. The patient flow chart is shown in Figure 1 . All images were exported and converted to JPG format. Cases meeting the study criteria were identified and relevant data were collected using a standardized form by a trained physician and reviewed by a senior physician. The collected data comprised patient names, ages, sonograms, ultrasound reports, menstrual statuses, lesion counts, and pathological findings. Sonograms featuring key characteristics, such as maximal planar gray-scale images, septal thickness, papillae, and ascites or peritoneal nodules accompanying the lesion, were selected for model training. When multiple sonograms of very similar quality exist for a particular lesion, only one is randomly included in the analysis. This retrospective study was reviewed and approved by the Review Committee of the Fourth Affiliated Hospital of Harbin Medical University (No. 2023-SCILLSC-14), which waived the requirement of obtaining written informed consent from patients.

Ultrasound examination and image quality control
All sonograms were obtained by physicians with at least five years of experience in gynecological ultrasound using the following ultrasound equipment: GE Healthcare of Vol on E6 and Vol on E8 with vaginal probes at 5.0–9.0 MHz and transabdominal probes at 1.0–5.0 MHz, respectively. The sonograms of the lesions were recorded and stored according to the standard terms, definitions, and measurement guidelines prescribed by IOTA SR [ ] or O-RADS [ ]. The key characteristics of each lesion are fully recorded in the ultrasound report.
O-RADS classification
Three senior gynecological sonographers (with 36, 16, and 15 years of experience in gynecological sonogram interpretation, respectively) independently reviewed the stored ultrasound images of each lesion, in conjunction with the ultrasound report of the lesion, if necessary. The physicians were unaware of all clinical and imaging data, except the patient’s age and whether or not they were menopausal. Patients who had undergone a hysterectomy or whose menopausal status was undocumented and who were aged ≥50 years were considered postmenopausal. Sonographers classified the sonograms of each lesion into O-RADS risk categories 2–5 based on classification criteria, and images consistently classified as O-RADS 1 (normal ovaries) were excluded. In the event of disagreement between doctors regarding the classification of a lesion, all sonograms of the lesion were analyzed and discussed by three doctors to reach a consensus classification. In the event of multiple or bilateral lesions, an O-RADS classification was conducted for each lesion based on its ultrasound characteristics.
The results of O-RADS classification were evaluated based on the pathological findings of the lesion, with the borderline lesion classified as malignant [ ]. To pass the assessment, it was necessary for the malignancy rate for each category to be within the risk range defined by O-RADS and for the sensitivity and specificity for diagnosing malignant lesions in O-RADS categories 4 and 5 to be comparable to previous relevant studies [ ]. Whenever the results of the assessment did not fulfil any of the above requirements, the classification was repeated after replacing two of the doctors involved in the classification.
Construction of DNN models
Data preprocessing
One physician manually removed noise information (e.g., ultrasound device parameters, etc.) that was asymmetrically distributed in the region surrounding the original image. To address the imbalance in the number of images in different categories, we implemented a single or combination of data enhancement methods, including flipping (vertically or horizontally), rotating, and adjusting brightness or contrast. This was performed to enhance the generalization performance of the model while balancing the number of images in each category. During this process, the grayscale features and texture information of the lesions were not altered. All enhanced images were resized to 224 × 224 pixels.
DCNN model training
Three representative deep convolutional neural network models—ResNet34, DenseNet121, and ConvNeXt-Tiny—were selected and systematically trained using preprocessed acoustic images in the DD. These models utilize a transfer learning strategy with the help of pretrained model weights as initial parameters. The data set was randomly partitioned into training, validation, and test sets at a 7:1:2 ratio using the random sample partitioning method. During the model training phase, the parameters of the fully connected layer were fine-tuned using a back-propagation algorithm to better fit the dataset of this study. The weights of the neural networks were updated using the Adam optimizer with an initial learning rate of 0.0005 and a batch size of 32. The initial number of training rounds was set for all models at 100 cycles. After each training cycle, the trend of the models’ accuracy and loss values on the validation set was observed. Training was terminated when the accuracy began to stabilize or exhibit a slight increase, and the loss value began to stabilize or exhibit a slight decrease. The DCNN model with the highest accuracy was selected as the final model. Once the models had been trained, their predictive performance was evaluated on a test set, from which the model with the best overall performance is selected, and the optimal model was validated across time using the IVD as the test set. These processing steps were performed using Python (version 3.9.18).
Comparison of O-RADS classification efficiency with and without DCNN assistance
From the IVD, 120 lesions were extracted for each of Groups A and B, with the following O-RADS 2–5 class distributions: 60, 18, 24, 18. The final predicted category of the lesions is determined by the equally weighted average of image probabilities derived from DCNN classification. Three gynecologic ultrasonographers, each with three, five, and eight years of experience, respectively, randomly selected either Group A or B as the control group and the other group as the experimental group without knowledge of the pathology. Both categorization events commenced at 8 a.m. and there were no notable discrepancies in the surroundings and the status of the sonographers. The control group performed unassisted classification first; the experimental group, informed of the DCNN model’s accuracy, classified with its assistance, yet the ultimate decision remained with the physician. The time required for sonographers to classify was accurately documented, and statistical discrepancy in classification accuracy before and after the introduction of DCNN assistance was calculated using the classification results of the senior sonographers as the standard.
Statistical analyses
For continuous variables (e.g., age), the t-test was employed if the data exhibited a normal distribution and the chi-square test was met; otherwise, the Mann-Whitney U-test was used. For binary variables (e.g., malignancy rate and overall accuracy), the chi-square test was applied if the expected frequencies were both >5; otherwise, the Fisher exact test was employed. A two-tailed z-test was employed to ascertain whether the malignancy rates for each category fell within the risk ranges defined by O-RADS.
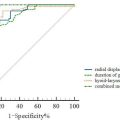
The three DCNN models were evaluated and key performance metrics, including accuracy, specificity, precision, recall, and F1 score, were calculated based on their prediction results on the test set. Receiver operating characteristic (ROC) curves and area under the curve (AUC) values were generated for each category using the one-versus-rest strategy. The overall classification efficacy of the model was then comprehensively rated using macro-averaged ROC curves. The 95% confidence intervals for these metrics were calculated using the bootstrap method in NumPy (version 1.26.3). Statistical significance was set at p < 0.05.
Results
Patient characteristics and O-RADS classification results
The DD contained 2455 two-dimensional grayscale sonograms of 870 ovarian adnexal lesions from 845 patients, and the IVD contained 426 sonograms of 280 ovarian adnexal lesions from 255 patients. Patient and lesion characteristics are presented in Table 1 , and there was no statistically significant difference in patient age, the proportion of postmenopausal individuals in the total population, and the malignancy rate of lesions between the two data sets.
| DD | IVD | p -value | ||
|---|---|---|---|---|
| No. of patients | 845 | 255 | ||
| Age (y) a | 42.0±13.9 (11-86) | 41.7±13.5 (14-75) | >0.05 | |
| Postmenopausal | ||||
| Yes | 255 (30) | 66 (26) | >0.05 | |
| No | 590 (70) | 189 (74) | ||
| No. of lesions | Total | 870 | 280 | |
| Benign | 712 (82) | 228 (81) | ||
| Malignant | 119 (14) | 36 (13) | ||
| Borderline | 39 (4) | 16 (6) | ||
| Malignant rate | 0.182 | 0.186 | >0.05 | |
The results of the O-RADS classification are presented in Table 2 . The proportion of malignant tumors among O-RADS category 2 lesions in the DD was 0.41%, and the null hypothesis that the proportion of malignant tumors in this category was <1% was not rejected by the upper-tailed z-test ( p = 0.09). Among O-RADS category 3 lesions, the proportion of malignant tumors was 4.00%. The results of the low-tailed and upper-tailed z-tests supported the hypothesis that the proportion of malignant tumors in this category would be no less than 1% and no more than 10%, respectively ( p = 0.99 and p = 0.99). The proportion of malignant tumors in O-RADS category 4 lesions was 46.56%. Again, the results of the low-tailed and upper-tailed z-tests verified that the proportion of malignancy ranged from 10% to 50% ( p = 0.99 and p = 0.78). Among O-RADS category 5 lesions, the proportion of malignancy was as high as 92.71%, and the low-tailed z-test confirmed the hypothesis that the risk of malignancy exceeded 50% ( p = 0.99). A similar statistical analysis was performed for IVD, confirming that the proportion of malignancies in each IVD category was consistent with the risk range defined by O-RADS. In particular, the upper-tailed z-test p value for O-RADS category 2 lesions was 0.32, while the low-tailed and upper-tailed z-test p values for O-RADS category 3 lesions were 0.85 and 0.93, respectively. The low-tailed and upper-tailed z-test p values for O-RADS category 4 lesions were 0.99 and 0.88, respectively, while the upper-tailed z-test p value for O-RADS category 5 lesions was 0.99.
| O-RADS | 2 | 3 | 4 | 5 | |
|---|---|---|---|---|---|
| DD | Total | 493 (57) | 150 (17) | 131 (15) | 96 (11) |
| Benign | 491 (99.6) | 144 (96) | 70 (53) | 7 (7) | |
| Malignant | 2 (0.4) | 4 (3) | 46 (35) | 67 (70) | |
| Borderline | 0 (0) | 2 (1) | 15 (11) | 22 (23) | |
| Malignant rate | 0.41% | 4.00% | 46.56% | 92.71% | |
| IVD | Total | 157 (56) | 37 (13) | 48 (17) | 38 (14) |
| Benign | 156 (99.4) | 36 (97.3) | 28 (58) | 8 (21) | |
| Malignant | 1 (0.6) | 0 (0) | 14 (29) | 21 (55) | |
| Borderline | 0 (0) | 1 (2.7) | 6 (13) | 9 (24) | |
| Malignant rate | 0.64% | 2.70% | 41.67% | 78.95% |
Related posts:
 A Narrative Review of Image Processing Techniques Related to Prostate Ultrasound
 Assessing Intensive Care Unit Acquired Weakness: An Observational Study Using Quantitative Ultrasound Shear Wave Elastography of the Rectus Femoris and Vastus Intermedius
 Transcranial MRI-guided Histotripsy Targeting Using MR-thermometry and MR-ARFI
 Ischemia/Reperfusion Injury Enhances Accumulation of Perfluoropropane Droplets
 Application of B+M-Mode Ultrasound in Evaluating Dysphagia in Elderly Stroke Patients
 Automatic Segmentation of Quadriceps Femoris Cross-Sectional Area in Ultrasound Images: Development and Validation of Convolutional Neural Networks in People With Anterior Cruciate Ligament Injury and Surgery
Stay updated, free articles. Join our Telegram channel

Full access? Get Clinical Tree


