Abstract
Objective
Histotripsy is a non-invasive acoustic ablation technique that leverages cavitation to impart mechanical damage to a viscoelastic medium, such as tissue. Although histotripsy bubbles and lesions can be imaged with a variety of modalities, reliable methods to predict tissue disruption across different tissue-types remain to be determined.
Approach
Several ex-vivo bovine tissues were ablated by intrinsic threshold histotripsy over a range of pulse-per-location acoustic doses. Acoustic Cavitation Emission (ACE) signals were captured following every other therapeutic pulse using transmit-receive capable histotripsy arrays. Final bubble lifespan, lifespan-slope, and percent-reduction were calculated and correlated against histologic necrosis score (0-5: 0=0% necrosis, 5=>95% necrosis) and residual structure score (0-4: 0=none present, 4=intact) to evaluate the ability of features from ACE-signals to predict histotripsy-induced damage. Further, optimal ACE-feature thresholds were determined for binary evaluation of whether a necrosis score equal or greater than 4 had been reached.
Results
Measured lifespans increased and lifespan-slopes decreased with pulses per location (ppl) and eventually plateaued in all tissue types, in similar trends to those previously observed in tissue phantoms. Necrosis score increased and residual structure decreased with increasing acoustic dose. Bubble lifespan-slope and percent-reduction correlated well with necrosis score. Thresholds able to predict the necrosis score of 4 or greater in brain, liver, and kidney were calculated with high sensitivity/specificity (>80%). The necrosis score of 4 and 5 is expected to correspond to near-complete/complete ablation by histological evaluation.
Conclusion
Features measured from ACE-signals, particularly the lifespan-slope and percent reduction, were used to predict near-complete/complete ablation of large-volume histotripsy treatments in ex vivo bovine liver, kidney, and brain tissues with good accuracy. Tissue heterogeneities were observed to impact the histotripsy damage and corresponding ACE-signals, and thus the predication accuracy.
Introduction
Histotripsy is a non-invasive acoustic ablation technique that utilizes cavitation to mechanically disrupt tissues. Cavitation during histotripsy is generated using microsecond length, high-amplitude pressure pulses to excite native dissolved gas nuclei. The rapid growth and collapse of the excited gas nuclei result in high stresses and strains in tissues, which fractionates and ultimately reduces them to liquefied acellular homogenates. Histotripsy ablation of tissues has been demonstrated in a wide range of tissue types (e.g., kidney, liver, brain, blood clots) and in a wide range of locations in the body [ ]. The first histotripsy device has recently been approved by the FDA for use in treating primary and metastatic liver tumors [ ].
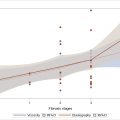
Although histotripsy treatments have been successfully and safely applied to liver tumors in human patients, a key challenge has been that of actively monitoring the level of induced damage (e.g., percent tumor kill) generated in tissue during histotripsy treatments, which is critical for ensuring reliable, repeatable, and efficient treatments between patients. While numerous methods exist for monitoring the generation/presence of cavitation and the area associated damage in tissues (e.g. diagnostic B-mode ultrasound imaging, MRI, passive cavitation imaging (PCI)), these methods do not confer reliable information on the intensity of the damage to the exposed media [ ]. Histotripsy ablation zones can be visualized on B-mode ultrasound imaging as a hypoechoic zone; however, the reduced echogenicity can be offset by the coagulation of the homogenized tissue debris and cannot be used to reliably determine whether the target zone is partially or completely damaged. Additionally, MR imaging is highly costly, clinically burdensome, and is not fast enough for use in real-time during histotripsy. Alternatively, more recent work is ongoing to leverage alternative ultrasound imaging methods such as color flow imaging or elastography to localize bubble activity and possibly predict the level of induced damage [ ].
Further complicating matters, the susceptibility of different tissues to histotripsy-induced damage is known to be highly dependent on the tissues’ mechanical properties, which can be difficult to predict a priori and varies between patients and tumor types [ , ]. In practice, the lack of reliable indicators of complete treatment (i.e. tissue homogenization), and the known variability in tissues’ susceptibility to histotripsy-induced damage, effectively necessitate the use of a worst-case-scenario treatment plan [ ]. In other words: using the set of exposure conditions with sufficiently high dose determined to lead to the complete ablation of the most-difficult-to-treat tissue type in all tumors and patients. While such an approach may be effective for ensuring complete destruction of targeted tumors in all patients, it can lead to long treatment durations, particularly when targets are larger than 5 centimeters in diameter [ ]. In addition, recent studies in in-vivo rodent tumor models have suggested that there is a dose-dependent, anti-tumor immune response following histotripsy treatment [ , ]. These results further highlight the need for establishing metrics and methods for monitoring histotripsy-induced damage in tissues.
The nucleation and collapse of inertial cavitation bubbles, such as those generated during histotripsy, are known to emit acoustic shockwaves during said nucleation and collapse phases. The dynamics of cavitation bubbles, including the relative timings and amplitudes of these shockwaves, are known to be dependent on the viscoelastic properties of the nucleation medium [ , ]. Repeated exposure to cavitation during histotripsy (i.e., increasing cavitation dose) is known to incrementally reduce tissues to liquefied acellular homogenate; by inspection, the reduction of tissue from a viscoelastic solid to a liquid homogenate will alter its viscoelastic properties. Under otherwise equivalent nucleation conditions, the dynamics of bubbles generated in the exposed tissues, and corresponding shockwaves emitted therefrom, can be expected to demonstrate measurable changes. In a previous study in which histotripsy was applied to single focal-site targets within viscoelastic hydrogels, it was demonstrated via high-speed imaging that the dynamics of the generated cavitation varied as a function of increasing levels of induced damage generated in the hydrogels, which in turn was a function of increasing acoustic exposure [ ]. In particular, the bubble lifespan (time between cavitation nucleation and collapse) was observed to increase with increasing damage levels before plateauing when damage was complete. That study also demonstrated that the changes in cavitation lifespan could be detected using a transmit-receive capable histotripsy array by monitoring the Acoustically-nucleated Inertial Cavitation Emitted Shockwave signals, hereafter referred to as Acoustic Cavitation Emission (ACE) shockwave signals for brevity. Hydrophone measurements of the ACE-signals during a preliminary study in which histotripsy treatments were applied to single focal site targets in ex-vivo bovine liver tissues similarly showed that the bubble lifespan increased as a function of increasing acoustic dose before eventually plateauing beyond certain exposure thresholds [ , ], However, no post-treatment histological analyses were performed to evaluate the level of cellular destruction in these targets to quantitatively correlate them with the measured ACE-signals.
The goal of this paper was to evaluate the feasibility and accuracy of using features from ACE-signals, specifically the bubble lifespan, to predict near-complete/complete tissue disruption of large-volume, intrinsic-threshold histotripsy ablations by two ultrasound arrays (different F#’s) across several representative soft tissue types (brain, liver, kidney). ACE-signals were captured during every-other pulse of each treatment for post-hoc analysis. Following exposure, each sample was fixed, stained, and analyzed by a board-certified pathologist for the degree of tissue disruption. Pathologist scores were compared against bubble dynamics measured from the ACE-signals to measure their predictive value.
Ex-vivo bovine brain, liver, and kidney tissues were selected because their material properties are representative of the range of soft tissue histotripsy targets [ ]. Although ACE-signal monitoring methods could still be developed for non-soft tissue histotripsy targets (e.g. tendon, bone), the significant difference in material properties and structure would likely generate different patterns of bubble dynamics. Another key factor in this study is that the ablations will be “large-volume” relative to the bubble cloud size (∼280:1). Previous studies using ACE-signal based monitoring methods were for single-point targets, but it was unclear whether/how anisotropic cavitation conditions could affect the pattern of bubble dynamics during treatment (e.g. tissue heterogeneity like a blood vessel, damage to adjacent locations). Finally, treatments for these tissues will be performed with different two histotripsy arrays; arrays with geometries relevant to treating the respective tissues (abdominal and cranial). Array focusing is known to affect bubble cloud dynamics [ ], so demonstrating whether ACE-signal monitoring methods work across these two arrays could provide some evidence of its robustness for translation to any future clinical devices.
Materials and Methods
Experimental setup
All experiments were performed in tanks of de-ionized water filtered to 2µm and degassed to 20% oxygen saturation as measured by a ThermoFisher Orion Star A323 oxygen meter (Waltham, MA). The water temperatures were measured to be between 20 and 21°C. Samples of ex-vivo bovine tissue (liver, kidney, brain; < 2hrs from sacrifice) were procured from a local abattoir. Tissues were cut into 3 cm cubic volumes and degassed under 30inHg vacuum for at least 3 hours to extract any gas that dissolved into the tissues during transit [ ]. Samples were then embedded in 1.5% agarose hydrogel tissue holders [ ]. During treatments (described below), the tissue samples were mounted at the geometric focus of the histotripsy transducer in the water tank and treated using a range of different acoustic doses to generate different levels of induced damage at the treatments’ endpoints ( Figure 1 ). All tissues were treated within four days of acquisition.

Histotripsy transducers
Two histotripsy transducers, designed and fabricated in-house, were used in this study. The transcranial array is a 360 element, 30 cm aperture diameter hemispherical histotripsy array with a center frequency of 700kHz ( Figure 2 A). The focal zone was 1.2 × 1.2 × 2.3mm 3 in the two transverse and axial axes, respectively. Its geometry was designed to cater to transcranial treatments and was used to treat the bovine brain samples [ ]. The abdominal histotripsy array is a spherically curved 750kHz phased array with a 14.2cm focal radius ( Figure 2 B). The 260 elements of the array are arranged in concentric rings around a 6 cm diameter cutout at the center to allow for the placement of an imaging transducer. The focal zone of the array was measured to be 1.6 × 1.1 × 4.5 mm 3 . The array has an ellipsoidal aperture suitable for coupling to the abdomen, so it was used to treat the bovine liver and kidney samples [ ].

Each transducer element of both arrays was configured to operate in a transmit-receive mode to allow simultaneous generation of the acoustic pulses necessary to generate cavitation and the acquisition of the resulting ACE-signals emitted therefrom. The individual transducer elements were characterized by measuring their output waveform using a fiber-optic hydrophone (HP; Onda HPO-690, Sunnyvale CA) positioned at the focal radius of each array (transcranial – 15cm, abdominal 14.2cm). Acoustic pulses emitted by the elements of each array measured approximately 1.5 acoustic cycles, with corresponding durations of 2.1us (transcranial array) and 2us (abdominal array). The focal zones of the arrays were calculated by firing all of the elements and measuring one-dimensional (1D) transmit beam profiles along three axes using a needle hydrophone (Onda HNR-500, Sunnyvale CA), at low driving pressures (≤1MPa) [ , ]. The sizes of the arrays’ focal zones were defined as the full-width half-maximum (FWHM) of the measured 1D beam profiles. On receive, each transducer element of the arrays was connected to a 12-bit analog-to-digital converter (ADC) with a maximum sampling frequency of up to 50 MHz. Control of the arrays was accomplished using custom programmed system-on-a-chip (SoC) devices, which could store received ACE-signals from every element of the array after every delivered acoustic pulse.
Histotripsy treatment parameters
An 8 × 8 × 8 mm 3 cubic ablation region was prescribed to each tissue sample. This volume was comprised of many individual histotripsy steering foci that were arranged in a hexagonal-close-packing (HCP) lattice with 0.5 mm lattice point spacing. During treatment, the focal pressure amplitudes of the array were set to 30 and 40 MPa for the abdominal and transcranial array treatments, respectively. The different absolute pressure amplitudes between arrays were chosen to compensate for the differences in the focal zone shapes and set such that the histotripsy bubble clouds generated by each array would be roughly equivalent in size and have diameters of ∼1.5mm. These pressures were determined from preliminary studies in which brain, liver, and kidney samples were exposed to up to 50 pulses of histotripsy at a single focal location at varying driving pressures, processed for H&E histology, and analyzed to compare the relationship how driving pressure determines focal lesion size for each array. Further, the electric drive power of the arrays was modulated during treatment to compensate for focal steering pressure losses such that these pressures were uniformly maintained throughout the entire steering volume. During treatments, histotripsy pulses were applied to the tissue samples at a pulse repetition frequency (PRF) of 500 Hz. Treatments were delivered such that each subsequent histotripsy pulse would be applied to a different focal location within the steering grid until one pulse had been delivered to all steering locations within the grid. This was then repeated a specified number of times to meet desired acoustic dose, hereafter referred to as pulses-per-location (ppl), of the treatment. In each tissue type, exposures of 3 / 5 / 10 / 20 / 30 ppl were delivered; 4 brain samples and 6 liver and kidney samples were treated per exposure level (80 tissue samples total). To ensure that the cut plane of the tissue during histological sectioning bisected the generated ablation zone, an additional ‘registration’ lesion was generated by applying 500 histotripsy pulses along the line between [0,0,-15] and [0,0,-30] (i.e. the boundary between gel & tissue). These ‘registration’ lesions were placed ≥10mm from the cubic treatment volume, measured approximately 2mm in diameter, were aligned with the center of the cubic treatment volume along its transverse (X, Y) axes, and were visible to the naked eye to assist with histological sectioning.
Acoustic cavitation emission (ACE) signals
ACE-signals were captured using the receive capable elements (Rx) of the histotripsy arrays following every other pulse of treatment [ ] ( Figure 3 ). To further reduce the data volume, signals were acquired at a sampling frequency of 5 MHz. Receive data was sub-sampled in this way in order to manage the volume of recorded data while still maintaining the ability to sample bubble activity across the treatment volume. Phase-delays were applied to compensate for focal steering, then the timings and amplitudes of each shockwave within the acquired signals were calculated as follows and recorded. Given time t in 1:T, elements e in 1:E, and signal S(t,e):
Coherence(t)=(∑1ES(t,e))2∑1ES(t,e)2

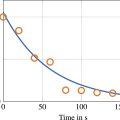
First, the coherence of the signal from a single histotripsy event measured across the elements of the acoustic array was calculated as described in Equation 1 following the metric introduced by Mallart and Fink [ ] ( Figure 4 a). Because ACE-signals have high phase coherence compared to reflections from tissue, time windows for the nucleation and collapse signals could be determined via peak detection on the coherence [ , ] ( Figure 4 b). These 20µs windows were applied to the raw data, and singular value decompositions were calculated on the time-windowed data matrices containing nucleation or collapse signals from all elements [ ] ( Figure 4 c,d,e,f). All but the first eigenvalues were discarded to remove background noise and isolate the shockwaves [ , , ]. Peaks in the SVD-filtered signals were detected to identify the shockwave timings and amplitudes for each focal-location.

Bubble lifespan is calculated as the mean difference between the nucleation and collapse shockwave arrival times measured across all focal locations. Then, bubble lifespan-slope was calculated as a series of linear-fits on the bubble lifespan as a function of ppl using a moving window (size 4 ppl). Finally, percent-reduction (i.e. normalized reduction in lifespan-slope) is calculated with Equation 2 . Given pulse p in 1:P, and LifespanSlope(p):
%Reduction(p)=100*(1−LifespanSlope(p)LifespanSlope(1))
Histology
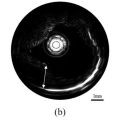
Following treatment, each tissue block (embedded in agarose gel) was marked to indicate the positive X/Y/Z axes (relative to the histotripsy array elements’ coordinates) and was stored in 10% formalin for 72 hours to fix before storage in 70% ethanol. To prepare for histology processing, each tissue block was bisected using the ‘registration’ lesion to localize the damaged volume. After bisecting the samples, two notches were cut into the tissue outside of the treatment zone to preserve indicators of the orientation of the sample during treatment following histological processing as needed for co-registration with localized, ACE-signal assessments later. One diagonal notch was placed in the corner of the cube to designate the +X and +Z directions, and another triangular notch was placed midway along the face of the cube to designate the -Z direction ( Figure 4 ). These notches allowed unique identification of the orientation of the sample within the histotripsy array during treatment. Finally, tissue samples were loaded in histology cassettes, embedded in paraffin, and stained using hematoxylin and eosin (H&E) to visualize their structures and the mechanical disruption generated within.
Following staining, ground-truth damage results were assessed by a board-certified surgical pathologist (Jiaqi Shi). Damaged regions, similar to the region outlined in black in Figure 5 , were manually segmented on each slide for analysis. Then the pathologist, blinded to the treatment applied to the tissue, graded the damage in each region based on the overall percentage of tissue necrosis and the remaining areas of residual structures (e.g., epithelial cells, neurons, blood vessels, stroma, glia, etc.) using the following grading scales [ ]:
Necrosis score: 0 (0%), 1 (1-25%), 2 (26-50%), 3 (51-75%), 4 (76-95%), 5 (>95%)

Residual Structure: 0 (none present), 1 (patchy/small areas), 2 (patchy/large areas), 3 (diffuse areas), 4 (intact). Several samples were omitted from the final analysis due to the histology slices not intersecting the center of the ablation lesion. This resulted when larger tissue samples surpassed the ‘registration’ lesion, and clean slices of the center of the ablation zone could not be procured following histotripsy exposure. The following samples were removed from their respective tissue-type/acoustic-dose groups: 2 brain-20ppl, 1 liver-3ppl, 1 liver-5ppl, 1 kidney-5ppl, 1 kidney-10ppl.
ACE Correlation with Pathology
As the pathologist evaluations are discrete measurements, the Spearman correlation was used to evaluate the efficacy of using ACE-signals to predict tissue disruption. The lifespan, lifespan-slope, and percent-reduction from the last pulse of each ablation were correlated against the corresponding necrosis scores and residual structure scores.
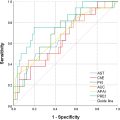
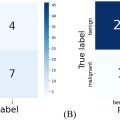
In addition, ideal thresholds for binary evaluations of no/partial damage vs. near-complete/complete damage were determined for each of the three ACE-features (lifespan, lifespan-slope, percent reduction). For the ground-truth data, a necrosis grade 4 and 5 was used as the threshold for near-complete/complete damage. Although grade 4 retained some viable tissue, most of the residual tissues are detached, minute islands of cells suspended in necrotic debris with no blood supplies and would likely not survive. For the experimental data, final lifespan/lifespan-slope/percent-reduction was used to predict the presence of near-complete/complete damage. ROC curves were calculated by sweeping threshold values for each of the ACE-features, and calculating the corresponding sensitivities ( Eq. 3 ) and specificities ( Eq. 4 ) to the pathological results. Area-under-the-curve (AUC) was calculated using integration with the trapezoidal method. The ideal threshold for each the ACE-feature/tissue-type pair was identified as the value with the greatest F1-score ( Eq. 5 ). For this value, the “peak” sensitivity, specificity, accuracy ( Eq. 6 ), positive-predictive value (PPV) ( Eq. 7 ), and negative-predictive value (NPV) ( Eq. 8 ) are calculated. Without a defined clinical standard for damage monitoring of mechanical ablation, validation of this technique was performed by comparing its efficacy against those reported for other methods [ , , , ].
For true-positive counts TP , true-negative counts TN , false-positive counts FP , and false-negative counts FP :
Sensitivity=TPTP+FN
Related posts:
 Quantitative Analysis of Contrast-Enhanced Ultrasound Images of Brain-Dead Donor Livers: Prediction of Early Allograft Dysfunction
 Ultrasound Shear Wave Elastography and Shear Wave Dispersion: Correlation with Histopathological Changes in Autoimmune Hepatitis Patients
 Diagnosis of Salivary Gland Tumors Using Ultrasound Radiomics
 Empirical Model of Focused Ultrasound-Mediated Treatment for Chemotherapy Delivery to Brain Tumors
 High-Frequency Ultrasound Characterization of Periodontal Soft Tissues Pre- and Post-Bacterial Inoculation
 SDRD-Net: A Symmetric Dual-branch Residual Dense Network for OCT and US Image Fusion
Stay updated, free articles. Join our Telegram channel

Full access? Get Clinical Tree


