Abstract
Objective
To evaluate the added value of dynamic contrast-enhanced ultrasound (DCE-US) analysis in pre-operative differential diagnosis of small (≤20 mm) solid pancreatic lesions (SPLs).
Methods
In this retrospective study, patients with biopsy or surgerical resection and histopathologically confirmed small (≤20 mm) SPLs were included. One wk before biopsy/surgery, pre-operative B-mode ultrasound and contrast-enhanced ultrasound were performed. An ultrasonic system (ACUSON Sequoia, Siemens Medical Solutions, PA, USA) equipped with a 5C1 MHz convex array transducer was utilized. A dose of 1.5 ml SonoVue (Bracco, Italy) was injected as the contrast agent. Time-intensity curves were generated using VueBox software (Bracco) and various DCE-US quantitative parameters were subsequently calculated after curve fitting. Univariate and multivariate logistic regression analysis were utilized.
Results
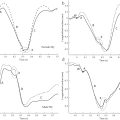
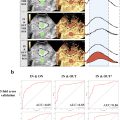
From August 2020 to November 2023, a total of 76 patients (31 males and 45 females; mean age: 61.9 ± 10.5 y) with 76 small (≤20 mm) SPLs were included. Mean size of the lesions was 16.4 ± 0.4 mm (range: 7–20 mm). Final diagnosis included 37 benign and 39 malignant small SPLs. On B-mode ultrasound, the majority of malignant (37/39, 94.9%) and benign SPLs (30/37, 81.1%) were hypo-echoic lesions with ill-defined borders and irregular shapes ( p > 0.05). During the arterial phase of contrast-enhanced ultrasound, most SPLs (59/76, 77.6%) exhibited iso-enhancement when compared with surrounding pancreatic parenchyma. Subsequently, 82.1% (32/39) of malignant SPLs and 35.1% (13/37) of benign SPLs demonstrated wash-out in the venous phase and showed hypo-enhancement in venous and late phases ( p > 0.05). Compared with benign SPLs, the time-intensity curves of small malignant SPLs revealed earlier and lower enhancement in the arterial phase, and a faster decline during the venous phase with a decreased area under the curve. Among the quantitative parameters, a lower peak enhancement ratio and higher fall time ratio were more common in small malignant SPLs ( p < 0.05). For DCE-US analysis, the combined areas under the curve of significant quantitative parameters was 0.919, with 87.2% sensitivity and 86.5% specificity when differentiating between small malignant and benign SPLs. This result was better than contrast-enhanced computed tomography, which has a sensitivity of 74.4% and a specificity of 75.7%.
Conclusion
DCE-US analysis provides added value for the pre-operative differential diagnosis of small malignant SPLs.
Introduction
Currently, ultrasound is commonly used for the initial screening of pancreatic lesions during routine medical examinations [ ]. Contrast-enhanced ultrasound (CEUS) shows good diagnostic efficacy and displays real-time microvascular perfusion in pancreatic lesions [ ]. According to 2017 European Federation of Societies for Ultrasound in Medicine and Biology (EFSUMB) guidelines, CEUS is crucial for distinguishing between solid and cystic pancreatic lesions [ ]. Certain CEUS features, such as hypo-enhancement through all phases of CEUS, are especially valuable for diagnosing pancreatic ductal adenocarcinomas [ , ], with an accuracy of 87%–93% [ , ].
Recent advances in ultrasound equipment and technologies have increased the detection rates of small pancreatic lesions in clinical practice, with an incidence of approximately <5% [ , ]. According to the literature, 60% of small solid pancreatic lesions (SPLs) are diagnosed as benign lesions while excluding pancreatic ductal adenocarcinoma [ ]. Achieving an accurate and non-invasive pre-operative differential diagnosis of SPLs is vital for tailoring optimal clinical treatment decisions for patients [ ].
Currently, several imaging methods have been used in clinical practice to diagnose SPLs, including trans-abdominal ultrasound, endoscopic ultrasound (EUS), computed tomography (CT) and magnetic resonance imaging (MRI). High-resolution CT and MRI have proven to be useful for characterizing and staging SPLs. However, CT and MRI are limited by potential radiation exposure, the risk of iodine allergy and long waiting times [ ]. EUS, with its superior spatial resolution, could assist with fine-needle aspiration guided by real-time imaging. However, it is an invasive and time-consuming imaging method with potential sample errors [ ]. The reported accuracy of EUS for diagnosing SPLs is 73% [ ].
According to 2023 EFSUMB recommendations, dynamic contrast-enhanced ultrasound (DCE-US) is a non-invasive imaging technique used to quantitatively assess microvascular perfusion in parenchymatous organs and tumors [ , ]. Previously, DCE-US has been used to differentiate focal liver lesions and focal thyroid lesions [ , ]. Time-intensity curves (TICs) created from DCE-US analysis illustrate the dynamic wash-in and wash-out process of CEUS enhancement [ ]. After curve fitting, CEUS quantitative parameters have been shown to correlate with blood volume and microvascular perfusion of lesions [ ]. Aided by quantitative analyses, DCE-US analysis evaluates tumor microvascular perfusion as well as vascular architecture [ ]. To the best of our knowledge, few studies have focused on the application of DCE-US in differentiating SPLs, especially those within sizes ≤20 mm [ , ].
The aim of this study was to evaluate the added value of DCE-US analysis in the pre-operative diagnosis of small (≤20 mm) SPLs.
Patients and methods
Patients
This retrospective study received approval from the Institutional Review Board of our institution. Informed consent was received by all patients prior to ultrasound examination. All patients were consecutively included in the study at our hospital.
Inclusion criteria included: (i) Diagnosis of small SPLs confirmed by histopathological results from surgery resection or biopsy; (ii) CEUS examination performed 1 wk prior to surgery or biopsy; (iii) availability of continuous digital imaging and communications in medicine-format CEUS clips exceeding 2 min; (iv) clear detection of pancreatic lesions on B-mode ultrasound (BMUS).
Exclusion criteria included: (i) Patients with previous SPL treatment, such as chemotherapy and radiotherapy; (ii) patients without definitive final histopathological results; (iii) lesions observed as either major or completely cystic on conventional ultrasound examination.
Based on their final histopathological results, patients were categorized into malignant and benign groups.
CEUS examination
All BMUS and CEUS examinations were performed using a 5C-1 convex array transducer (ACUSON Sequoia; Siemens Medical Solutions, PA, USA). A volume of 1.5 ml contrast agent (SonoVue, Bracco, Italy) was administrated into the ante-cubital vein, followed by a 5 ml saline flush. Enhancement degrees and patterns within the pancreatic lesions were evaluated according to current EFSUMB guidelines. CEUS features were analyzed during three phases: The arterial phase (<30 s), venous phase (30–120 s) and late phase (>120 s) [ ]. Cine loops of continuous CEUS over 2 min were stored in digital imaging and communications in medicine format for further analysis.
Contrast-enhanced computed tomography examination
Contrast-enhanced computed tomography (CECT) was conducted 1 wk prior to biopsy or resection using a 320-slice multidetector CT scanner (Aquilion ONE; Toshiba Medical Systems Corporation, Otawara, Japan). Initially, a non-contrast helical CT scan of the pancreas was performed to establish baseline. Following this, 30 mL saline solution and a non-ionic iodinated contrast agent (Iopamiron 370; Bayer HealthCare, Guangdong, China) was injected intravenously. Scans were conducted in three phases: The arterial phase at 20–35 s, venous phase at 60–70 s and late phase at 110–130 s after injection of contrast agent. Scanning layer thickness was set as 0.8 mm, with layer spacing at 1.0 mm. Scans covered the area from the diaphragm to the lower margin of the kidneys. CECT was assessed by two radiologists who were blinded to the pathological results, and any disagreement was resolved by consensus.
Image analysis
VueBox software (Bracco, Italy) was used to quantitatively analyze all CEUS clips. Two doctors, blinded to clinical information and pathological results, performed quantitative DCE-US analysis to reach a consensus. Each SPL was analyzed three times. Two regions of interest (ROIs) were set within the SPL and in the surrounding pancreatic parenchyma, with the same depth. After motion compensation, TICs were created and compared between benign and malignant SPLs.
After curve fitting, various quantitative parameters were calculated, including peak enhancement (PE), wash-in area under the curve (WiAUC), rise time (RT), mean transit time (mTT), time to peak (TTP), wash-in rate (WiR), wash-in perfusion index (WiPI), wash-out area under the curve (WoAUC), wash-in and wash-out area under the curve (WiWoAUC), fall time (FT) and wash-out rate (WoR). Furthermore, the ratios of these quantitative parameters between pancreatic lesions and pancreatic parenchyma were calculated. Quantitative parameters were compared between malignant and benign groups.
Statistical analysis
Quantitative data were presented as mean ± standard deviation or median with 25% and 75% quartiles. The qualitative results were quantified and expressed in numbers and percentages. Student’s t -test or Mann-Whitney U-test was used for continuous variables, while Pearson’s χ 2 test or Fisher’s test was used for categorical variables. Statistical analyses were performed using SPSS software (version 25.0). Univariate and multivariate logistic regression analyses were conducted. Reliability was determined using intra-class correlation co-efficients and kappa analysis. Interpretations of values were as follows: 0–0.2 poor, 0.2–0.4 fair, 0.4–0.6 moderate, 0.6–0.8 good and 0.75–1.0 excellent [ , ].
Results
Patient characteristics
Between August 2020 and November 2023, 76 cases of small SPLs in 76 patients were included. The final histopathological diagnosis comprised 39 malignant lesions (mean size: 17.0 ± 0.5 mm) and 37 benign lesions (mean size: 15.9 ± 0.7 mm). The body mass index of patients ranged between 16.8 and 26.3 kg/m 2 . All patients were included; none were excluded due to body habitus. A statistically significant difference was found in patient age between the malignant and benign groups ( p < 0.05). The final histopathological results are shown in Table 1 .
| Lesion variable | Small malignant SPLs (39) | Small benign SPLs (37) | p Value |
|---|---|---|---|
| Sex (male/female) | 19/20 | 12/25 | 0.168 |
| Age (y) | 64.5 ± 6.8 | 59.2 ± 12.9 | 0.001 |
| Pathology distribution | PDAC (29) | G1,2 NET (14) | |
| IPMN-IC (7) | IPMN (11) | ||
| G3 NET (2) | Cystadenoma (9) | ||
| M (1) | MFCP (2) | ||
| SPT (1) |
Intra-observer reproducibility
Intra-observer reproducibility showed excellent kappa values for CEUS enhancement degrees and patterns (kappa value: 0.941), as well as for CECT diagnostic results (kappa value: 0.923). DCE-US analysis intra-observer reproducibility showed an intra-class correlation co-efficient of 0.973 (95% CI: 0.924–0.999), indicating excellent reliability.
Comparison of conventional ultrasound and CEUS features
The imaging features of small SPLs are summarized in Table 2 . Most small SPLs comprised hypo-echoic lesions, regardless of being malignant (37/39, 94.9%) or benign (30/37, 81.1%), with ill-defined borders and irregular shapes ( p > 0.05). A dilated main pancreatic duct (MPD) measuring >3 mm was observed in 11 (28.2%) small malignant cases and 4 (10.8%) benign cases ( p > 0.05) ( Table 2 ).
| Imaging feature | Small malignant SPLs (n = 39) | Small benign SPLs (n = 37) | p Value |
|---|---|---|---|
| BMUS | |||
| Size (mm) | 17.0 ± 0.5 | 15.9 ± 0.7 | 0.224 |
| Location in pancreas (%) | 0.098 | ||
| Head | 24 (61.5) | 20 (54.1) | |
| Body | 13 (33.3) | 9 (24.3) | |
| Tail | 2 (5.1) | 8 (21.6) | |
| Echogenicity (%) | 0.082 | ||
| Hypo-echoic | 37 (94.9) | 30 (81.1) | |
| Hyperechoic | 2 (5.1) | 7 (18.9) | |
| Margin (%) | 0.094 | ||
| Clear | 5 (12.8) | 11 (29.7) | |
| Ill-defined | 34 (87.2) | 26 (70.3) | |
| Shape (%) | 0.055 | ||
| Regular | 5 (12.8) | 12 (32.4) | |
| Irregular | 34 (87.2) | 25 (67.6) | |
| MPD dilation (>3 mm) | 11 (28.2) | 4 (10.8) | 0.056 |
| CEUS | |||
| Arterial phase (%) | 0.112 | ||
| Hypo-enhancement | 5 (12.8) | 5 (13.5) | |
| Iso-enhancement | 33 (84.6) | 26 (70.3) | |
| Hyper-enhancement | 1 (2.6) | 6 (16.2) | |
| Venous phase (%) | 0.062 | ||
| Hypo-enhancement | 32 (82.1) | 13 (35.1) | |
| Iso-enhancement | 7 (17.9) | 19 (51.4) | |
| Hyper-enhancement | 0 (0.0) | 5 (13.5) | |
| Late phase (%) | 0.062 | ||
| Hypo-enhancement | 32 (82.1) | 13 (35.1) | |
| Iso-enhancement | 7 (17.9) | 19 (51.4) | |
| Hyper-enhancement | 0 (0.0) | 5 (13.5) |
Related posts:
 WFUMB Commentary Paper on Artificial intelligence in Medical Ultrasound Imaging
 Quantitative Liver Fat Assessment by Handheld Point-of-Care Ultrasound: A Technical Implementation and Pilot Study in Adults
 Automatic Segmentation of Sylvian Fissure in Brain Ultrasound Images of Pre-Term Infants Using Deep Learning Models
 Assessment of Coronary Microcirculation with High Frame-Rate Contrast-Enhanced Echocardiography
 Ultrasonographic Measurement of Common Carotid Artery Wall Pulse Dynamics and Longitudinal Motion – Method Validation and a Novel Parameter Ratio
 Intraoperative Real-Time IDH Diagnosis for Glioma Based on Automatic Analysis of Contrast-Enhanced Ultrasound Video
Stay updated, free articles. Join our Telegram channel

Full access? Get Clinical Tree


