Abstract
Objective
Elastography images tissue mechanical responses and infers the underlying properties to aid diagnosis and treatment response monitoring. The estimation of absolute or relative tumor properties may vary with dimensions even when the mechanical properties remain constant. Harmonic motion imaging (HMI) uses amplitude-modulated (AM) focused ultrasound to interrogate the targeted tissue’s viscoelastic properties. In this study, effects of AM frequencies on HMI were investigated in terms of inclusion relative stiffness and size estimation.
Methods
AM frequencies from 200 to 600 Hz in steps of 100 Hz were considered using a 5.3-kPa phantom with cylindrical inclusions (Young’s modulus: 22, 31, 44, 56 kPa, and diameter: 4.8, 8.1, 13.6, 19.8 mm) to optimize the performance of HMI in characterizing tumors with the same mechanical properties and of different dimensions.
Results
Consistent displacement ratios (DRs) (17.5% variation) of the inclusion to background were obtained with 200-Hz AM for breast-tumor-mimicking inclusions albeit a suboptimal inclusion size estimation obtained. 400-Hz was otherwise used for small and low-contrast inclusions (4.8 mm, 22 or 31 kPa). A linear relationship (R 2 = 0.9043) was found between the inverse DR at these frequencies and the Young’s modulus ratio. 400 Hz obtained the most accurate inclusion size estimation with an overall estimation error on the lateral dimension of 0.5 mm. In vivo imaging of breast cancer patients ( n = 5) was performed at 200 or 400 Hz.
Conclusion
The results presented herein indicate that the HMI AM frequency could be optimized adaptively in cases of different applications, i.e., at 200 or 400 Hz, depending on whether aimed for consistent DR measurement for tumor response assessment or tumor margin delineation for surgical planning. HMI may thus be capable of predicting the pathologic endpoint of tumors in response to neoadjuvant chemotherapy (NACT) as early as 3 weeks into treatment.
Introduction
Breast cancer accounted for 31% of newly diagnosed female cancers in 2023 and the second leading cause of cancer-related mortality in the United States [ ]. Neoadjuvant treatment may be considered, aiming to downstage tumors before surgical interventions and guide adjuvant treatments. Mammography [ , ], ultrasound [ ], and magnetic resonance imaging (MRI) [ ] have been employed to monitor tumor response to treatment and predicting pathologic end points based on the changes in tumor volumes or mechanical properties. Results indicated that responsive tumors had at least a 50% decrease in volume [ , ] and 20%–60% decrease in stiffness [ , ]. Ultrasound, requiring no contrast agents, being nonionizing and cost-effective, proves well-suited for repetitive tumor imaging.
Over the past few decades, ultrasound elastography [ ] has been extensively studied to estimate stiffness of the liver [ ], prostate [ , ], pancreas [ ], and breast [ ] quantitatively or qualitatively. Among these techniques, acoustic radiation force-based methods, e.g., Acoustic Radiation Force Impulse (ARFI) imaging [ ], Harmonic Motion Imaging (HMI) [ , ], Viscoelastic Response (VisR) ultrasound imaging [ ], and Shear Wave Elasticity Imaging (SWEI) [ , ], demand less training in comparison to alternative methods that require an external compression with the transducer [ ], and are thus expected to be less prone to interoperator variability. On the other hand, although shear wave-based methods provide quantitative measurements of tissue stiffness by estimating off-axis shear wave speeds, they can suffer from wave distortion due to tissue heterogeneity [ ] and a reduction in spatial resolution due to wave speed estimation over a lateral window of several millimeters in length. On-axis displacement-based methods are less limited in cases of deep-seated masses at high stiffnesses because tissue displacements exhibit the highest amplitude in the region of excitation and are lower off-axis due to attenuation and viscous losses. However, they usually provide qualitative measurements of tissue mechanical properties. In HMI, the intensity of focused ultrasound (FUS) is modulated [ ] to exert oscillatory acoustic radiation force on the tissue. The resulting “on-axis” tissue response is tracked synchronously using an imaging array aligned coaxially. Sinusoidal tissue displacements are then estimated to provide insights on the stiffness of underlying tissues, with lower displacements observed in stiffer tissues. Advantages of HMI over other techniques involve: (1) the utilization of FUS enabling deep tissue characterization and (2) in-plane bulk motion artifacts being easily filtered from the distinct amplitude modulation (AM) frequency [ ]. Previous studies from our group have demonstrated applications of HMI in pancreatic and breast tumor characterization, tumor response assessment to chemotherapy in in vivo murine models [ , , ], ex vivo human specimens [ ], and in vivo clinical patients [ , ].
Ideally, stiffness parameters estimated in HMI or other elastography techniques characterize the tissue mechanical properties accurately regardless of geometries or dimensions. However, as demonstrated by Hossain et al. [ ] and Saharkhiz et al. [ ] in HMI, and Denis et al. [ ] in shear wave elastography, inclusion dimensions significantly affected the stiffness measurement. For the same actual stiffness, larger inclusions appeared to be stiffer, and vice versa [ , ]. This presumably undermines the accuracy and specificity of ultrasound elastography in tumor characterization and treatment response assessment. To address this, Gu et al. [ ] introduced a new parameter in SWEI, mass characteristic frequency, f mass , by dividing the averaged tumor shear wave speed by its largest dimension measured on the B-mode. It was shown that f mass was able to predict pathologic end points for breast cancer patients, albeit at a later time-point. Saharkhiz et al. [ ] have investigated the effects of AM frequencies on HMI-derived inclusion contrast and contrast-to-noise ratio (CNR), suggesting high AM frequencies (200 to 500 Hz) when characterizing small inclusions <6 mm. There remains, however, a clinical need to reduce the inconsistency in HMI-derived relative stiffness of inclusions with the same modulus but different dimensions. Besides, the accuracy of HMI inclusion size estimation is pending evaluation, which potentially provides insights to guide surgical excision.
Another limitation in HMI and other elastography techniques is that mechanical movement of the transducers using a stepper motor [ , , ] to cover the entire region of interest (ROI) is required when characterizing large masses. Extended data acquisition time inevitably complicates postprocessing, introducing more artifacts due to patient motion. In some cases, registration between scans based on radiofrequency (RF) cross-correlation was feasible [ ]. Nevertheless, expediting data acquisition is of greater significance in clinical settings. Electronic beam steering using a multielement FUS transducer and plane wave imaging reduced the amount of mechanical movements and shortened HMI data acquisition by a factor of fivefold [ ], at the cost of a slight decrease in the image qualities [ ]. Enabling focused tracking and simultaneous beam steering of the FUS excitation will preserve the desired image qualities.
Therefore, this study investigated AM frequencies in HMI using an elastic phantom with inclusions of varying diameters and Young’s moduli ( n = 16). The aim was to optimize the performance of HMI in imaging tumors of different dimensions with the same mechanical properties. First, we conducted a comprehensive comparison to minimize variations in DR measurements of inclusions with the same mechanical property but of different sizes. Second, inclusion size estimation based on HMI maps was evaluated, and the AM frequency that obtained the most accurate inclusion size estimation was identified. Applications of the optimized AM frequencies were demonstrated in in vivo breast cancer patients ( n = 5) with the purpose of early prediction of tumor response to neoadjuvant chemotherapy (NACT, n = 4).
Materials and methods
HMI system and pulse sequence
Figure 1 a (left) shows the schematic of HMI data acquisition [ ]. The 256-channel Vantage research platform with HIFU options (Vantage 256, Verasonics Inc., Kirkland, WA, USA) was connected to an external DC power supply (QPX 600DP, Aim-TTi Ltd., Huntingdon, Cambs., UK) to drive the annular 128-element FUS transducer (4.5 MHz, geometric focus: 76 mm, axial x lateral focal spot: 4.30 × 0. 39 mm, H265, Sonic Concepts Inc., Bothell, WA, USA). The remaining 128 channels drove the 104-element imaging array (7.8 MHz, P12-5, ATL Phillips, Bothell, WA, USA) coaligned through the FUS central opening to track the tissue response. The transducer assembly was attached with a coupling cone filled with degassed deionized water. The robotic arm (UR5e, Universal Robots USA, Inc., Garden City, NY, USA) was used to position and then translate the transducers laterally in a 1D raster scanning format, the step size of which was 1.8 or 3.2 mm depending on the FUS electronic beam steering range. To complete a 21-point HMI scan covering a lateral range of 37.8 or 67.2 mm, the data acquisition time was 80 or 95 s.

The HMI pulse sequence ( Fig. 1 b) consisted of amplitude-modulated excitation pulses (red) interleaved with pulse-echo imaging pulses (blue) [ ]. The FUS excitation duty cycle of 22.6% was optimized with the external power supply to produce an in-situ peak-negative pressure of 3.9 MPa. The idle time between consecutive excitation and imaging pulses was 90 μs to avoid strong FUS interference with imaging [ ]. Conventionally, the excitation modulating wave consisted of a single frequency ( Fig. 1 b, left). Hossain et al. [ ] recently have introduced a novel modulation sequence using a linear combination of multiple frequencies, termed “multi-AM.” Figure 1 b (right) demonstrates a multi-AM sequence of 200 and 400 Hz, cos ( 2 π * 200 t ) + 2 cos ( 2 π * 400 t ) . For both single- and multi-AM sequences in this study, the excitation duration at each scan point was 30 ms, i.e., 6 cycles [ ] for a 200-Hz sequence. The imaging sequence consisted of focused tracking using a transmit (Tx) F-number of 4.1 and parallel tracking in receive (Rx F/2.6, i.e., the entire aperture) as described in [ ]. The FUS pulse repetition frequency (PRF) and imaging frame rate were 9x the AM frequency [ ] in a single-AM sequence or 9x the highest in a multi-AM sequence.
Electronic beam steering
By controlling each element of the 128-element FUS transducer individually, the coaxially aligned FUS excitation and focused tracking beam were simultaneously steered electronically in this study. The beam steering range was optimized according to the applied AM frequency. As discussed in [ ], the amplitude of HMI displacements decreases with increased AM frequencies, partially due to the increased viscosity [ ] and inertia [ ] effects. Meanwhile, drops of acoustic pressures were measured with beam steering further away from the geometric focus [ ]. Therefore, to maintain tissue displacements above the system sensitivity, the lateral beam steering range spanned from -1.2 to 1.2 mm in a step size of 0.8 mm for low AM frequencies (200 and 300 Hz), and from -0.6 to 0.6 mm in a step size of 0.6 mm for high AM frequencies (400 to 600 Hz, considering the maximum applied AM frequency in a multi-AM sequence). The axial steering range spanned from -4 to 4 mm in a step size of 4 mm for all cases. Similar to mechanical steering, at each electronically steered point, a single-point HMI was performed.
Phantom experiment
The performance of HMI in imaging elastic inclusions at AM frequencies from 200 to 600 Hz in a step size of 100 Hz was assessed. Sixteen stepped-cylindrical inclusions with clinical breast-tumor-mimicking properties [ , , , ] (diameter: 4.8, 8.1, 13.6, and 19.8 mm, Young’s modulus: 22, 31, 44, and 56 kPa, background: 5.3 kPa, custom model, CIRS Inc., Norfolk, VA, USA) were imaged. The inclusion diameters reported here were measured on the B-mode images acquired during HMI data acquisition (observer: YL), and Young’s moduli were provided by the manufacturer. Four independent HMI scans were acquired at varying elevational locations, not necessarily the center, with the same cross-sectional diameter for each inclusion. In addition, the multi-AM sequence, consisting of 200 and 400 Hz, was tested and compared to the single-AM sequences. The multi-AM weights [ ] were determined empirically to produce comparable amplitudes of interframe displacements at both AM frequencies [ ] ( Fig. 4 a).
In vivo clinical breast tumor imaging
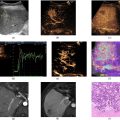
Clinical performance of the optimized AM frequency and the multi-AM sequence were demonstrated in female patients ( n = 5) diagnosed with high-grade ductal carcinoma in situ (DCIS, n = 1), invasive ductal carcinoma (IDC, n = 3), or fibroadenoma ( n = 1). Patient information is summarized in Table 1 . The imaging procedures followed the protocol approved by the institutional review board (IRB) of Columbia University (protocol#: AAAT4412). Informed written consent was obtained from all participants following consultation with their treating physicians. Clinical B-mode images acquired at diagnosis were retrieved from the hospital to aid tumor localization. Before each HMI scan, a handheld ultrasound scanner (Butterfly iQ, Butterfly Network Inc., Guilford, CT, USA) was used to localize the tumor (observer: XJL) with the patient lying supine. Given the time constraints for in vivo scans, only HMI using the optimized AM frequency (200 Hz), based on results from the phantom study, was performed for Patients 1–4. For Patient 5, who was imaged using the multi-AM sequence, cos ( 2 π * 200 t ) + 2 cos ( 2 π * 400 t ) , both multi- and single-AM HMI were performed for comparisons: one multi-AM scan and two single-AM scans (200 and 400 Hz). For Patients 1–4, HMI scans were performed at two different time-points during their NACT treatment: (1) baseline before treatment and (2) early follow-up at 3 weeks into treatment. Due to technical difficulties, baseline HMI scans of Patient 1 were discarded.
| Patient 1 | Patient 2 | Patient 3 | Patient 4 | Patient 5 | |
|---|---|---|---|---|---|
| Age | 62 | 53 | 57 | 53 | 47 |
| Tumor size | 2.5 cm | 3.0 cm | 1.1 cm | 2.6 cm | 1.0 cm |
| Diagnosis | DCIS | IDC | IDC | IDC | Fibroadenoma |
| Molecular subtype | ER-, PR-, HER2+ | ER+, PR-, HER2+ | ER-, PR-, HER2- | ER+, PR+, HER2- | ER+, PR+, HER2- |
| Neoadjuvant therapy | Pertuzumab, Trastuzumab-Anns, Docetaxel | Docetaxel, Carboplatin, Pertuzumab, Trastuzumab-Anns | Carboplatin, Paclitaxel, Pembrolizumab, Cyclophosphamide, Doxorubicin | Paclitaxel, Doxorubicin, Cyclophosphamide | / |
| Pathologic endpoints | Noncomplete response | Complete response | Noncomplete response | / | / |
HMI data processing
As described in Figure 1 a (right), channel data sampled at 31.25 MHz and stored on the Verasonics workstation were transferred to a local computer for offline processing (MATLAB R2019b, MathWorks, Natick, MA, USA). For each raster scan, a GPU-accelerated delay-and-sum algorithm was applied to reconstruct the beamformed RF lines. Residual FUS interference with the imaging bandwidth (5 to 12 MHz) was filtered using second-order Butterworth notch filters at the fundamental (4.5 MHz) and 2nd harmonic (9 MHz) of the FUS. 1D normalized cross-correlation (NCC) [ ] with cosine interpolation [ ] was then implemented to estimate the interframe axial displacements using a 4-λ window and 95% overlap [ ]. Displacement estimation with a cross-correlation coefficient lower than 0.99 was rejected and median-interpolated. For the multi-AM sequence, interframe displacements at each AM frequency were calculated between frames with the same phase shift in the corresponding AM cycle to account for the effect of different numbers of samples per AM cycle. For example, when the tracking frame rate was 3600 Hz, displacements at 400 Hz were estimated between consecutive frames (frames k and k+1), whereas displacements at 200 Hz were estimated between alternate frames (frames k and k+2, Fig. 4 a). Following that, an 18th-order infinite impulse response (IIR) bandpass filter with Hamming windowing was designed to extract the sinusoidal displacements at each AM frequency. Last, peak-to-peak (P2P) displacements were averaged over cycles to produce a P2P displacement image around the FUS focus spanning 14 mm axially and 1.2 or 1.6 mm laterally for a lateral electronic beam steering step size of 0.6 or 0.8 mm to provide overlaps between raster scans.
Next, P2P displacement images from all raster scans were normalized over the axial range to compensate for the acoustic radiation force variation over depth. The normalization curve was calculated by averaging two raster scans in the background identified on the B-mode. Therefore, the final HMI displacement map was displayed as the displacement “ratio” with respect to the averaged background displacements. For in vivo clinical scans, breath holding was not practiced promoting patient comfort, and thus, bulk motion correction between raster scans was necessary. Three plane wave frames were obtained right before each HMI raster scan. 2D NCC between neighboring beamformed RF frames was performed using a 5 × 3 mm (axial x lateral) window and step sizes of 0.2 mm in both directions [ ]. Offsets yielding the highest correlation coefficient were retrieved for motion correction. Finally, the normalized and registered raster scans were combined [ ] to form the 2D HMI displacement map.
Inclusion stiffness biomarker and size estimation
Relative tissue stiffness can be retrieved from HMI maps using the displacement ratio (DR) [ ] of inclusions or tumors to surrounding background or healthy tissues. As shown in Figure 2 , the inclusion boundary was first delineated on the B-mode (observer: YL). For phantoms, one square inclusion ROI (red) with sides measuring 0.6x the inclusion diameter and two adjacent rectangle background ROIs (green) that make up identical areas at the same depth were drawn. For biological tissues, because of the irregular tumor boundary and limited field of view in the background, ROIs were drawn with areas not necessarily equal between tumors and surrounding healthy tissues (e.g., Fig. 8 ). Using those, mean normalized HMI displacements were calculated in the inclusion ( μ i ) and background ( μ b ), and the DR was defined as μ i / μ b . Therefore, a DR of 1 indicates a mechanically homogeneous region, and DRs below 1 are anticipated in stiff inclusions as they are displaced less compared to the background. The optimized AM frequency was expected to produce consistent DR measurements for inclusions with the same mechanical properties albeit different dimensions.

Inclusion size was estimated from the HMI displacement maps in phantoms and compared to the ground truth measured on the B-mode images. First, the 2D parametric HMI map was binarized using Otsu’s method ( imbinarize function in MATLAB, threshold: 0.15 quantile of the HMI map). Next, the inclusion boundaries were extracted using the bwboundaries function, and an ellipse was fit to the extracted boundaries using the least-squares criterion ( fit_ellipse function [ ]). As shown in Figure 6 , the long and short axes of the fit ellipse were reported as axial and lateral diameters. The equivalent diameter, defined as the square root of the multiplication of axial and lateral diameters, was also reported.
Statistical analysis
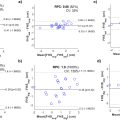
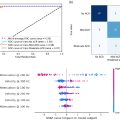
Previously, HMI displacements were found to be inversely correlated with the elastic modulus [ ]. Therefore, linear regression was performed between the inverse DR and Young’s modulus ratio of the inclusion to background with each combination of AM frequencies. The regression slope, R 2 , and root mean squared error (RMSE), as well as F-statistics of the mean squared errors (MSE) between linear fittings, were calculated in Prism 7 (GraphPad Software, La Jolla, CA, USA). 64 measurements (4 independent measurements for each inclusion configuration of 4 different diameters and 4 Young’s moduli) were considered and a p < 0.01 was considered statistically significant.
Results
Inclusion DR
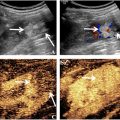
Figure 2 shows B-mode images and normalized HMI displacement maps of 22- and 56-kPa inclusions with 13.6- and 4.8-mm diameters. All obtained DRs were below 1, agreeing that the imaged inclusions were stiffer than the background (5.3 kPa). In addition, higher DRs, indicating lower HMI contrast, were obtained for the 22-kPa inclusions compared to the 56-kPa, despite a wide range of DRs measured for inclusions with the same Young’s modulus while different diameters. For instance, at 300 Hz, 48.2% and 40.4% differences in measured DRs were observed for the 22-kPa inclusions with different diameters (DRs of 0.31 and 0.46) and the 56-kPa inclusions (DRs of 0.12 and 0.17), respectively. Moreover, at 400 Hz, a 71.9% difference was seen for the 56-kPa inclusions (DRs of 0.10 and 0.17).
Figure 3 summarizes inclusion DRs for 22-, 31-, 44-, and 56-kPa inclusions with 4.8-, 8.1-, 13.6-, and 19.8-mm diameters at different AM frequencies over four independent acquisitions. Four observations were notable. First, DRs overall decrease as the inclusion’s Young’s modulus increases. Second, at some AM frequencies, e.g., 300 and 400 Hz, inclusion DRs decrease as the inclusion diameter increases; however, this phenomenon was not uniform across all AM frequencies. Third, for inclusions with a Young’s modulus ≥ 44 kPa or a Young’s modulus ratio to the background ≥ 8.3, 200 Hz produced consistent DRs (27.2% variation) across differently sized inclusions with the same Young’s modulus. Last, for inclusions with a lower mechanical contrast (Young’s modulus ≤ 31 kPa or Young’s modulus ratio ≤ 5.8), 400 Hz was otherwise required to produce a similar DR for small (diameter: 4.8 mm) inclusions as those obtained at 200 Hz for larger counterparts. Since a single AM frequency of 200 Hz was not able to characterize mechanically low-contrast inclusions consistently and 400-Hz AM was recommended for small inclusions, Figure 4 demonstrates the application of multi-AM HMI in the 4.8-mm inclusions.

Related posts:
 Strain Patterns With Ultrasound for Assessment of Abdominal Aortic Aneurysm Vessel Wall Biomechanics
 Evaluation of Renal Masses Using Contrast-Enhanced Ultrasound with Sonovue and Sonazoid
 A Bioengineered Cathepsin B-sensitive Gas Vesicle Nanosystem That Responds With Increased Gray-level Intensity of Ultrasound Biomicroscopic Images
 Automated Approach for Enhancing Fetal Head Station Assessment in Labor with Transperineal Ultrasound
 Classification of Neoadjuvant Therapy Response in Patients With Colorectal Liver Metastases Using Contrast-Enhanced Ultrasound—With Histological Pathology as the Gold Standard
 Attenuation Measuring Ultrasound Shearwave Elastography (AMUSE) as Noninvasive Imaging Biomarker for Liver Acute Cellular Rejection
Stay updated, free articles. Join our Telegram channel

Full access? Get Clinical Tree


