Abstract
Objective
Microcirculatory heterogeneity plays an essential role in the initiation and progression of glioblastoma (GBM). This study employs super-resolution ultrasound imaging to visualize the microcirculatory heterogeneity in GBM, with the objective of illustrating its predictive value in histological assessments.
Methods
This in vivo study explored the microvasculature in GBM models using 15 Sprague–Dawley rats, divided into three groups based on tumor growth stages (12, 18 and 24 d post-implantation). Ultrasound localization microscopy (ULM) was employed to assess microvascular morphology, hemodynamics and heterogeneity. Structural, functional and heterogeneity parameters at different tumor growth stages were quantified using Kruskal–Wallis H tests, or analysis of variance, followed by Bonferroni correction to characterize tumor progression. Linear correlations between these quantitative parameters and pathological indicators, including histological vascular density (VD-H), proliferation index and histological vascular maturity index (VMI-H), were evaluated. A stepwise linear regression model was constructed to assess the predictive performance in relation to histological parameters.
Results
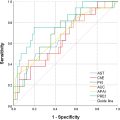
Compared to histology, ULM enabled the earlier detection of tumor progression. The quantitative parameters derived from ULM provided a more comprehensive assessment than conventional metrics such as tumor size and immunohistochemistry. Multivariate analysis exhibited significant correlations among curvature, blood flow orientation variance (OV) and VD-H. Additionally, curvature, blood flow and OV demonstrated significant correlations with the proliferation index, while blood flow and fractal dimension showed significant associations with VMI-H. Heterogeneity parameters exhibited superior predictive power for certain histological features compared to microvascular morphology and functional perfusion.
Conclusion
ULM provides a basis for early, non-invasive in vivo imaging and quantification of microvascular structures in rat GBM and demonstrates super-resolution predictive capability for histological parameters.
Introduction
Glioblastoma (GBM) constitutes over 50% of primary malignant brain tumors, with a 5-y survival rate of below 5% [ ]. It is characterized by excessive vascularization, with abnormal neovascularization manifesting as irregular vessel walls, increased permeability and hemodynamic disturbances [ ]. This process is driven by hypoxia-induced cell proliferation and involves multiple mechanisms, including inflammatory responses, genetic mutations, tumor microenvironmental changes and metabolic abnormalities. These factors disrupt angiogenic regulators, such as vascular endothelial growth factor (VEGF) and angiopoietins, resulting in immature and structurally abnormal vascular architecture. Unlike physiological angiogenesis, GBM angiogenesis is excessive, chaotic and dysregulated, leading to leaky and distorted vessel formation that inadequately oxygenates and promotes cellular invasion [ ]. Tumor cells migrate along blood vessels, causing compression and destabilization, with microvascular changes acting as early markers of invasion [ , ]. Moreover, emerging evidence indicates that VEGF-driven microvascular proliferation reduces oxygen tension and increases interstitial fluid pressure, further hindering oxygen supply and fostering resistance to chemo-, radio- and immunotherapy [ , ]. Tumor heterogeneity, both intra-tumoral and inter-tumoral, plays a crucial role in treatment resistance and lethality, with microcirculatory heterogeneity as a key driver [ ]. Anti-angiogenic therapies may normalize vasculature and inhibit tumor growth, although excessive or insufficient treatment can exacerbate invasiveness and therapeutic resistance [ , ]. As per the RANO 2.0 guidelines [ ], tumor volume changes, a common clinical metric, can require months to become evident. Therefore, relying solely on size-based criteria may be misleading, highlighting the importance of visualizing vascular dynamics for effective disease management [ ]. A detailed analysis of GBM microcirculatory heterogeneity and hemodynamic abnormalities may enable more effective therapeutic strategies and targeted treatments, ultimately enhancing patient survival and quality of life.
One of the greatest challenges in brain research is the in vivo visualization of deep vascular systems, which requires accurate quantification of microscopic structures and hemodynamics [ ]. Current technologies, however, have significant limitations. Histochemistry is invasive and does not provide insights into vascular hemodynamics, while magnetic resonance imaging (MRI), computed tomography and positron emission tomography necessitate sophisticated equipment and controlled environments. Crucially, these imaging modalities cannot discern microvasculature, which is more sensitive to tumor progression. Recent advancements in ultra-high-field MRI (7 T and above), combined with dynamic contrast-enhanced MRI and diffusion tensor imaging, have achieved spatial resolution of up to 0.3 mm, and even 0.1 mm with localized scanning and image reconstruction, significantly improving microvascular imaging precision. Despite these advancements, challenges remain, including long imaging times, contrast agent safety and image denoising [ , ]. Ultrasound localization microscopy (ULM), first reported in 2011 [ ], employs ultrasound contrast agents as strong scattering sources. By limiting the number of individual microbubbles detected per frame, ULM ensures that echoes from each microbubble do not interfere with one another. This approach enables localization accuracy of each microbubble’s center, far surpassing the system’s diffraction-limited resolution. By accumulating the motion trajectories of microbubble centers over thousands of images, vascular structures can be reconstructed with spatial resolution at the micrometer scale [ , ]. ULM thus achieves a combination of high resolution and deep penetration to a certain extent while also quantifying a wide range of blood flow velocities [ ]. These unique advantages endow it with broad application potential, particularly in the sensitive detection of low-velocity blood flow at the micron level, providing an unprecedentedly precise imaging modality for clinical use [ , ].
In this study, we present the results of a longitudinal investigation in which we initially visualized disease progression through the sensitive detection of microvascular changes. Using widely accepted histological markers and tumor size as benchmarks, we further assessed the value of ULM in tracking hemodynamic changes during disease progression, especially in its early stages, to support timely clinical treatment strategies. Specifically, ULM was validated as a surrogate imaging-based biomarker for histological characterization of tumor angiogenesis. Our results demonstrated strong linear correlations between microcirculatory heterogeneity and pathological markers, highlighting its robust predictive capacity. In summary, this study aims to visualize and characterize microvascular changes via ULM before pathological alterations occur, providing a precise and dynamic approach for assessing and predicting tumor progression.
Materials and methods
All experiments were conducted in accordance with the Animal Research: Reporting In Vivo Experiments guidelines and approved by the Animal Ethics Committee of Fudan University (Approval No. 202408008S).
Rat GBM modeling
Fifteen male Sprague–Dawley rats (Jiangsu KeyGEN BioTECH, China; Gpt, outbred, D000017; 6 wk old; 200–250 g) were utilized to establish the GBM model. The rats were divided into three groups based on different tumor growth stages (12, 18 and 24 d). They were housed in a temperature- and humidity-controlled environment with a 12-h light/dark cycle and had ad libitum access to standard rodent chow and sterilized water. A rat-derived C6 glioma cell line, sourced from the National Institutes of Health (USA), was cultured in Dulbecco’s Modified Eagle Medium supplemented with 10% fetal bovine serum and 5% penicillin-streptomycin.
C6 cells were suspended at a concentration of 5 × 10⁵/10 μL. The rats were anesthetized with an intraperitoneal injection of 60 mg/kg ketamine and xylazine. Their heads were secured in a stereotactic frame using ear bars and a nose clamp. A 25-gauge flat-tip syringe (Hamilton Company, Reno, Nevada, USA) was used to inject 20 μL of the cell suspension into the caudate nucleus. The procedure involved the following steps: A longitudinal scalp incision of approximately 0.5 cm was made at the intersection of the inner canthus line and sagittal suture, exposing the bregma and sagittal sutures. The injection site was located 3 mm to the right of the coronal and sagittal suture inter-section and 1 mm anterior to the bregma. The needle was inserted vertically to a depth of approximately 5.5 mm, and the injection was administered at a rate of 4 μL/min. After a 2-min wait, the needle was slowly withdrawn. The injection site was treated with 5% penicillin-streptomycin, and the burr hole was sealed with sterile bone wax. The incision was sutured, and the rats were then returned to their cages for further observation.
MRI pre-scanning
MRI scans were performed 1 d prior to the super-resolution experiments. Rats were positioned on a heating pad and maintained under light anesthesia with isoflurane (1%–1.25% oxygen concentration). Scans were performed using a 3.0 T MRI (uMR870, United Imaging Healthcare, 2022, China) across coronal sections. The scanning sequences included T2-weighted image (T2WI), fluid-attenuated inversion recovery (FLAIR) and diffusion-weighted imaging (DWI). Additionally, T1-weighted contrast-enhanced (T1CE) scans were acquired after administering gadopentetate dimeglumine (0.6 mmol/kg) via tail vein injection. Relevant parameters are detailed in Table 1 .
| Parameters | T2WI | FLAIR | DWI | T1CE |
|---|---|---|---|---|
| Echo time (msec) | 92.96 | 160.96 | 71 | 11.38 |
| Repetition time (msec) | 3963 | 8000 | 3902 | 1143 |
| Field of view (mm) | 60 | 60 | 80 | 35 |
| Slice thickness (mm) | 1.0 | 1.3 | 1.1 | 1.0 |
| Slices | 22 | 22 | 22 | 22 |
| Slice gap (mm) | 0 | 0 | 50 | 0 |
| Laser flip angle (°) | 90 | 90 | 90 | 90 |
| Cohesion flip angle (°) | 140 | 150 | 150 | 150 |
| Bandwidth (Hz) | 200 | 220 | 960 | 200 |
Super-resolution data acquisition
Surgical site preparation
Rats were initially anesthetized with 4% isoflurane (R510-22-10, RWD) in a gas induction chamber (R500, RWD) and maintained at 1% concentration using medical-grade oxygen. The neck fur was shaved, and the surgical area was disinfected with iodine and 70% ethanol. In the supine position, a medical-grade polyethylene catheter PE10 (inside diameter 0.28 mm, outside diameter 0.61 mm) was inserted into the right jugular vein. To prevent eye dryness, ophthalmic solution was applied while the rats were positioned prone with the head secured in a stereotactic frame. After a scalp incision, the periosteum over the exposed area was removed using a scalpel. The skull was thinned with a cranial drill (78001, RWD) until the vascular system on the brain surface became visible. Under a microscope (DOM-1001, RWD), the bone overlying the surgical area was carefully lifted using microforceps, ensuring the integrity of major vessels and the superior sagittal sinus. Hemostatic sponges were used to manage minor bleeding from superficial injuries, with sterile saline applied to minimize thermal damage, bleeding and swelling ( Fig. 1 a).

Multi-angle planar RF data acquisition
The L22-14vX LF transducer (15.625 MHz, MS200, VisualSonics Ltd., Toronto, ON, Canada) was mounted on the stereotactic frame using a three-dimensional-printed high-precision linear motor stage (VT-80 linear stage, Physik Instrumente, Auburn, MA, USA) for coronal anatomical section acquisition. Tumor locations were identified using the Mindray M10 Portable Ultrasound System (Mindray Bio-Medical Electronics Co., Ltd., China) and co-registered with MRI coronal slices. The Verasonics Vantage 256 system (Verasonics Ltd., Kirkland, WA, USA) was synchronized with the L22-14vX LF transducer, and movement was adjusted in 1-mm increments. Diluted SonoVue (Bracco Imaging, Massy, France) was administered at 5 mL and 80 μL/min via a programmable microsyringe pump (R462, RWD). The concentration was 11.8 mg/mL, and the injection process was completed within 5 min, while data acquisition lasted 300 s. The imaging sequence comprised multiple plane waves at five angles (–5°, –2.5°, 0°, 2.5° and 5°). The imaging frame rate was 1000 frames/s, with a pulse repetition frequency of 5000 Hz [ ]. Data acquisition was synchronized with a function generator, and all processing steps were performed in MATLAB R2020a (the MathWorks, Natick, Massachusetts, United States, USA, R2020a) ( Fig. 1 a). The number of scanning planes per rat is shown in Table 2 .
| Growth cycle | Model | Number of slice |
|---|---|---|
| 12 d | Rat1 | 2 |
| Rat2 | 1 | |
| Rat3 | 2 | |
| Rat4 | 1 | |
| Rat5 | 3 | |
| 18 d | Rat6 | 2 |
| Rat7 | 2 | |
| Rat8 | 1 | |
| Rat9 | 5 | |
| Rat10 | 3 | |
| 24 d | Rat11 | 2 |
| Rat12 | 2 | |
| Rat13 | 4 | |
| Rat14 | 4 | |
| Rat15 | 5 |
ULM reconstruction
Singular value decomposition filtering was applied to extract microbubble signals from the tissue background of each in-phase/quadrature dataset. To optimize clutter filtering, the threshold was determined at the inflection point of the singular value curve. Microbubble centroids were identified using the radial symmetry algorithm in MATLAB, and frame-to-frame centroid pairing and trajectory estimation were conducted using the Hungarian algorithm. The gap was set to 0, and the maximum linking distance was set to 19.712 μm, leading to a maximum detectable velocity of 197.12 mm/s. A minimum microbubble trajectory length of 15 frames was set in this study, and each acquisition was accumulated to reconstruct the vascular system via ULM. A fraction of the wavelength ( λ ) was 9.856 μm ( Fig. 1 a). Due to strong echo scattering from the ear bars or acoustic shadowing from the remaining skull sections, the vascular reconstruction of the outermost cortical regions was suboptimal [ ].
Image post-processing
Following each ULM acquisition, rats were euthanized, and brain tissues were collected for pathological examination. For each section, all other sequences (T2, DWI and T1CE) were co-registered with the FLAIR sequence. Magnetic field inhomogeneities were corrected using FMRIB’s Software Library bias field correction tool, and rigid image registration was performed using FMRIB’s linear registration tool. On the T1CE sequence, the enhanced tumor region, including necrosis, was defined as the region of interest (ROI), while on the FLAIR sequence, high-signal and abnormal-signal areas (including the tumor and edema) were defined as the ROI. ROIs were manually delineated based on the registration results and transferred onto the super-resolution images ( Fig. 1 b). Image features were extracted using the scale-invariant feature transform and wavelet transform algorithms in Fiji/Image J v.1.54f software (Wayne Rasband, National Institutes of Health, USA), and segmentation was performed using the Trainable Weka Segmentation plugin.
Vessel segmentation combined the random forest (RF) classifier with deep learning algorithms, employing a supervised semi-automated approach for efficient, precise and robust analysis. First, vascular region features, such as texture, edges and shape, were manually labeled and extracted from the images. The extracted features were then used to train the RF classifier, which utilized ensemble learning strategies and decision tree classifiers to handle noise and variability, distinguishing between vascular and non-vascular regions. Subsequently, deep learning algorithms, particularly convolutional neural networks, further automated feature extraction and vessel segmentation, enabling precise identification of complex vascular structures while maintaining robustness against image noise. Vessel features, such as area, skeleton and midpoints, were derived from binarized images using deep learning algorithms. The out-of-bag (OOB) error was calculated as the error rate for samples not used to train the decision trees. The RF used OOB samples for an internal unbiased estimate, and, to enhance the model’s generalization capability, the OOB error was controlled to remain below 5%.
Curvature is mathematically expressed as ( Equation 1 ):
Curvature=LcL
 Lc represents the actual path length of a vessel segment, and L represents the linear distance between segment endpoints.
Blood flow indicates the hemodynamic perfusion status under the assumption of Poiseuille flow ( Equation 2 ):
Q=A×V
Here, Q indicates blood flow, A denotes the vessel’s cross-sectional area, and V represents blood flow velocity.
Microvascular heterogeneity describes the spatial, morphological or functional unevenness of the microvascular network or blood flow distribution, reflecting variations in the vascular system across various conditions or locations. The fractal dimension (FD) quantifies the complexity and branching patterns within the vascular network. It is calculated using the box-counting method, which divides the image into different scales followed by linear regression analysis. To accurately capture the fractal characteristics of the image, an appropriate two-dimensional Euclidean space ( R ² > 0.99) was selected to ensure a strong correlation between the model and the actual data ( Equation 3 ).
Fractaldimension=limr→∞logM(r)log(1/r)
Related posts:
 Quantitative Analysis of Contrast-Enhanced Ultrasound Images of Brain-Dead Donor Livers: Prediction of Early Allograft Dysfunction
 Safety of Shear Wave Elastography as Evidenced From Carotid Artery Strain and Strain Rate Induced by Acoustic Radiation Force Impulse and Arterial Pulsations
 Ultrasound Shear Wave Elastography and Shear Wave Dispersion: Correlation with Histopathological Changes in Autoimmune Hepatitis Patients
 Diagnosis of Salivary Gland Tumors Using Ultrasound Radiomics
 Empirical Model of Focused Ultrasound-Mediated Treatment for Chemotherapy Delivery to Brain Tumors
 High-Frequency Ultrasound Characterization of Periodontal Soft Tissues Pre- and Post-Bacterial Inoculation
Stay updated, free articles. Join our Telegram channel

Full access? Get Clinical Tree


