The purpose of this article is to give a systematic approach to the ultrasound evaluation of superficial soft-tissue masses. The knowledge of proper technique in image acquisition, the characteristic sonographic appearances of the most common masses, their potential pitfalls, and the location of the lesions can help establish a confident diagnosis. Where the sonographic features of the masses are inconclusive, a percutaneous biopsy is effective in establishing the definitive diagnosis.
Key points
- •
This article presents a systematic approach to the ultrasound (US) evaluation of superficial soft tissue masses.
- •
The clinical history, the location of the lesion and its detailed characterization by US usually leads to a confident diagnosis.
- •
If there are inconclusive or suspicious findings by US, correlative imaging or a percutaneous biopsy should be performed.
Video content accompanies this article at http://www.radiologic.theclinics.com .
Introduction
Sonographic evaluation of superficial soft tissue masses is a common diagnostic challenge in clinical practice. A systematic approach to these masses enables effective diagnosis and minimizes errors. This article presents the authors’ preferred approach based on lesion location, grayscale appearance and Doppler features. In many cases a specific diagnosis is possible, but when US findings are inconclusive, US-guided biopsy provides a safe and accurate way to establish the etiology of the mass.
General approach to a suspected soft tissue mass
For US imagers as in all of medicine, clinical history is of utmost importance. Before the transducer is placed on the patient, the first step is to take a thorough history about the mass. If the mass is palpable, have the patient point to the area of interest. Examine the area of the mass for skin color changes, dilated vessels, or other findings in a well-illuminated environment. If the mass is not palpable, consult the correlative imaging that triggered the US such as computed tomography, MRI, or PET. It is important to know whether the mass is painful and whether it is growing or stable in size. Gather potentially relevant medical history, including prior malignancy, trauma, surgery, anticoagulation, or systemic diseases.
Imaging technique
US scanning should utilize a high-frequency linear-array transducer, typically operating within a frequency range of 12 to 24 MHz. Deeper masses may require a curved linear transducer in the 5 to 9 MHz range to enable better penetration. Generally, the transmit frequency should be set to the highest level which ensures clear visualization of the complete lesion and its surrounding tissues. For larger masses, extended field-of-view technology may be helpful to include the entire mass on a single image to show the relationship of the mass to adjacent structures and enable more precise measurements ( Fig. 1 ). Most imaging can be performed with a standard acoustic coupling gel. For very superficial masses a gel stand-off pad can be used, but it is the authors’ preference to float the transducer on a large dollop of gel.

The depth of the US image should be minimized while still including the mass and surrounding tissues. If applicable, focal zone(s) should be set at the level of the mass. The gain and time gain compensation curve should be set appropriately—the gain should be low enough to minimize artifacts but high enough so that low-level echoes in the mass are not missed. Once the grayscale characteristics of the mass have been evaluated, the next step is to assess the vascularity in and around the lesion by Doppler. Number and pattern of blood vessels should be assessed by color and/or power Doppler, which should be optimized as follows: depth should be minimized as for grayscale imaging; the color box should be the smallest that still includes the mass; color gain should be set by increasing the gain until there is color noise, then dialing it down slowly until noise first appears; and if applicable, focal zone(s) should be placed at the level of the mass. To optimize detection of slow flow, the scale and wall filter should be at the lowest level that does not cause unacceptable color noise. Spectral Doppler is an important adjunct to confirm the presence of flow within the mass and determine whether it is arterial and/or venous.
Once the mass is identified, it should be measured in 3 dimensions. The longest axis of the mass—which may not necessarily correspond to the long axis of the body—should be measured first followed by the orthogonal dimension on the same image. The transducer should then be rotated 90° and the width measured. Using the same measurement technique each time will facilitate a comparison of the mass size on any subsequent studies. If the mass is not measured the same way each time, the examiner may receive a false impression of either stability or growth.
Diagnostic pathway
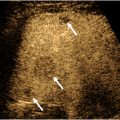
The first step in determining the etiology of the mass is localizing it to its compartment(s) of origin—skin, subcutaneous tissues, muscle, bone—as well as determining whether the mass arises from a specific musculoskeletal structure such as joint, bursa, nerve, tendon, ligament, or fibrocartilage such as labrum or meniscus. Placing the mass in a compartment requires paying attention to the anatomic layers visible on a US image ( Fig. 2 ). The beam first encounters the epidermis which creates a specular reflection but is difficult to resolve with routine scanning frequencies. The first discernible layer is generally the dermis which is hyperechoic to subcutaneous fat, which is the next layer. The subcutaneous fat layer is of varying thickness, is normally hypoechoic relative to the dermis and muscle, and often has hyperechoic septations. It is a common misconception that fat is hyperechoic on US, but there is nothing intrinsically echogenic about fat. Echoes are created by interfaces between tissues of differing acoustic impedances. Since subcutaneous fat is relatively homogenous, normal fat contains few echoes. Separating the fat from the muscle is hyperechoic fascia of varying thickness. Deep to this fascia is muscle which has a typical pattern of hypoechoic muscle bundles separated by hyperechoic fibroadipose septa in a pennate pattern.

The echogenicity of the mass should then be characterized as hypoechoic, isoechoic, hyperechoic, or mixed. Because these terms are relative, there needs to be a standard of reference. The authors recommend comparing the echogenicity to muscle since a regional muscle can almost always be imaged in the same field of view. Next, the borders should be assessed: are the borders well-defined or do they blend in almost imperceptibly with surrounding tissues? It should also be noted whether the mass attenuates the US beam, has no perceptible effect on the beam, or causes acoustic enhancement.
Is the mass cystic or solid?
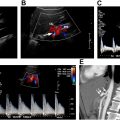
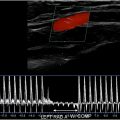
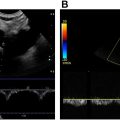
One of the most important functions of US is to determine whether a mass is cystic or solid. Although this task sounds straightforward, it can be tricky. The first thing to do is to evaluate the grayscale appearance. On average, cystic lesions tend to be relatively less echogenic than solid masses, but there are many important exceptions. Cystic masses can have echoes within them because of contents such as hemorrhage, pus, or keratin ( Fig. 3 ). Conversely, solid masses can be relatively hypoechoic or even anechoic if their cellular content is homogeneous with few acoustic interfaces ( Fig. 4 A). Because the grayscale appearance alone is unreliable, we may need to rely on other clues. Compression should be applied by the transducer in real time. A mass that changes its morphology with compression may be fluid-containing, especially if the internal echoes swirl in real time ( Fig. 5 , [CR] ). The next piece of data is the Doppler evaluation. Doppler flow is more helpful if it is present than if it is absent: internal flow confirms that the mass is at least partially solid ( Fig. 4 B), whereas flow may not be detectible within a solid mass if the flow is too slow, the internal vessels are too small, and/or the Doppler technique is suboptimal. Spectral Doppler will confirm the types of flow within the mass, arterial and/or venous. However, the shape of the arterial waveform has no predictive value regarding whether the mass is benign or malignant ( Fig. 4 C; Fig. 8 B).


A crucial fact to understand about soft tissue masses is that acoustic enhancement does not mean the mass is cystic. Because acoustic enhancement is commonly used to differentiate cystic from solid masses in organs such as the kidneys, liver, and ovaries, many radiologists incorrectly assume that this finding is also applicable to superficial masses. Unfortunately, that is not the case. In fact, in one series of superficial metastases from melanoma, 71% of the lesions had acoustic enhancement. Homogenous solid masses often attenuate the US beam less than the more heterogeneous adjacent soft tissues. Thus, acoustic enhancement must never be used to differentiate cystic from solid masses ( Fig. 6 ).

Does the mass contain fat?
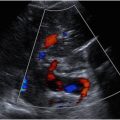
For solid masses the next step is to decide whether the mass is fatty because lipomas are so common, especially in the subcutaneous tissues. The echogenicity of lipomas ranges from hyperechoic to isoechoic to hypoechoic with respect to muscle depending on how many interfaces are created by other components such as fibrous tissue. Lipomas characteristically contain linear echogenic septations that are oriented along the long axis of the lipoma, usually parallel to the skin ( Fig. 7 ). There may be a defined capsule around the lipoma, or the borders may blend in with the adjacent soft tissues and be difficult to delineate. When applicable, bilateral comparison can be helpful to differentiate a normal lobulation of fat from a lipoma. Note that on color Doppler lipomas tend to have little or no flow. , However, there may be exceptions in which a lipoma demonstrates an atypical amount of increased flow ( Fig. 8 ). Although the vast majority of fatty masses are lipomas, well-differentiated liposarcomas may look similar to lipomas. Features raising suspicion of liposarcoma include recent rapid growth, deep location (ie, not subcutaneous), and prominent, irregularly branching vessels on color Doppler.


Related posts:

Stay updated, free articles. Join our Telegram channel

Full access? Get Clinical Tree


