Abstract
Objective
Assessing myocardial perfusion in acute myocardial infarction is important for guiding clinicians in choosing appropriate treatment strategies. Echocardiography can be used due to its direct feedback and bedside nature, but it currently faces image quality issues and an inability to differentiate coronary macro- from micro-circulation. We previously developed an imaging scheme using high frame-rate contrast-enhanced ultrasound (HFR CEUS) with higher order singular value decomposition (HOSVD) that provides dynamic perfusion and vascular flow visualization. In this study, we aim to show the ability of this technique to image perfusion deficits and investigate the potential occurrence of false-positive contrast detection.
Methods
We used a porcine model comprising occlusion and release of the left anterior descending coronary artery. During slow contrast agent infusion, the afore-mentioned imaging scheme was used to capture and process the data offline using HOSVD.
Results
Fast and slow coronary flow was successfully differentiated, presumably representing the different compartments of the micro-circulation. Low perfusion was seen in the area that was affected, as expected by vascular occlusion. Furthermore, we also imaged coronary flow dynamics before, during and after release of the occlusion, the latter showing hyperemia as expected. A contrast agent destruction test showed that the processed images contained actual contrast signal in the cardiac phases with minimal motion. With larger tissue motion, tissue signal leaked into the contrast-enhanced images.
Conclusion
Our results demonstrate the feasibility of HFR CEUS with HOSVD as a viable option for assessing myocardial perfusion. Flow dynamics were resolved, which potentially helped to directly evaluate coronary flow deficits.
Introduction
ST-segment elevation myocardial infarction is a critical type of coronary artery disease caused by complete blockage of a major coronary artery and is associated with high morbidity and mortality [ ]. Primary percutaneous coronary intervention (PCI) within 120 min of symptom onset is the preferred treatment for acute ST-segment elevation myocardial infarction, with a high success rate in re-opening blocked vessels [ , ]. However, despite successful image-proven flow restoration within the epicardial major coronary arteries, up to 60% of patients show sub-optimal reperfusion in the microcirculation, known as the ‘no-reflow’ (NR) phenomenon. The pathophysiological mechanism of NR is complex and still not completely understood [ , ]. Nonetheless, the occurrence of NR after PCI is a critical indicator of poor prognosis [ ]. Distinguishing between different vascular compartments in the coronary microcirculation may aid in further understanding NR. The coronary microcirculation can be divided into arterial and venous compartments. The arterial system consists of pre-arterioles as an intermediate compartment (diameter ∼100–500 μm) and a distal compartment (diameter <100 μm) that comprises arterioles and capillaries [ ]. The venous microcirculatory compartment consists of venules with an inner diameter below 300 μm [ , ]. The arteriolar distal compartment is where metabolic regulation of myocardial blood flow occurs. Reduced arteriolar function as well as structural remodeling are termed coronary microvascular dysfunction [ , ], which may play a distinct role in the NR phenomenon. Therefore, it may be beneficial to assess myocardial perfusion through the different compartments during or post myocardial infarction intervention so that clinicians can provide suitable pharmacological treatment, potentially improving patient prognosis [ ].
Currently, the standard clinical methods to perform myocardial perfusion imaging include cardiovascular magnetic resonance imaging (CMR), single-photon emission computed tomography (SPECT), positron emission tomography (PET), echocardiography and CT angiography. SPECT is the most commonly used technique but has limited spatial resolution and requires injection of a radioactive tracer. CMR and PET offer good technical capabilities but have limited availability and neither are bedside applicable. Furthermore, SPECT, PET and CT induce ionizing radiation, which could be harmful if performed recurrently [ ]. Similarly, CMR uses a gadolinium-based contrast agent that has raised concerns regarding nephrotoxicity [ ]. Contrast-enhanced echocardiography, on the other hand, represents a promising option for perfusion assessment as it is non-ionizing and available at the bedside. The ultrasound contrast agent consists of an inert gas-filled microbubble solution that dilutes within the entire cardiovascular system. Microbubble presence in the myocardium indicates perfusion. However, its application in clinical practice has been limited by issues related to reproducibility, variability and general poor image quality [ , ]. Current clinical implementations operate at relatively low frame rates to avoid contrast destruction due to exposure of the contrast agent to imaging pulses, and therefore provide only snap shots without the temporal resolution to show the flow of the contrast agent within the vasculature. This prevents actual imaging of the vascular structure in the myocardium and also lacks discrimination of the different flow compartments that were described above. Moreover, cardiac motion may result in a so-called flash artifact [ ], in which tissue signal ‘leaks’ into the contrast-enhanced images, potentially leading to a false-positive perfusion reading. In modern ultrasound machines, such ‘flash’ artifacts may be suppressed by image processing, but at the potential cost of also suppressing slowly moving contrast agents within the smaller vasculature.
High frame-rate (HFR) echocardiography is a recent technique in which the echographic machine is programmed to reach at least 10-fold higher frames rates than conventional mode, i.e. , approximately 500 frames per second in HFR mode versus approximately 50 frames per second in conventional mode. HFR echocardiography has the potential to enable improved assessment of microvascular flow and the NR phenomenon compared with conventional line-by-line imaging, as the high frame-rate technique can better distinguish between the fast-moving heart wall and various blood flow velocities. A previous study by Maresca et al. [ ] demonstrated the possibility of mapping coronary epicardial and pre-arteriole compartments without the use of ultrasound contrast agents using HFR echocardiography. However, use of a linear array probe limited the imaging depth to 3-4 cm, and the larger probe footprint resulted in an unconventional view that was unable to image the entire left ventricular wall due to rib shadowing. Furthermore, the SVD clutter filter [ ] that was used could not detect the nearly stationary flow within the arteriole compartment. To improve the sensitivity of echocardiography to detect flow, contrast agents can be injected intravenously. Demeulenaere et al. [ ] showed that it is possible to visualize and assess coronary arterioles with HFR contrast-enhanced echocardiography (CEUS). However, they used a small-animal model (rats) where they used high-frequency transmission and pulse repetition frequency to obtain high-quality images not feasible for human application. Studies using HFR CEUS to assess perfusion in a large-animal model, as well as human feasibility demonstration, have been performed by Toulemonde et al. [ , ]. They showed that HFR CEUS was able to continuously obtain contrast signal throughout the cardiac cycle, yet without further discrimination of flow within the coronary microvasculature. In a recent paper [ ], a first in-human proof of concept for imaging the vascular structure using HFR imaging and so-called super-localization was presented to visualize the arterial structure within hypertrophic hearts in the diastolic phase, during which limited cardiac motion was present.
We previously developed a novel contrast detection scheme using higher order singular value decomposition (HOSVD) combined with HFR CEUS that enhances image quality and enables visualization of fast and slow coronary circulation throughout the cardiac phases (systole and diastole) [ ]. In the current study, we used a porcine model with induced occlusion of the major coronary artery to assess the technique’s ability to detect perfusion deficit and hyperemia, which is pivotal for assessing myocardial infarction and/or microvascular defect. To support discrimination between the two, we applied an earlier technique to differentiate fast and slow flow [ ], in which fast flow presumably corresponds to the coronary macro-circulation, pre-arterioles and small coronary veins, and slower flow corresponds to the arterioles, capillaries and venules [ ]. Additionally, we used a destruction sequence to rule out false-positive contrast detection in the myocardium. By evaluating the dynamics of myocardial coronary flow throughout the cardiac phases in the occlusion model, we demonstrated the feasibility of HFR CEUS to be a viable option for assessing myocardial perfusion and its deficit.
Methods
Porcine model
A female Yorkshire x Norwegian Landrace pig (38 kg) was used for the experiment, which followed European Union and institutional guidelines for the care and use of laboratory animals; Centrale Commissie Dierproeven approval no. AVD1010020172411 (SP2100125). The animal was first sedated using Zoletil 50 (6 mg/kg), Xylazine (2.25 mg/kg) and Atropine (0.03 mg/kg), then put under full anesthesia using pentobarbital (10–15 mg/kg/h), intubated and mechanically vented. The animal was positioned in a supine position with vital signs monitored. Two more pigs of similar weight received the same treatment, leading to the results presented in Supplementary Figure 1 .
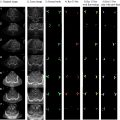
A diluted (1:30; i.e. , containing a maximum of 4 × 10 8 microspheres per ml) Definity solution (Lantheus Medical Imaging Inc., MA, USA) was continuously infused through the jugular vein at 1.5 ml/min. The acquisitions were performed by direct cardiac access after sternotomy, where a water-filled plastic bag was used to ensure sufficient acoustic contact between the probe and heart; the resulting stand-off was a few millimeters. A Sprinter over-the-wire balloon dilatation catheter (Medtronic Inc., MN, USA) was placed in the proximal part of the left anterior descending coronary artery right after the first secondary branch, such that the heart would still beat during occlusion (for ethical considerations), yet maintaining a sufficiently large non-perfused area. Angiography was used to verify the catheter location and as a reference for monitoring the occlusion ( Fig. 1 a, 1 b). Additionally, a clinical scanner (Zonare ZS3, P7-3 probe, Mindray Innovation Center, CA, USA) was used as a reference for image quality comparison ( Fig. 1 c, 1 d). During the procedure, the left anterior descending artery (LAD) was transiently occluded by inflating the balloon for 4 min. HFR CEUS acquisitions were performed before, during and after release of the occlusion.

HFR ultrasound acquisition and data processing
Data were acquired using a phased-array P7-4 probe (ATL Philips, Bothell, WA, USA; Fc = 5.2 MHz) connected to a research scanner (Vantage 256 system, Verasonics, WA, USA). As detailed in [ ], high frame rate recordings consisted of three overlapping diverging waves that were sequentially transmitted from three non-overlapping sub-apertures (21 elements per sub-aperture) , and a three-pulse checkerboard AM sequence was transmitted from each sub-aperture. A frame was built from the nine combinations of the three AM pulses and three sub-aperture transmissions; with a pulse repetition frequency of 4.5 kHz, this yielded a final frame rate of 500 Hz. The sequence consisted of 1 s HFR recordings, followed by high-intensity scanning-focused beams for microbubble destruction (21 cycle pulses at 5.2 MHz), and then a subsequent 4 s of repeated HFR recordings. Channel data were beamformed offline using the Ultrasound Toolbox [ ] in Matlab (R2022A, 2022; MathWorks, MA, USA) on a 0.5 λ resolution grid. Mechanical index (0.3 dB/cm/MHz derated) values of the imaging and destruction pulses were 0.08 and 0.6 at 5 cm depth, respectively.
We post-processed the data using HOSVD with spatial, temporal and transmit pulses as input dimensions. First, the images from the three sub-apertures were coherently compounded, and then HOSVD was implemented on an ensemble of 20 frames. The in vivo spatial rank selection algorithm was implemented based on the gradient of spatial mode singular values using the local peak as a threshold to separate contrast signals from tissue signals, as described earlier [ ]. Further, we clustered temporal ranks to distinguish between fast and slow flows in the coronary circulation [ ]. Although eigenvectors theoretically contain signals with a range of frequencies from 0 Hz up to the Nyquist frequency, in practice each eigenvector has a dominant range of visible frequencies; e.g. , in Figure 8a in . Clustering was done by selecting the HOSVD ranks with a dominant frequency component either above or below 75 Hz. Doppler frequency corresponds to 10 mm/s axial velocity at the used center frequency of 5.2 MHz and speed of sound of 1540 m/s; in practice, by manual tracking we found that approximately half of all detections after ‘fast-flow filtering’ had a velocity over 10 mm/s, and 90% of detections had a velocity over 5 mm/s. Our assumption was that a flow faster than 10 mm/s was present in the coronary arteries, pre-arterioles and coronary veins, while slower flow was present in the arterioles, capillaries and venules [ ]. Data are presented during systole and diastole. Opposite to dominant perfusion characteristics in the rest of the body, myocardial venous flow is expected to be more dominant during systole, and myocardial arterial flow is expected to be dominant during diastole [ ].
Results
Images that show pre-occlusion, occluded LAD and post release (hyperemia) scenarios during diastole are shown in Figure 2 . In these images, slow and fast-flow representations are superimposed, where the hot colormap represents slow flow (below the frequency cut-off) while grayscale represents fast flow (above the frequency cut-off), presumably corresponding to flow in the arterioles/veins and pre-arterioles, respectively. The occlusion model mostly affects the apex and the upper half of the interventricular septum, as can be seen by the absence of contrast detection in the cyan boxes in Figure 2 when the balloon was inflated to occlude the LAD.

Related posts:
 WFUMB Commentary Paper on Artificial intelligence in Medical Ultrasound Imaging
 Quantitative Liver Fat Assessment by Handheld Point-of-Care Ultrasound: A Technical Implementation and Pilot Study in Adults
 Automatic Segmentation of Sylvian Fissure in Brain Ultrasound Images of Pre-Term Infants Using Deep Learning Models
 Added Value of Dynamic Contrast-Enhanced Ultrasound Analysis for Differential Diagnosis of Small (≤20 mm) Solid Pancreatic Lesions
 Ultrasonographic Measurement of Common Carotid Artery Wall Pulse Dynamics and Longitudinal Motion – Method Validation and a Novel Parameter Ratio
 Intraoperative Real-Time IDH Diagnosis for Glioma Based on Automatic Analysis of Contrast-Enhanced Ultrasound Video
Stay updated, free articles. Join our Telegram channel

Full access? Get Clinical Tree


