Abstract
Objective
There are over 9000 liver transplants in the United States per year, with acute cellular rejection (ACR) being a prevalent early post-transplant complication (20%–40%) treated using corticosteroids. Ischemia-reperfusion injury (IRI), another early post-transplant pathology, has similar laboratory results but typically resolves without therapy. ACR confirmation requires invasive liver biopsy, bearing risks like hemorrhage and pneumothorax. Attenuation Measuring Ultrasound Shearwave Elastography (AMUSE) assesses shear wave velocity ( c ) and attenuation (α) without rheological models and have shown potential for noninvasive tissue characterization.
Methods
We analyzed 58 transplanted livers suspected for ACR by comparing AMUSE measurements to biopsy findings. Thirteen patients underwent longitudinal tracking from ACR diagnosis on day 7 to therapy initiation and repeat biopsy on day 14. Statistical methods and support vector machine (SVM) were used for performance analysis.
Results
AMUSE measurements at 100, 200, and 300 Hz showed statistical significance ( p < 0.001) for ACR presence, with 200 Hz exhibiting the highest Spearman correlation coefficients for c and α (0.68 and -0.83). High c (> 2.2 m/s) and low α (< 130 Np/m) at 200 Hz correlated with ACR diagnostic, while low c and high α indicated no ACR. Combining c and α into a single biomarker α/ c improved patient differentiation, yielding an F1-score of 0.97. SVM was used to evaluate AMUSE ACR staging capabilities using all available frequencies, reaching 0.95 F1-score for categorical classification, with an AUROC of 0.99. When evaluating the presence of ACR the SVM reached 0.99 F1-score, with 1.00 sensitivity/recall.
Conclusion
These findings support the use of AMUSE potential for detection and staging of liver ACR.
Introduction
According to the Scientific Registry of Transplant Recipients, more than 9000 liver transplants are performed each year in the United States with the current 1-year, 5-year and 10-year mortality rates of 7.8%, 18.8% and 35.9%, respectively [ ]. One of the most common complications in the early post-transplant period is acute cellular rejection (ACR), occurring in 20%–40% of patients [ ].
Acute cellular rejection (ACR) is most commonly seen within 3 to 6 months after liver transplantation [ ]. ACR can be asymptomatic or present with nonspecific symptoms including fever, malaise, abdominal pain, and hepatosplenomegaly. Liver chemistries often show elevations in serum aspartate transaminase (AST), alanine transaminase (ALT), alkaline phosphatase (ALP), gamma-glutamyl transpeptidase (GGT) and bilirubin levels. However, the changes in blood test values are neither sensitive nor specific for ACR and do not correlate with the severity of the rejection [ ]. In case of suspicious blood work findings (e.g. ALT > 80 U/L), needle biopsy of the liver remains the gold standard for diagnosing ACR and monitoring therapy response [ ]. The treatment for mild ACR is an increase in dosing of existing immunosuppression, while the treatment for moderate to severe ACR consists of intermittent high dose steroid therapy [ , ].
The clinical presentation of ACR is nonspecific and is similar to ischemia-reperfusion injury (IRI). IRI, another common acute post-transplant liver pathology, is preservation injury caused by interruption in tissue oxygenation during organ translocation. IRI typically presents elevations in ALP and GGT, without a significant increase in bilirubin. IRI is a transient self-limited tissue preservation injury that requires supportive treatment only. Given the differences in therapy and prognosis for ACR and IRI, distinguishing the two is very important. Currently, differentiating between IRI and ACR requires liver biopsy, as it is not possible to distinguish the two pathologies based on imaging and blood tests alone [ ].
Needle biopsies are invasive, carry the risk of infection and sepsis [ ], biliary strictures [ ], hemorrhage and mortality [ ]. In addition, needle liver biopsies are limited by sampling variability and inter-observer variation in histological interpretation [ , ]. According to the current clinical protocol, if serum liver enzymes remain elevated (usually ALT > 80 U/L) on day 7 post-transplant, patients undergo a liver biopsy to diagnose ACR versus IRI. Approximately 50% of biopsied patients have ACR. Almost all patients with ACR undergo multiple liver biopsies during treatment to evaluate therapy response, which significantly increases the probability of complications. Noninvasive methods to identify ACR with high sensitivity and specificity would eliminate the risks associated with biopsy while allowing for more frequent evaluation of treatment response. As an example, blood oxygen level-dependent (BOLD) magnetic resonance imaging (MRI) was shown to detect ACR with sensitivity and specificity above 82% [ ]. Whereas the decrease in Doppler ultrasonography measured portal blood velocity has been associated with poor treatment response in patients with ACR after transplant [ ].
Elasticity imaging has emerged as a modality that can noninvasively evaluate the viscoelastic mechanical properties of soft tissue [ , ]. To date, the most important clinical application remains liver fibrosis staging and numerous studies have been conducted in this field [ ]. Magnetic Resonance Elastography (MRE) has outstanding performance for liver fibrosis staging [ ] but is expensive and less widely available. Ultrasound is already used for routine liver imaging so ultrasound-based shear wave elastography (SWE) is an attractive alternative to MRE for large-scale screening and follow-up. Among the ultrasound SWE methods, Acoustic Radiation Force Impulse (ARFI) shear wave imaging and Supersonic Shear Imaging (SSI) are available on clinical ultrasound scanners and provide real-time 2D B-mode imaging for measurement guidance. Fibroscan uses the transient elastography (TE) approach by introducing a mechanical wave and measuring wave velocity to report Young’s modulus [ ]. ARFI, TE, and SSI have been extensively studied in the diagnosis of significant fibrosis of native livers [ , ], but their role in the transplanted liver is becoming increasingly recognized.
In a study of 117 post-transplant livers in children, Goldschmidt et al. [ ] found an increase in baseline values of shear wave velocity in healthy transplants compared to values in healthy children and adult livers. Liver stiffness measurement (LSM) by point SWE has been shown to be higher in patients with ACR or chronic hepatitis than in patients without rejection more than 4 wk after transplant. However, within 4 wk of transplant, there was no significant difference in LSM in patients with and without ACR, which may be due to point SWE’s inability to differentiate ACR and IRI [ ]. In a study by Crespo et al, LSM by transient elastography was associated with severity of ACR in liver transplant patients, although the sample size was small [ ].
Most elastography techniques assume that tissue is purely elastic and ignore tissue viscosity. All the velocity-derived estimates of elasticity but also fails to report a potentially important tissue parameter. Some methods measure shear wave velocity at several frequencies (phase velocity dispersion) and fit a rheological model to the velocity dispersion curve to estimate elasticity and viscosity [ , ]. A major drawback of this approach is that such simplified models assume a fixed relationship between shear wave velocity and attenuation strictly based on the shear wave velocity measurements alone and without any knowledge of shear wave attenuation. An inaccurate rheological model may mask physiological and pathological changes in tissues and fail to provide clinically useful diagnostic information even when such changes are significant and tangible. The use of rheological models for viscosity evaluation largely stems from the inability to make stable and reproducible measurements of shear wave attenuation. The only appropriate approach for true measurements of tissue viscoelasticity requires independent measurements of shear wave velocity and attenuation. While shear wave attenuation measurement methods have been applied to fatty liver disease, also referred as steatosis [ ], data on their use in transplanted livers is lacking.
We have previously reported theoretical development and technical application of Attenuation Measuring Ultrasound Shearwave Elastography (AMUSE), a SWE technique that measures both shear wave velocity and attenuation [ ]. We showed that AMUSE can be used in vivo to separate post-transplant livers with and without ACR as diagnosed with needle biopsy in 15 patients at multiple excitation frequencies. The findings showed that higher shear wave velocity and lower shear wave attenuation hold significance for ACR presence, while lower shear wave velocity and higher shear wave attenuation are correlated in patients without ACR. We showed that shear wave velocity and attenuation values correlate well with biopsy findings, and that using shear wave velocity and attenuation together improved the ability to separate ACR from no ACR livers than shear wave velocity and attenuation individually [ ]. Here, we evaluate the use of AMUSE as a non-invasive alternative to differentiate ACR from IRI. The AMUSE findings were compared with the gold standard diagnosis (liver biopsy), to validate its efficacy. In patients with ACR, we also assess the ability of AMUSE to track response to corticosteroid therapy.
Methods
Attenuation measuring ultrasound shearwave elastography (AMUSE)
The AMUSE technique was first developed and validated by our group [ ]. As shown in Figure 1 a, AMUSE uses focused ultrasound radiation force (ARF) along the z –axis to excite shear waves in the tissue of interest (in this case, liver). The excitation force is in the form of a short impulse that is 600–900 μ s in duration and is usually focused down the middle of the transducer (Tx). This impulsive ARF perturbs the liver and creates shear waves that propagate cylindrically outward along the x –axis, perpendicular to the z –axis. The amplitude of the waves along the x –axis is on the order of a few micrometers. Following the wave excitation, the probe is switched to a rapid imaging mode to measure the wave propagation at the frame rate of 2-4 kHz. This allows us to track shear wave propagation as a function of time ( t ) and distance ( x ) in the x – z plane ( Fig. 1 b). A two-dimensional Fast Fourier Transform (2D FFT) of the tissue motion ( Fig. 1 b) yields the k-space ( Fig. 1 c) whose coordinates are the frequency ( f ) and the wave number ( k x ). Shear wave velocity ( c ) and attenuation ( α ) at any frequency ( f 0 ) can be calculated by finding the energy peak at f 0 and using the coordinates and shape of the peak along the f and k x axes. The velocity ( c ) at f 0 is equal to f 0 / k 0 , where f 0 and k 0 are the coordinates of the peak.

The attenuation ( α ) is calculated using α = ( π / 3 ) * F W H M , where FWHM is the full-width at half maximum of the peak along the wave number ( k x ) axis ( Fig. 1 d). Measurements of shear wave velocity and attenuation can be made at multiple frequencies of shear wave propagation at tissue depths in the range 3–6 cm. The use of FWHM to measure shear wave attenuation assumes that the propagated shear wave is a plane wave. Because the wave front due to ARF is a cylindrical wave, the wave motion is multiplied by √x, where x is the propagation distance, before performing the Fourier transform. The application of the correction factor (√x) has been validated theoretically and experimentally [ ]. The comparative studies between AMUSE and laboratory gold standards for assessing shear wave velocity and attenuation in finite element models, polyvinyl alcohol (PVA) phantom and an excised pig liver were in good agreement [ ].
Liver patient study
During the study 62 subjects provided written informed consent for a protocol (15-03367) approved by the Mayo Clinic Institutional Review Board (IRB) and was in compliance with the ethical principles outlined in the Declaration of Helsinki. Four subjects had to be excluded from the study after consent for the following reasons: Abdominal wound opened (N = 1); The research coordinator was not able to schedule the scan before the biopsy procedure (N = 2); Sonographer was not available to perform the scan (N = 1). A GE Logiq E9 ultrasound scanner (General Electric Company, Boston, MA, USA) was used to measure shear wave velocity and attenuation in 58 subjects ( Table 1 ) for a maximum of 4 biopsy visits, totaling 82 scans.
| Patients (n = 58) | ||
|---|---|---|
| Number | % | |
| Sex | ||
| Male | 42 | 72.4 |
| Female | 16 | 27.6 |
| Race | ||
| White | 49 | 84.5 |
| Other | 9 | 15.5 |
| Donor Type | ||
| Deceased | 56 | 96.6 |
| Living | 2 | 3.4 |
| Mean (Std. Dev) | Range | |
| Age, years | 51.29 (12.36) | 20-70 |
| BMI, kg/m 2 | 27.65 (4.49) | 19.35-38.69 |
| ALT, U/L | 182.44 (134.16) | 30-821 |
The specific parameters related to the generation and measurement of the shear waves with the Logiq E9 are proprietary. The focused acoustic radiation force push beams were simultaneously applied on both sides of the region-of-interest (ROI) such as in the comb push ultrasound shear elastography (CUSE) method [ ]. The position of the ROI was determined by the user. The motion detection is performed with focused beams as described in the Song, et al. study related to time-aligned sequential tracking.
For each liver allograft, 20 AMUSE measurements of shear wave velocity and attenuation were made at 100, 200, and 300 Hz. The measurements were made by an experienced sonographer in multiple parts of the liver to capture potential variations in liver mechanical properties. Measurements were performed on fasting (≥ 4 h) patients through intercostal spaces with the patient lying in the supine position and the right arm in maximal abduction. Twenty measurements were obtained in vessel free areas of the liver parenchyma (at least 15 mm below the liver capsule) during live B-mode imaging guidance All measurements were made at slightly different planes at a single intercostal window during a temporary breath hold in a neutral position to reduce the variability due to endogenous movement [ ]. The entire procedure took 10–15 min. Vessels were also avoided during the scans to minimize scattering artifacts. The in-phase/quadrature (IQ) data of each scan was then stored for AMUSE evaluation. Because the liver can be approximated as a homogeneous media at the resolution level utilized by medical ultrasound, the median value was taken from the 20 measurements to purge outliers. The 20 AMUSE measurements are feasible clinically, as the procedure can be performed at bed side and cause little to no discomfort.
The parameter α/c, composed by the attenuation/velocity ratio at a given frequency, was idealized in this study as a potential discriminatory index encompassing both attenuation and velocity in a single index, and therefore making clinical adoption easier. It does not hold physical interpretation. The frequency used for the index calculation was chosen based on the best diagnostic separation when evaluating attenuation and speed separately. All IQ data and AMUSE parameters computation were performed in MATLAB (Mathworks, Natick, MA, USA).
Acute cellular rejection (ACR) response to therapy studies
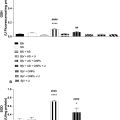
Liver transplant recipients with ALT > 80 U/L on day 7 post-transplant undergo needle biopsy, per clinical protocol to differentiate ACR from IRI. The biopsied tissue is prepared and stained to be read by a pathologist for assessment of ACR. The biopsy procedures had a duration of under 30 min to be completed and the reports were issued in a matter of hours depending on nephropathologist availability. Patients with ACR on day 7 undergo intravenous methylprednisolone therapy and are reassessed with liver function tests (LFTs) and biopsy on day 14. LFTs are the screening tool and biopsy is the current clinical gold standard for ACR diagnosis. All patients with ACR were scanned on day 7 and 14, while nine patients in the cohort were scanned one or two times between days 7 and 14. The overall timeline of events is shown in Figure 2 . AMUSE measurements were compared with biopsy findings. Results from nine patients (P1–P9) with ACR on day 7 and following steroid therapy on day 14 are shown in Figure 4 . Based on biopsy findings, patients 1–5 responded well to treatment. Patients 6–9 did not respond well to therapy according to biopsy findings. The biopsy result distributions are shown in Table 2 .

| Patients | % | |
|---|---|---|
| No ACR | 48 | 58.5 |
| ACR present | 34 | 41.5 |
| Mild ACR | 27 | 32.9 |
| Moderate ACR | 7 | 8.5 |
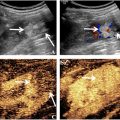
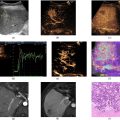
Liver biopsy is pivotal in distinguishing acute cellular rejection (ACR) from ischemia-reperfusion injury (IRI) following liver transplantation. A biopsy sample, obtained via percutaneous needle insertion, undergoes histopathological examination where distinguishing features are identified. Histological features of ACR are (i) portal inflammation with inflammatory cells typically composed of lymphocytes and occasionally eosinophils infiltrating the portal areas (periportal and/or intralobular inflammation) ( Fig 3 b); (ii) bile duct epithelial cell damage with accompanied by apoptosis programmed cell death and potential loss of bile ducts; (iii) central vein inflammation in more severe cases of ACR; (iv) endothelialitis manifested by inflammation of the endothelial cells lining the blood vessels. These features are graded according to severity and distribution to help classify the rejection episode (mild, moderate, severe).

Histological features of IRI are (i) centrilobular necrosis with hepatocytes around the central vein undergoing apoptosis due to ischemia during the ischemic phase closely followed by reperfusion injury; (ii) sinusoidal dilatation and congestion due to impaired blood flow during the ischemic phase; (iii) hepatocellular swelling and vacuolation. Unlike ACR, IRI classically lacks significant portal inflammation and bile duct damage ( Fig 3 a). Histopathological evaluation, supported by clinical context and ancillary tests, aids in accurate diagnosis, and guides appropriate therapeutic interventions [ ].
Data Analysis
Shapiro-Wilk test was performed to evaluate if the AMUSE measurements followed normal distribution, then the Mann-Whitney U test was used to assess statistical difference between the rank sums of parameters for c and α in patients with and without ACR. Needle biopsy findings were considered as the gold standard. To evaluate the correlation between the shear wave measurements and the severity of ACR (no ACR, mild or moderate) the Spearman’s rank coefficient was used. The Spearman’s correlation coefficient measures the strength and direction of association between two ranked variables. The Spearman’s correlation is well suited for ordinal (not continuous) variables, such as ACR severity, by only requiring monotonicity, but not linearity. All statistical computations were performed in MATLAB (Mathworks, Natick, MA, USA).
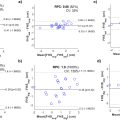
To assess the value of AMUSE measurements for separating the two groups to obtain a reliable diagnosis, we conducted a statistical analysis based on the Hotelling trace criterion [ ]. The Hotelling trace criterion measures the goodness of clustering and separation of groups (a larger value means better separation) and was used to evaluate the ability of AMUSE to separate the liver transplant patients with and without ACR based on velocity, attenuation, and combination of velocity and attenuation. The AMUSE measurements area under the receiver operating characteristic (AUROC) curve and F1-score (eq.1-3) for ACR detection were evaluated in addition to the ranked correlation to the biopsy staging using the Spearman’s coefficients ( Table 3 ). We studied the use of α / c ratio ( Fig. 4 c) as a biomarker to separate livers with and without ACR. The optimal α/c biomarker threshold for presence of ACR was estimated from the α/c receiver operating characteristic (ROC) curve using the Youden’s index.
Related posts:
 Strain Patterns With Ultrasound for Assessment of Abdominal Aortic Aneurysm Vessel Wall Biomechanics
 Evaluation of Renal Masses Using Contrast-Enhanced Ultrasound with Sonovue and Sonazoid
 A Bioengineered Cathepsin B-sensitive Gas Vesicle Nanosystem That Responds With Increased Gray-level Intensity of Ultrasound Biomicroscopic Images
 Automated Approach for Enhancing Fetal Head Station Assessment in Labor with Transperineal Ultrasound
 Classification of Neoadjuvant Therapy Response in Patients With Colorectal Liver Metastases Using Contrast-Enhanced Ultrasound—With Histological Pathology as the Gold Standard
 Ultrasound and Gold Nanoparticles Improve Tissue Repair for Muscle Injury Caused by Snake Venom
Stay updated, free articles. Join our Telegram channel

Full access? Get Clinical Tree


