Cardiac Magnetic Resonance Imaging in Coronary Artery Disease
Kim Arellano-Villarreal
Raymond Q. Migrino
Cardiac magnetic resonance imaging (CMR) is an established modality in the comprehensive assessment of coronary artery disease. The advantages of CMR over other imaging modalities include high spatial resolution, lack of exposure to ionizing radiation, ability to acquire unlimited imaging planes, and the ability to characterize tissues. Perhaps most importantly is its versatility in the assessment of clinical questions relevant to ischemic heart disease, ranging from myocardial function, perfusion, viability, coronary stenosis, and sequelae of myocardial infarct, including presence of left ventricular aneurysm or pseudoaneurysm, thrombus, and valve dysfunction.
Basic Principles, Image Acquisition, and Safety
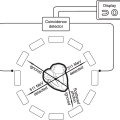
Cardiac magnetic resonance imaging is based on the exploitation of the magnetization properties of hydrogen protons to acquire images. In the presence of the powerful magnetic field provided by the MRI scanner, frequently 1.5 Tesla (with increasing use of 3 Tesla), the body’s protons align with the magnetic field with fewer aligned in the direction opposite the external magnetic field; a net magnetization is created with precession (spin) of protons in the direction of the external field. To create an image, brief external radiofrequency pulses at a resonant frequency dependent on the proton’s gyromagnetic ratio (an intrinsic property of the proton) and magnetic field strength are applied. The radiofrequency pulse causes the hydrogen protons to absorb energy, causing disruption of their net magnetization. Once the radiofrequency pulse is turned off, the protons return to their original alignment to the external magnetic field. Receiver coils on the surface of the body detect the changes in magnetization that occur as the protons realign and convert it into electrical signals that form the basis of MRI images. Spatial localization of the signal is accomplished using gradient coils that create subtle differences in regional resonant frequency in three dimensions. Radiofrequency pulses are repeated until enough signals are acquired to form an image.
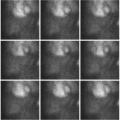
The two basic pulse sequences in CMR are “dark blood” or spin echo sequence, where the blood pool appears dark against a bright myocardium, and “bright blood” or gradient echo sequence (the most frequently used is the steady state free precession gradient echo), where the blood pool appears bright against a dark myocardium (Figure 6.1). In general, dark blood imaging is used for structural evaluation, and bright blood imaging (with the use of cine, or dynamic, imaging) is used for functional evaluation.
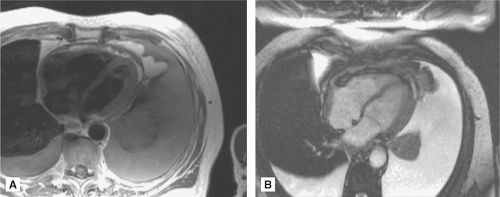 FIGURE 6.1 Cardiac magnetic resonance imaging pulse sequences. (A) Spin echo (“black blood”) imaging in the axial plane in the mid-ventricle. Note the suppression of blood pool signal and clear delineation of myocardial region. There is a large left pleural effusion and small right pleural effusion. (B) Gradient echo (“bright blood”) imaging. This is a steady state free precession sequence showing bright blood pool. Note the contrast between the blood pool and the myocardium. This sequence is frequently used for cine functional imaging. |
Unlike other MRI techniques, central to cardiac imaging is the need for electrocardiographic (ECG) gating because of cardiac motion. Because of the low signal of the precessing protons, multiple radiofrequency pulses and signal acquisitions are needed to form an image, frequently requiring multiple heartbeats acquired in one breath hold. Thus, unlike echocardiography, most MRI sequences rely on images averaged over several heart beats and are not acquired in real time. Although real time imaging currently exists in CMR, the temporal resolution required for such acquisition comes at the expense of spatial resolution, thus real time
imaging is not frequently used in most diagnostic sequences. Cardiac motion in most protocols is compensated for with the use of ECG gating, and respiratory motion is addressed by acquiring images while the patient is holding a breath.
imaging is not frequently used in most diagnostic sequences. Cardiac motion in most protocols is compensated for with the use of ECG gating, and respiratory motion is addressed by acquiring images while the patient is holding a breath.
Magnetic resonance imaging is one of the safest noninvasive imaging modalities and does not involve ionizing radiation. The only absolute contraindication to CMR involves patients with ferromagnetic materials such as pacemakers, defibrillators, cerebral aneurysm clips, etc. Another contraindication is severe claustrophobia. Patients with prosthetic cardiac valves (except for older models of ball and cage design with ferromagnetic materials) and established cardiac stents are deemed safe for CMR. A relative contraindication for CMR includes pregnancy, as potential risks to the fetus are not well established. Recently, there have been isolated and rare reports about the development of nephrogenic systemic fibrosis, manifesting as swelling and tightening of the skin in patients with moderate to end-stage renal dysfunction who received gadolinium-based contrast agents. Until this is further studied, there is a Food and Drug Administration advisory against the use of gadolinium agents in patients with significant renal dysfunction. For more complete information on MRI safety, an excellent resource is www.mrisafety.com.
Evaluation of Ventricular Size and Function
Cardiac magnetic resonance imaging is superior to other modalities for quantification of ventricular size and function, and is deemed the gold standard noninvasive modality to measure these parameters. It has high spatial resolution, unlimited imaging planes, and image quality is not affected by body habitus. Ventricular volume and function is derived using the stacked disc method (modified Simpson’s method), a true volumetric measure that does not rely on geometric assumptions that may not be applicable to certain ventricular shapes, such as dilated left ventricles, or the many variations of normal right ventricular shape (Figure 6.2). Compared with echocardiography, CMR had superior interstudy reproducibility in the assessment of ventricular volumes, function, and masses in normal and diseased hearts.1 The steady-state free precession gradient echo is the pulse sequence of choice for evaluating ventricular function because of the excellent contrast between ventricular blood pool and cardiac
muscle. Ventricular volumes and ejection fractions can be calculated with the use of various commercially available analysis software packages using both manual or automated endocardial border detection. Established normal values are presented in Table 6.1.2
muscle. Ventricular volumes and ejection fractions can be calculated with the use of various commercially available analysis software packages using both manual or automated endocardial border detection. Established normal values are presented in Table 6.1.2
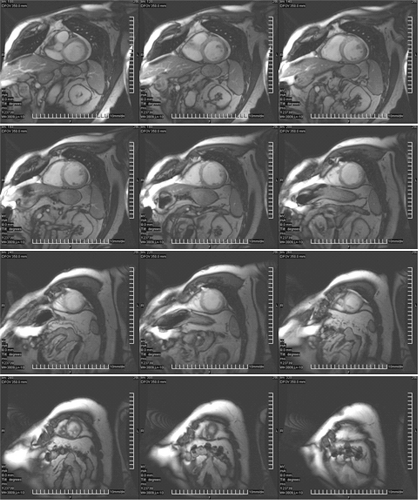 FIGURE 6.2 Multislice short axis evaluation of the left and right ventricular function. Sequential short axis thin slices of the ventricles are obtained on cine steady-state free precession. Using manual or semiautomated methods of border detection, endocardial border is traced throughout the cardiac cycle. Ventricular volumes and ejection fraction are calculated using modified Simpson’s method (stacked disc method). |
TABLE 6.1 Normal Ventricular Parameters Using Cardiac Magnetic Resonance Imaging | ||||||||||||||||||||||||||||||||||||||||||||||||||||||
|---|---|---|---|---|---|---|---|---|---|---|---|---|---|---|---|---|---|---|---|---|---|---|---|---|---|---|---|---|---|---|---|---|---|---|---|---|---|---|---|---|---|---|---|---|---|---|---|---|---|---|---|---|---|---|
| ||||||||||||||||||||||||||||||||||||||||||||||||||||||
Similar to echocardiography and nuclear methods, regional wall motion abnormalities are assessed and reported using the standard 16- or 17-segment model. In addition to steady-state free precession sequence, myocardial tagging can also be used to evaluate cardiac motion (Figure 6.3). With this technique, spatial saturation bands are applied during the pulse sequence, resulting in dark lines or a crosshatched grid pattern that is superimposed on the
ventricular myocardium throughout the cardiac cycle. Deformation of the tag lines during ventricular contraction may aid in evaluation of normal or abnormal regional wall motion. Lack of deformation of the tag lines suggests a region of nonfunctioning myocardium. Although now infrequently used for assessment of regional function, tagged cine MRI can be used for calculation of regional strain.
ventricular myocardium throughout the cardiac cycle. Deformation of the tag lines during ventricular contraction may aid in evaluation of normal or abnormal regional wall motion. Lack of deformation of the tag lines suggests a region of nonfunctioning myocardium. Although now infrequently used for assessment of regional function, tagged cine MRI can be used for calculation of regional strain.
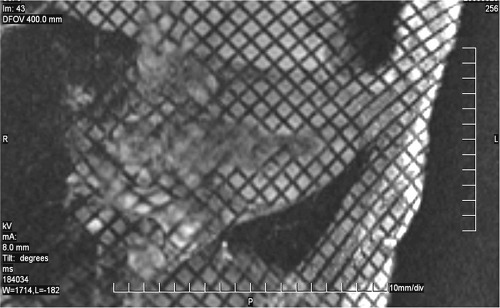 FIGURE 6.3 Tagged cine gradient echo of the left ventricle in the two-chamber (oblique sagittal) view. The dark grids are saturation bands that “tag” the myocardium during the cardiac cycle. This is used to evaluate regional myocardial function as well as local deformation. |
Ischemia Evaluation
There is increasing use of CMR for ischemia evaluation. There are two methods of assessing myocardial ischemia: (1) perfusion imaging using first-pass gadolinium contrast at rest and following administration of coronary vasodilators (Adenosine or dipyridamole), or (2) assessment of contractile reserve following inotropic stimulation with dobutamine.
A unique challenge to performing stress evaluation in the MRI suite relates to the magnetic environment. Unlike other methods, ECG changes cannot be interpreted inside the magnet because of the “magneto hydrodynamic effect.” High flow velocities in the great vessels during systole in the presence of a high magnetic field create electrical signals that alter the underlying ECG signal, especially in the ST segment that corresponds in timing to the greatest flow. Thus, ECG monitoring can only reliably assess heart rate but not ischemic change. Also, confinement within the MRI scanner may present additional challenges both to the patient as well as the supervising staff. Overall, however, the safety and efficacy of CMR for ischemia evaluation are well established.
Perfusion Stress MRI
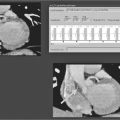
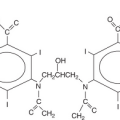
Although dipyridamole can be used for ischemia imaging, most centers use Adenosine because of its extremely short half-life (<10 seconds) and better patient tolerance. Adenosine causes coronary vasodilation and recruitment of capillary beds. A myocardial territory supplied by a coronary artery without significant stenosis increases perfusion several-fold by recruitment of additional capillary beds following Adenosine infusion. Myocardium supplied by a coronary artery with significant stenosis, on the other hand, has adapted to this flow limitation with recruitment of available capillary beds at rest to maintain perfusion; Adenosine infusion results in significantly lower increment of capillary bed recruitment compared to territories without coronary stenosis. This leads to relative reduction of flow in areas supplied by coronary arteries with significant stenoses. The patient receives 2–3 minutes of Adenosine infusion (140 μg/kg per minute), frequently initiated with the patient just outside the scanner bore for closer monitoring by the nursing personnel. The patient is then positioned inside the scanner and gadolinium-DTPA (0.05–0.2 mmol/kg) is rapidly infused and first pass imaging is performed using a gradient echo pulse sequence on multiple short axis slices of the left ventricle performed during a breath hold. Normal myocardium will show a “blush” of bright signal throughout the cardiac cycle, whereas ischemic or infarcted myocardium will show a persistent dark signal, either subendocardial or transmural in location (Figure 6.4). To differentiate between ischemic and infarcted myocardium, rest perfusion imaging without Adenosine is performed (Table 6.2). Abnormal areas following Adenosine infusion that have normal resting perfusion are considered ischemic. If the signal abnormality persists, this area is either infarcted (verified by presence of delayed enhancement) or the signal abnormality is an artifact (if there is no delayed enhancement). However, resting ischemia, although rare, may also present with low signal intensity during Adenosine infusion and rest, and with no delayed enhancement. Assessment of the patient’s clinical status is necessary to determine in this rare case if this is resting ischemia or artifact.
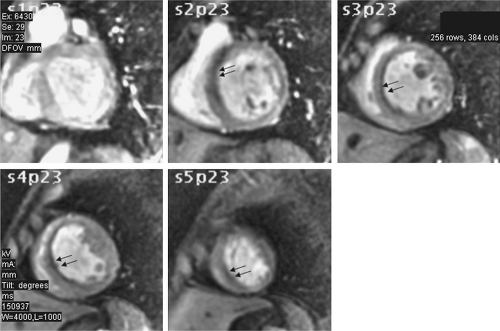 FIGURE 6.4 First pass perfusion CMR study. Short axis slices showing resting perfusion following gadolinium injection. There is reduced subendocardial perfusion in the base to distal anteroseptum and inferoseptum and apical inferoseptum (arrows). This signifies subendocardial scar or fixed defect. To differentiate scar or fixed defect from artifact, gadolinium delayed enhancement would be present in these regions in myocardial scar. Artifact would not show delayed enhancement. |
TABLE 6.2 Asssessment of Ischemia, Infarction/scar, and Viability of Myocardial Segments in Cardiac Magnetic Resonance Imaging | ||||||||||||||||||||||||||||||||||||||
|---|---|---|---|---|---|---|---|---|---|---|---|---|---|---|---|---|---|---|---|---|---|---|---|---|---|---|---|---|---|---|---|---|---|---|---|---|---|---|
| ||||||||||||||||||||||||||||||||||||||
Image interpretation is usually qualitative, with rest and post Adenosine images evaluated side by side. Semiquantitative and quantitative methods have been developed, but these methods have yet to be widely validated in the clinical setting and are still largely in the realm of research applications. Furthermore, unlike positron emission tomography (PET)-based perfusion imaging, CMR imaging cannot directly and accurately measure myocardial blood flow, and quantitative methods using myocardial signal-time curves make the assumption that the signal is proportional to underlying myocardial blood flow.
Adenosine stress CMR has good sensitivity and specificity in detecting significant coronary artery disease (Table 6.3) and is comparable to conventional nuclear methods. However,
because CMR has superior spatial resolution compared to single photon emission computed tomography (SPECT), subendocardial disease can be detected. Other advantages of CMR over SPECT are the lack of ionizing radiation and shorter total duration of the test. In addition, because MRI uses first pass perfusion, imaging can be started after achievement of maximal Adenosine-induced vasodilation, usually 2 minutes following infusion. In contrast,
SPECT-based imaging relies on intracellular uptake of radiotracer, and requires a longer infusion of Adenosine, frequently 4–6 minutes. Other advantages of CMR include functional and morphological evaluation of the heart.
TABLE 6.3 Sensitivity and Specificity of Perfusion and Dobutamine CMR for Diagnosis of Coronary Artery Disease | |||||||||||||||||
|---|---|---|---|---|---|---|---|---|---|---|---|---|---|---|---|---|---|
|