Liver, Biliary Tract, and Pancreas: Introduction
The diagnosis of diseases of the liver, biliary tract, and pancreas optimally depends on using both clinical and radiographic data. Understanding the proper use of these data and ordering radiographic studies in the optimal sequence are helpful for making the diagnosis most efficiently. Frequently, the clinical presentation and associated laboratory work provide most of the clues for diagnosis. Physical examination, history, and pertinent laboratory values are often helpful in making the diagnosis or at least in providing clues for selecting the optimal radiographic studies. If clinical information is insufficient or if radiographic confirmation is necessary, plain films and contrast studies may be performed. Upright and supine plain radiographs are helpful for the detection of free air, calcifications, and other abnormalities. Contrast studies such as endoscopic retrograde cholangiopancreatography (ERCP), magnetic resonance cholangiopancreatography (MRCP) and percutaneous transhepatic cholangiography (PTC) are often helpful in analyzing diseases of the liver, biliary tree, and pancreas. For instance, pancreatic or biliary ductal systems, fistulae from these ductal systems, and associated abnormalities such as encasing tumors can be diagnosed by cholangiography.
Digital cross-sectional imaging, nuclear medicine (NM) and an important form of NM called positron emission tomography (PET), and angiography have provided considerable information in analyzing diseases of these organs, which cannot be directly visualized with plain radiography, even using traditional contrast material, that is, barium. Cross-sectional techniques consist of ultrasound (US), computed tomography (CT), and magnetic resonance (MR) imaging. This chapter reviews the use of cross-sectional imaging and, where pertinent, nuclear medicine and angiography to evaluate abnormalities of the liver, biliary tract, and pancreas.
Techniques and Normal Anatomy
Several modalities such as US, nuclear medicine, CT, and MR imaging are commonly used in diagnosing diseases of liver, pancreatic, or biliary ductal system. The detail of each technique has been described in Chapter 1, “Scope of Diagnostic Imaging.”
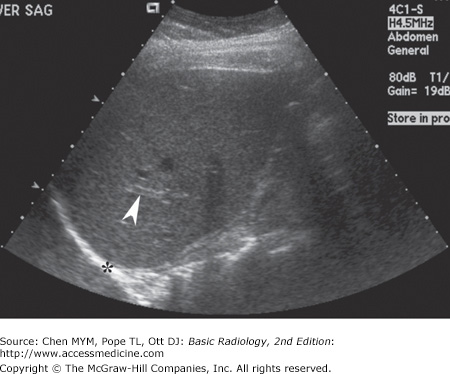
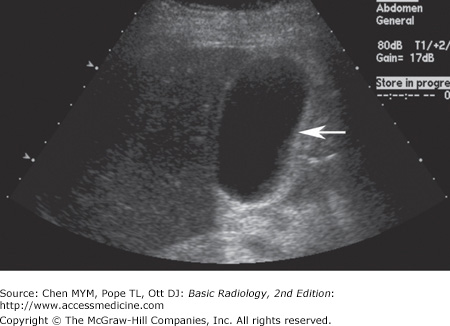
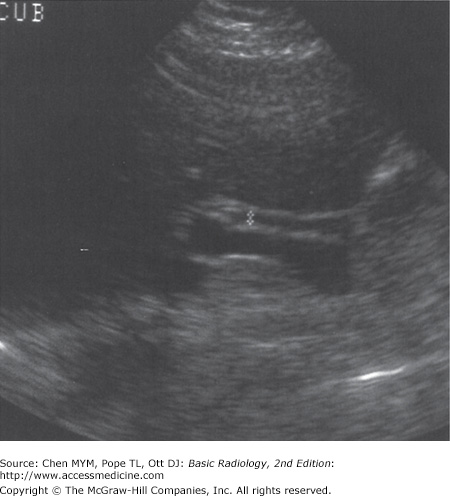
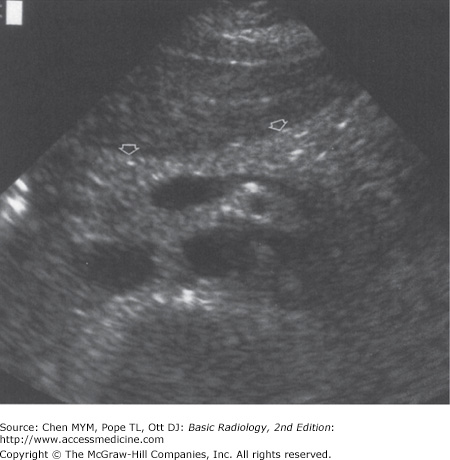
With US, normal organs are displayed as structures of different echogenicity. In general, fluid is anechoic (has no echoes). Soft tissue has echoes of mild to moderate intensity. Bone has extremely strong echoes. Abnormal organs are displayed as areas of diffuse inhomogeneity or as focal regions of decreased or increased echogenicity within the organ. The normal appearances of the liver, biliary system, and pancreas have been well established. Echogenicity of the organs in the abdomen is evaluated in relation to other nearby organs. The pancreas is typically the most echogenic organ in the upper abdomen, followed by the liver. The liver typically has homogeneous parenchymal detail (Figure 11-1). Numerous intrahepatic vessels including portal veins and hepatic veins are easily seen within the liver. The gallbladder appears as an anechoic pear-shaped structure along the inferior aspect of the liver (Figure 11-2). It normally has a thin, homogeneous wall less than 3 mm in thickness. The degree of distention of the gallbladder varies with postprandial intervals. As is expected, it contracts after a meal and distends in the fasting state. The biliary ducts are thin tubes, the walls of which are 1.5 mm or less (essentially unmeasurable). The ducts increase in caliber as they extend from the liver to the sphincter of Oddi (Figure 11-3). The upper limit in caliber of the extrahepatic biliary ducts increases with age. When measured at the level where it crosses the right hepatic artery, 6 mm is usually used as the cutoff diameter. The pancreas is homogeneous, comma-shaped, and parallel to the splenic vein and extends from the left upper quadrant caudally and to the right (Figure 11-4). In anteroposterior dimension the pancreatic head is approximately 3 cm, the body 2.5 cm, and the tail 2 cm. The pancreas can sometimes be difficult to image with ultrasound because of its relatively posterior position and overlying bowel gas. The normal pancreatic duct, if seen, should be 3 mm or less.
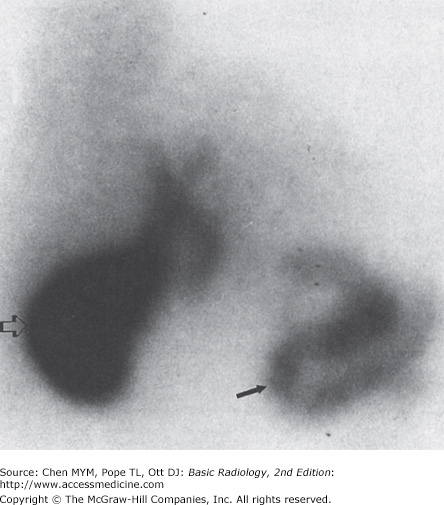
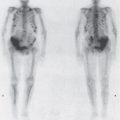
With NM, normal organs are displayed as regions of homogeneous activity conforming to the general shape of the organ. Abnormal organs are displayed as diffuse inhomogeneity or as focal areas of reduced or increased activity. In the past, the liver was most commonly studied with NM with technetium-labeled sulfur colloid. However, this technique has largely been replaced by CT, US, and MR imaging. The most common NM study of the liver today utilizes technetium-labeled red blood cells to evaluate for cavernous hemangioma. Evaluation of the biliary system is a common application for NM studies. Technetium-labeled hepatobiliary imaging iminodiacetic acid derivatives for hepatobiliary imaging, especially disofenin and mebrofenin, are taken up by the liver, excreted into the bile, carried to the biliary tree and gallbladder, and from there travel to the bowel through the extrahepatic ducts (Figure 11-5). Depending on the exact agent used, these are termed hepatic iminodiacetic acid, HIDA scans. Currently, no practical imaging of the pancreas is done by means of NM techniques.
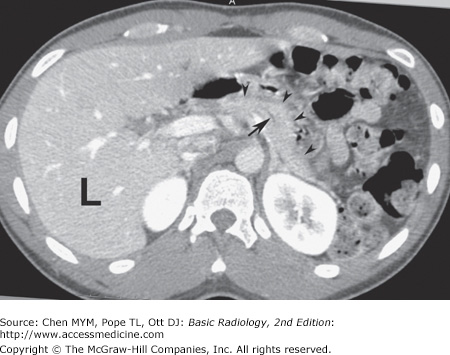
With CT, normal organs are displayed as regions of differing attenuation. Abnormal organs are displayed as diffuse inhomogeneity or as focal areas of decreased or increased attenuation. The liver, biliary system, and pancreas are well demonstrated by CT (Figure 11-6). Intravenous contrast aids in their evaluation. The liver is the most dense organ in the abdomen. The normal liver parenchyma appears homogeneous, just as in US. The portal and hepatic vessels and the biliary ductal system are likewise easy to identify. Overall measurements of wall thickness and biliary duct caliber are the same as for US. The pancreas is easily identified on CT, and the pancreatic duct is frequently well seen.
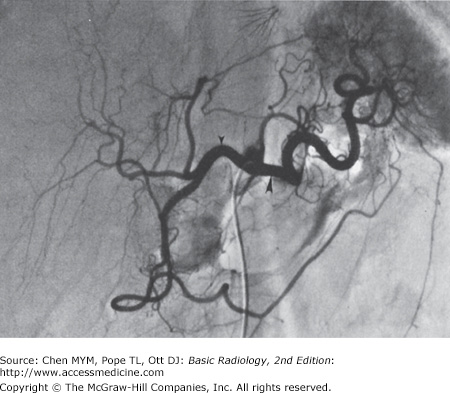
At angiography, normal organs enhance to variable extents. Abnormal organs either inhomogeneously enhance or have focal areas of decreased or increased enhancement. Although the parenchyma of the normal organs is rarely demonstrated, the blood vessels of these organs are seen in exquisite detail (Figure 11-7). In the liver, both the hepatic artery and all of its branches can be seen. Delayed studies through the liver in the venous phase demonstrate the portal vein. The cystic artery and any collateral vessels can be angiographically demonstrated. Angiographic studies of the pancreas can demonstrate major pancreatic branches, as well as encasement, displacement, stenosis, or occlusion.
On MR imaging, normal organs have homogeneous signal intensity or well-recognized variations in signal intensity. Abnormal organs have inhomogeneous signal intensity or areas of increased or decreased signal intensity. The normal liver, biliary system, and pancreas are well demonstrated on MR imaging (Figure 11-8). The liver has a homogeneous signal intensity which is usually higher than that of muscle and lower than that of the spleen. The biliary system is normally demonstrated as an area of low signal intensity on T1-weighted images and high signal intensity on T2-weighted images. This appearance reflects the fluid bile within the gallbladder and biliary tree. Magnetic resonance cholangiopancreatography, or MRCP, demonstrates the biliary system as very high signal intensity structures against a very low signal intensity background of surrounding solid tissues (Figure 11-9). The pancreas is of intermediate signal on both T1- and T2-weighted images and may be hard to differentiate from bowel if no oral contrast agent is administered to the patient. As in CT and US, the normal fatty change within the pancreas that occurs with age is visible. Newer hepatocyte-specific contrast agents, such as gadoxetate disodium, are offering new ways of evaluating the liver and biliary system.
Figure 11-8.
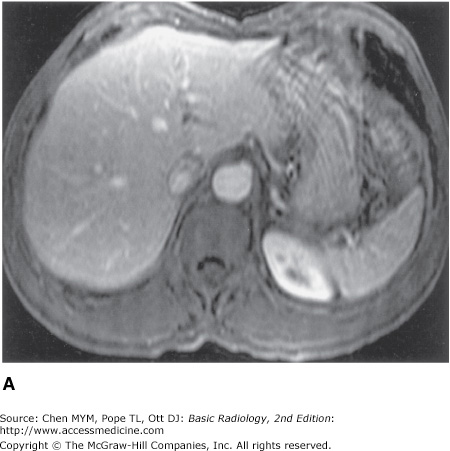
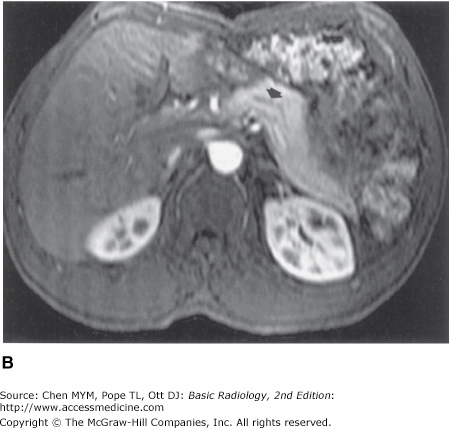
(A) Dynamic gadolinium-enhanced T1-weighted gradient echo image of the upper abdomen, taken at the level of the mid-liver, demonstrating homogeneous liver, with interspersed intrahepatic vessels, and spleen. (B) Dynamic gadolinium-enhanced T1-weighted gradient echo image of the upper abdomen, taken at the level of the pancreas and kidneys, demonstrating the homogeneous pancreatic body and tail with pancreatic duct (arrow), and the corticomedullary differentiation in the kidneys.
Figure 11-9.
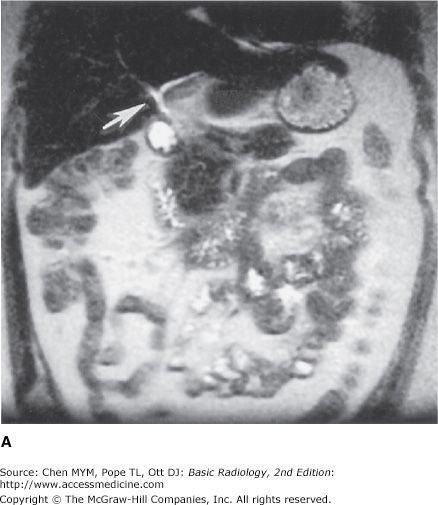
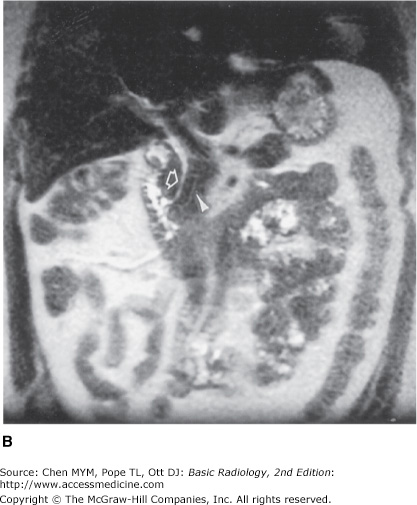
(A) Magnetic resonance cholangiopancreatography (MRCP) of the normal biliary ducts, taken at the level of the porta hepatis, demonstrating the branching proximal intrahepatic ducts (arrow). (B) MRCP of the normal biliary ducts, taken at the level of the distal extrahepatic bile duct, demonstrating the intrapancreatic passage of the biliary (arrow) and pancreatic (arrowhead) ducts, entering the duodenum.
Technique Selection
Diseases of the liver, biliary system, and pancreas can be conveniently, if arbitrarily, separated into the following categories to help illustrate the optimal sequences of imaging techniques: diffuse hepatocellular disease, focal hepatic diseases, abdominal trauma, inflammatory disease of the biliary tract, and pancreatic inflammation or neoplasm.
In diffuse hepatocellular disease, CT is probably the first study used to survey the liver because it is moderately sensitive to liver lesions and is also helpful for evaluating surrounding organs. Ultrasound may have an application unless fatty liver is present, because fat attenuates the US beam. NM has only infrequent applications. MR imaging may be the most sensitive modality for detecting and characterizing diffuse diseases of the liver, including cirrhosis and hemochromatosis, especially when combined with contrast agents. Angiography may be used to study collateral formation in cirrhosis.
In focal diseases of the liver, US is often used first, because it utilizes no radiation, is relatively inexpensive, is widely available, and is moderately sensitive to localized lesions in the absence of preexisting diffuse diseases, such as cirrhosis. It is, however, of limited value in obese patients and whenever air is present, for example when air-filled bowel obscures the liver. CT is a pivotal examination, often employed after US. It is used as a survey of the entire body, is easy to compare in serial studies, and is sensitive to disease. Air and bone do not interfere with CT examinations. Contrast-enhanced MDCT (multidetector CT) scanners can be used to perform CT angiography, or CTA, which is a noninvasive means of producing images depicting vessels much like conventional angiography. NM techniques may be used to analyze a focal lesion within the liver for possible cavernous hemangioma. MR imaging is used frequently to characterize focal lesions within the liver, especially those discovered during survey techniques such as US or CT. NM and MR imaging are considered the optimal means for evaluating the liver for cavernous hemangioma, and both are highly accurate (approximately 95%) in evaluating the liver for cavernous hemangioma. In the opinion of some authorities, newer MR pulse sequences, contrast agents, and fast scanning techniques arguably make MR imaging the optimal means for both detection and characterization of focal liver lesions of all types. Gadoxetate disodium is a newer hepatocyte-specific contrast agent that is taken up by functioning hepatocytes. This can be helpful in evaluating indeterminate liver lesions. Angiography is primarily used to provide a vascular road map in planning surgery for focal liver lesions. It can also be used in treatment of cancer, such as with chemoembolization.
CT is the only commonly accepted means for analyzing abdominal trauma, particularly of the liver. CT is reasonably accurate in the detection of trauma-related abnormalities of the liver, biliary system, and pancreas. US may be useful if CT is not available or to quickly identify intraperitoneal hemorrhage in patients who are in the emergency department and are going directly to the operating room. However, it is insensitive for directly identifying solid-organ lacerations. Angiography may be useful to embolize persistently bleeding arteries in the liver or spleen when surgery is not possible. Currently, NM and MR imaging have no application in studying the liver, biliary tract, or pancreas in acute trauma. However, they may have some application if there is clinical concern for a bile leak.
CT is often the initial means to study pancreatic inflammation or neoplasm. It is effective in evaluating the pancreas. Ultrasound may be limited due to bowel gas or patient habitus. It is notoriously difficult to evaluate the pancreatic tail with ultrasound. NM has no major current application in studying the pancreas. MR imaging may be useful to study tumors of the pancreas. It is insensitive for small calcifications, as in chronic pancreatitis. Recent advances in MR imaging, especially MRCP, have brought MR imaging further to the forefront of pancreatic and biliary duct evaluation. This latter technique highlights fluid-containing structures such as biliary or pancreatic ducts and voids nearly all signal intensity from background solid structures. Angiography is useful to identify bleeding arteries as a source of hemorrhagic pancreatitis but is occasionally used to identify encasement of arteries in a pancreatic neoplasm.
Generally, these radiographic techniques require little patient preparation. This is convenient, especially in evaluation of trauma. Ideally, a patient should fast after midnight before an US examination. As a minimum, the patient should fast for 6 hours, especially when evaluating the gallbladder. Patients ideally should fast before CT examinations as well, but this requirement is not crucial. Dilute oral contrast medium for CT is administered at least 2 hours in advance and again just before the examination begins. Intravenous contrast material is often given as a bolus by a power injector immediately prior to the study. Proper laboratory evaluation of renal function, including serum creatinine below 1.5 mg/dL, is usually required before administering iodinated intravenous contrast material because it can be nephrotoxic. Ideally, NM is also performed after fasting. Preparation for angiography again requires fasting and laboratory evaluation of renal function and possible coagulopathy. Proper preparation of patients for MR imaging is controversial. However, some authorities advise administering an iron-containing oral contrast agent and an agent to relax the bowel, such as glucagon, before scanning. Renal function must be considered when administering gadolinium-based MRI contrast agents because of nephrogenic systemic fibrosis as previously discussed.
These examinations may interfere with each another. No barium should be administered before US or CT. Oral contrast agents may generate bowel gas, decompress the gallbladder, and hinder US. The oral contrast agent administered prior to a CT examination interferes with angiography by obscuring the abdomen. Intravenous contrast material interferes with any subsequent NM tests studying iodine metabolism such as those involving the thyroid gland because intravenous contrast agents contain iodine. Previous angiography usually requires that a CT examination be postponed for a day or two so that residual contrast material within the kidneys can be excreted. Usually, there are no conflicts between these examinations and NM or MR imaging.
Exercise 11-1. Diffuse Liver Disease
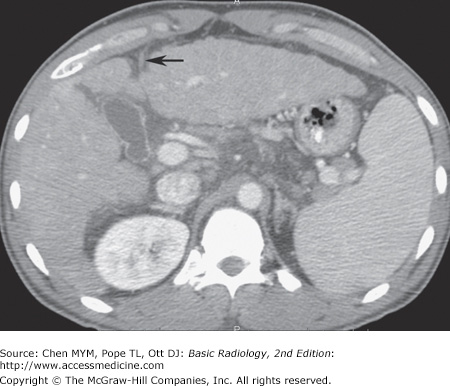
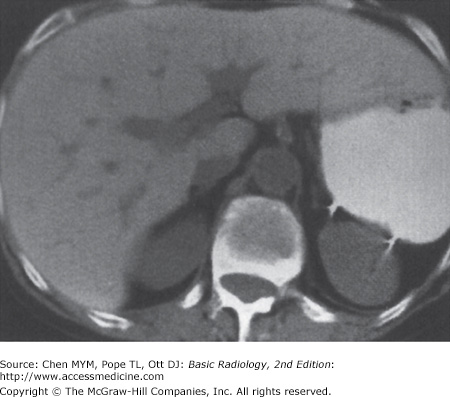
11-1. In this case, the overall size of the liver is small. The contour of the liver is nodular, which is characteristic of cirrhosis. Also note the recanalized paraumbilical vein (arrow), which indicates portal hypertension (A is the correct answer to Question 11-1).
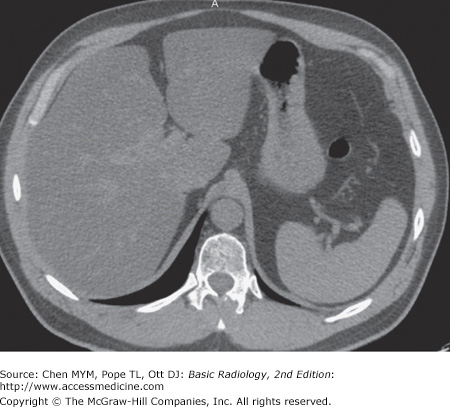
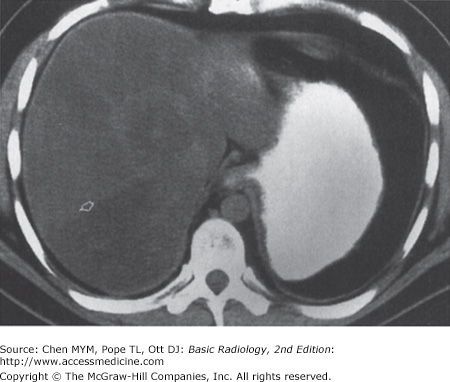
11-2. In this case, the liver is enlarged, there is marked low density throughout the liver when compared with the spleen, and there is no mass effect on the vessels. These are findings of fatty liver (hepatic steatosis) (B is the correct answer to Question 11-2).
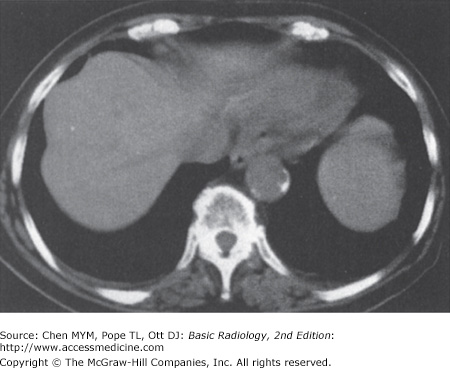
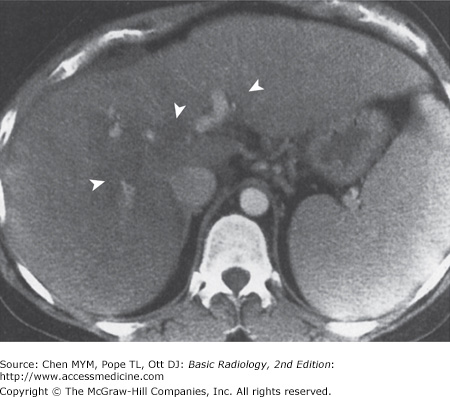
11-3. In this case, the liver size is enlarged and the liver demonstrates heterogeneous attenuation throughout. No focal mass is seen. These findings are consistent with hepatitis in this clinical setting (C is the correct answer to Question 11-3).
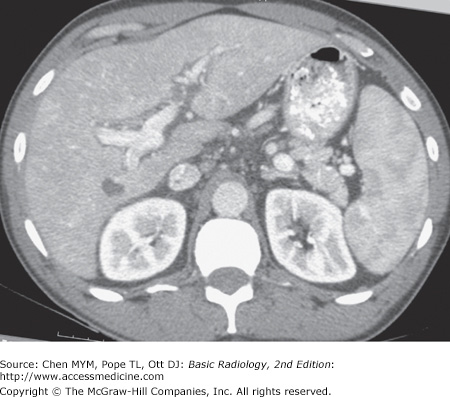
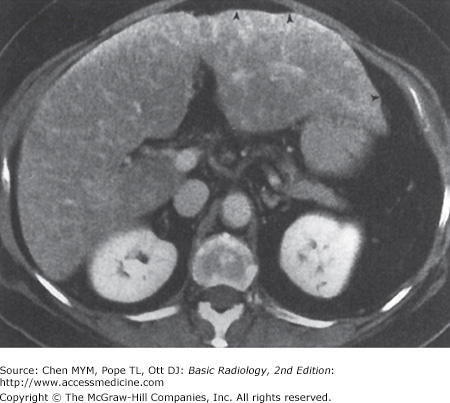
11-4. In this case, multiple small, highly attenuating, punctuate lesions are scattered throughout liver and spleen, characteristic of calcifications from old granulomatous disease, without any other predominant finding (B is the correct answer to Question 11-4).
Differentiation of liver disease into diffuse or focal disease is an artificial but convenient way to analyze liver disorders radiographically. Diffuse hepatocellular diseases are a common diagnostic problem. Although historical, physical, and laboratory testing are the first means for identifying these diseases, imaging may be required as a part of the overall assessment of the patient.
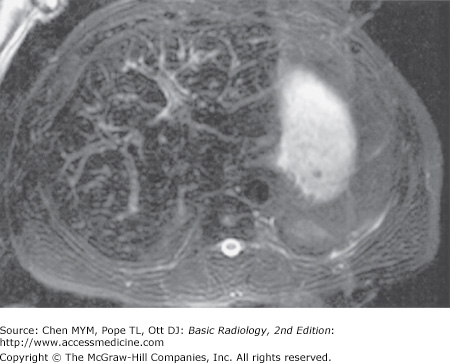
Cirrhosis is a chronic disease of the liver. It is characterized by injury and regeneration of hepatic parenchymal cells and is accompanied by formation of connective tissue within the liver. In the United States, the most common cause of cirrhosis is alcoholism, whereas in Asia, the most common cause is viral hepatitis. Cirrhosis results in disproportionate diminution of the right lobe compared to the left lobe and caudate lobe of the liver (Figure 11-14). Nodular regeneration of the liver results in a nodular edge of the liver and inhomogeneity of the parenchyma. The process is accompanied by, first, increased resistance to normal hepatopetal (toward the liver) flow and, finally, the development of hepatofugal (away from the liver) flow. The increased resistance in the portal vein secondarily enlarges the spleen. This process also creates enlarged collateral venous channels to reroute blood around the liver (Figure 11-10). These portosystemic collaterals are visible frequently on cross-sectional imaging studies, most commonly in paraumbilical veins, coronary veins, and even spontaneous splenorenal shunts. Ascites is nearly always present. Most authorities are increasingly convinced that MR imaging is the most sensitive imaging modality for examination of the liver in cirrhosis and other diffuse diseases of the liver. MR imaging can demonstrate not only the contour changes and collateral formation visible with CT, but also the more subtle intraparenchymal nodular changes consequent to formation of regenerative and dysplastic nodules characteristic of cirrhosis within the complex fibrotic and inflamed host hepatic tissue (Figure 11-15). Importantly, MR imaging is considered to be a sensitive imaging means in the diagnosis of tumors such as hepatocellular carcinoma superimposed on a background of cirrhosis (Figure 11-16).
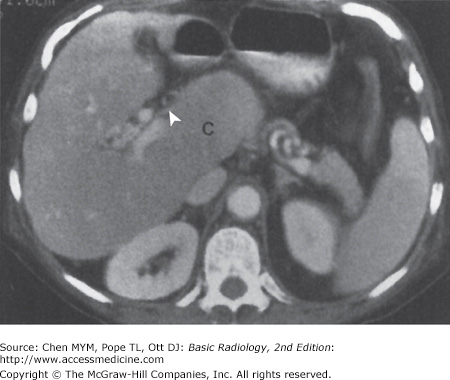
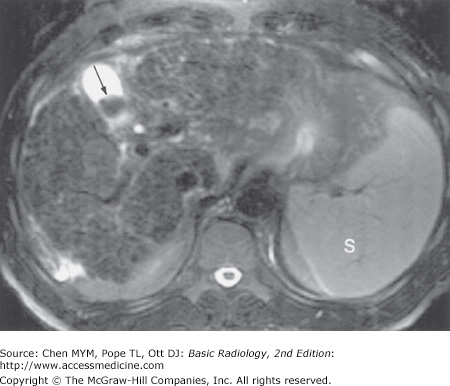
Figure 11-16.
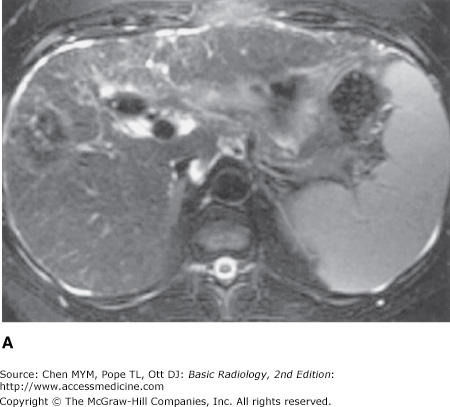
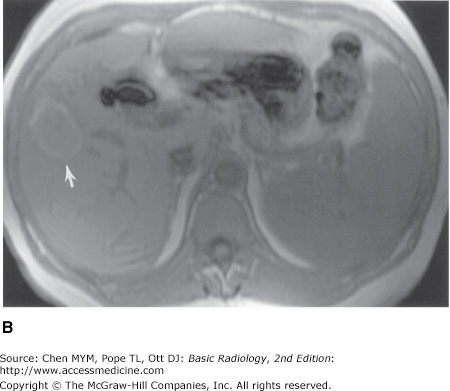
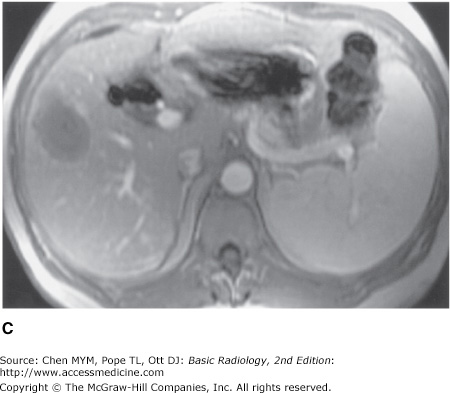
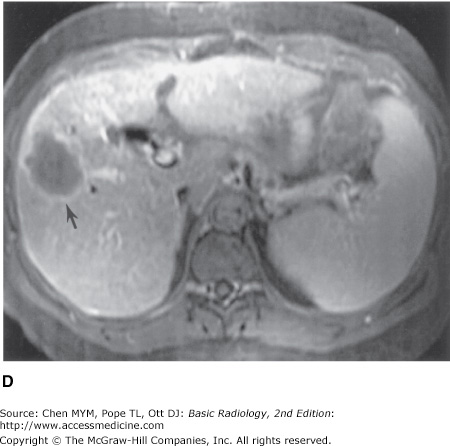
(A) T2-weighted scan showing heterogeneous parenchyma, with superimposed focal mass in the right hepatic lobe. Splenomegaly is present, and small amounts of ascites surround the liver. (B) Preinfusion T1-weighted MR imaging showing background of cirrhosis and the high signal intensity of the periphery of the lesion (arrow) before contrast administration. (C) Immediate postinfused T1-weighted MR imaging showing the absence of contrast enhancement in the lesion, including the absence of puddling of contrast. (D) Delayed postinfused T1-weighted MR imaging showing the lack of centripetal contrast accumulation of contrast within the lesion (arrow), meaning that the lesion is not a cavernous hemangioma; it is compatible with a hepatocellular carcinoma.
Diffuse tumor in the liver can occur in patients with certain primary malignancies (Figure 11-17), particularly breast carcinoma. It is usually distributed randomly throughout the left and caudate lobes. Collateral veins normally are not found. Portal venous or intrahepatic biliary radicles may be compromised or displaced, although portal vein thrombosis is uncommon.
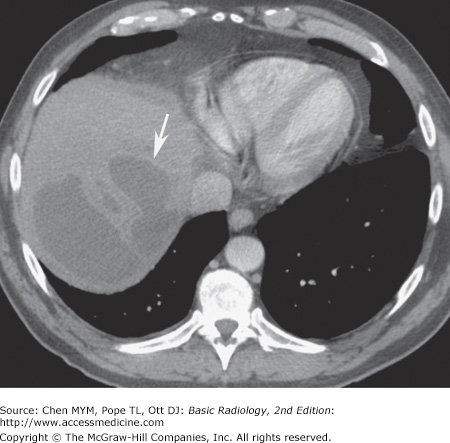
Budd-Chiari syndrome is a condition involving obstruction of the hepatic veins or the intrahepatic inferior vena cava. It is due to hypercoagulable states that produce thrombosis; tumors of the liver, kidneys, adrenal glands, or inferior vena cava (IVC); trauma (the “three Ts,” ie, thrombosis, tumors, trauma); pregnancy; and even webs or membranes in the lumen of the inferior vena cava. This syndrome produces a marked congestion of the liver resulting from resistance to flow out of the liver, which consequently enlarges and becomes edematous. The liver has a mottled appearance on CT that is due to the interstitial edema, especially after administration of intravenous contrast material (Figure 11-18).
Schistosomiasis is one of the world’s most common parasitic diseases and is rarely seen in persons living outside the endemic areas of China, Japan, the Middle East, and Africa; it does occur in immigrants to the United States. The larvae are hosts that enter the human gastrointestinal system, pass into lymphatic channels, migrate into mesenteric veins and portal veins, and, as adult worms, deposit ova that embolize to the portal system. This process leads to a granulomatous inflammation, periportal fibrosis, portal vein occlusion, varices, and splenomegaly. Imaging studies demonstrate periportal fibrosis. The fibrosis enhances on CT after contrast material administration and appears on US as increased echogenicity of the periportal sheath surrounding the portal veins.
Fatty liver, or steatosis, is a common disorder. It is found in up to 50% of diabetic and alcoholic patients and has been found in up to 25% of nonalcoholic, healthy adults who die accidentally. The many causes of fatty liver, besides diabetes and alcoholism, include (1) obesity, (2) chronic illness, (3) corticosteroid excess, (4) parenteral nutrition, and (5) hepatotoxins, including chemotherapy. Fatty liver may be distributed evenly or focally. When distributed uniformly, fatty liver is recognizable as a pattern of homogeneous increased echogenicity on US, decreased attenuation on CT (Figure 11-11), or increased signal intensity on T1-weighted MR images. On ultrasound, the echogenicity of the liver is compared to the right kidney, whereas on CT, the density of the liver is compared to the spleen. When distributed nonuniformly, it resembles focal disease of the liver in that normal islands of liver tissue are seen against the background of lower-density fatty liver (Figure 11-19). Specialized MR imaging scans such as chemical shift imaging, NM studies, or biopsy may be required to differentiate among the possibilities.
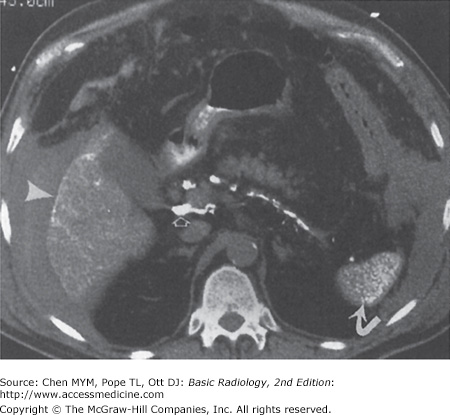
Hepatic iron overload can be due to deposition in hepatocytes or reticuloendothelial cells. Parenchymal iron deposition occurs in primary idiopathic hemochromatosis, secondary hemochromatosis, cirrhosis, or intravascular hemolysis; the iron overload in these conditions is generally referred to as hemochromatosis. Reticuloendothelial iron deposition occurs in transfusional iron overload or rhabdomyolysis; the iron overload in these conditions is referred to as hemosiderosis. The liver, including the right lobe, is enlarged greatly unless cirrhosis is present. On CT, the density of the liver is very high (Figure 11-20), and on MR imaging the liver has extremely low signal on both T1- and T2-weighted images (Figure 11-21). Patients with hepatic iron overload may develop hepatocellular carcinoma.
Old granulomatous disease is a disorder in which prior granulomatous inflammation, usually caused by Histoplasma capsulatum, involves the liver. Other granulomatous inflammatory conditions that could be involved include sarcoidosis, Wegener’s granulomatosis, and certain toxins. The granuloma tends to undergo necrosis, and dystrophic calcification forms within the lesion. This gives the lesion its most characteristic form, multiple punctate calcifications. The granuloma is visible on US as focal, extremely hyperechoic, shadowing lesions, and on CT as extremely high-density punctuate lesions (Figure 11-13). When large enough to be seen on MR, the calcification is seen as a signal void.
Thorotrast, a thorium-containing contrast agent, was used in the early 20th century for angiography and other purposes. Unfortunately, thorotrast emits alpha and beta radiation and has a biologic half-life of 400 years because it is not excreted; it therefore has been responsible for the development of several malignancies of the liver and spleen, including angiosarcoma and hepatocellular carcinoma. The particles are taken up by liver, spleen, lymphatics, and bone marrow. They appear on CT studies as large, dense particles in the liver, spleen, and peripancreatic and periportal lymph nodes (Figure 11-22). US shows typical calcifications.
Hepatitis is a diffuse inflammation of the liver, occurring as either acute or chronic disease. Patients with acute hepatitis have hepatocellular necrosis. In chronic cases, periportal inflammation and even fibrosis may occur. In acute hepatitis, the echogenicity of the parenchyma is decreased as a result of the edema, and the portal radicles are more evident; this has been termed the “starry sky” appearance. In chronic hepatitis, the texture of the liver is coarsened as a result of the fibrotic change in the periportal space, and this may decrease the visibility of the portal vein radicles. Findings on CT include hepatomegaly and decreased density (Figure 11-12). Most commonly, no important findings except hepatomegaly occur on CT in hepatitis. On MR imaging, the liver has low signal intensity on T1-weighted images and high signal intensity on T2-weighted images because of the edema and inflammation.
Osler-Weber-Rendu disease, or hereditary hemorrhagic telangiectasia, affects many organs and is seen predominantly, but not exclusively, in skin and the gastrointestinal tract. In the liver, it produces telangiectasias, cirrhosis, or both. Multiple small aneurysms may be present, and hematomas may occur if the aneurysms bleed. These aneurysms and any consequent hematomas from aneurysmal rupture can be visible on both US and CT. Angiography can demonstrate enlarged hepatic arteries and early but not immediate hepatic vein opacification.
Exercise 11-2. Focal Liver Diseases
Hemangioma
Metastatic disease
Angiosarcoma
Focal nodular hyperplasia
Related posts:

Stay updated, free articles. Join our Telegram channel

Full access? Get Clinical Tree


