Radiology of the Chest: Introduction
The chest radiograph is the most frequently performed radiographic study in the United States. It should almost always be the first radiologic study ordered for evaluation of diseases of the thorax. The natural contrast of the aerated lungs provides a window into the body to evaluate the patient for diseases involving the heart, lungs, pleurae, tracheobronchial tree, esophagus, thoracic lymph nodes, thoracic skeleton, chest wall, and upper abdomen. In both acute and chronic illnesses, the chest radiograph allows one to detect a disease and monitor its response to therapy. For many disease processes (eg, pneumonia and congestive heart failure) the diagnosis can be established and the disease followed to resolution with no further imaging studies. There are limitations to the chest radiograph, and diseases may not be sufficiently advanced to be detected or may not result in detectable abnormalities. Other imaging methods are needed to complement the conventional chest radiograph. These imaging methods include computed tomography (CT), positron emission tomography/computed tomography (PET/CT) and other radionuclide studies, magnetic resonance (MR) imaging, and ultrasound (US). These techniques, their clinical uses, and case studies are included in this chapter.
Techniques
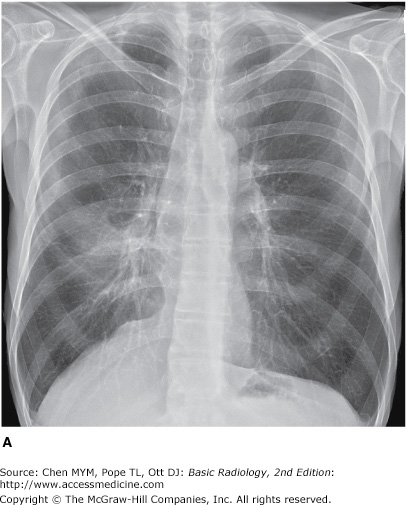
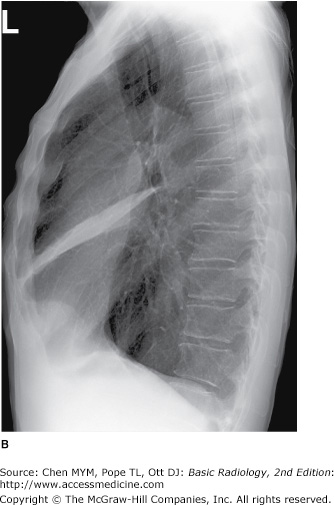
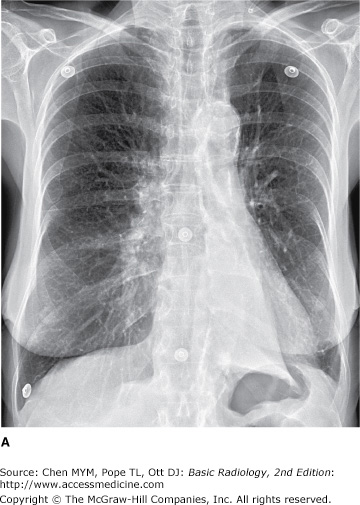
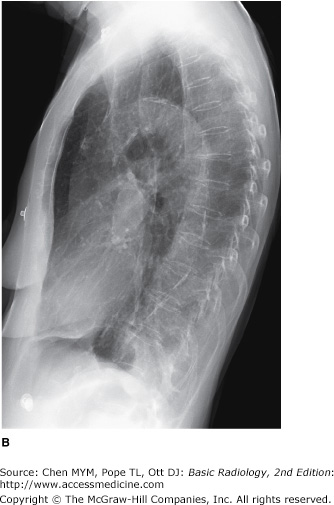
The simplest conventional study of the chest is a posteroanterior and lateral chest radiograph taken in a radiographic unit specially designed for these studies. The x-rays travel through the patient and expose a receptor from which the image is recorded. Most commonly, digital receptors are used, although a receptor utilizing an intensifying screen and radiographic film remains in some use as well. Computed radiography and large field-of-view image intensifiers are two types of digital receptors. The digital images may be printed on film by laser printers but are generally viewed on monitors. The two views of a chest radiograph are taken in projections at 90 degrees to each other with the patient’s breath held at the end of a maximum inspiration. The first view is obtained as the patient faces the receptor with the x-ray beam source positioned 6 feet behind him. Because the x-ray beam travels in a posterior-to- anterior direction, this view is called a posteroanterior (PA) chest radiograph. Another view is then obtained with the patient turned 90 degrees and the left side against the receptor and arms overhead. The x-ray beam travels from right to left through the patient, and this is called a left lateral view. Anatomic features of the chest that are readily identifiable on conventional radiographs are shown in Figures 4-1 and 4-2.
Figure 4-1.
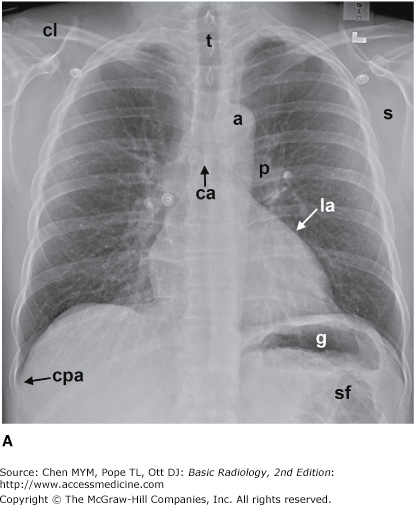
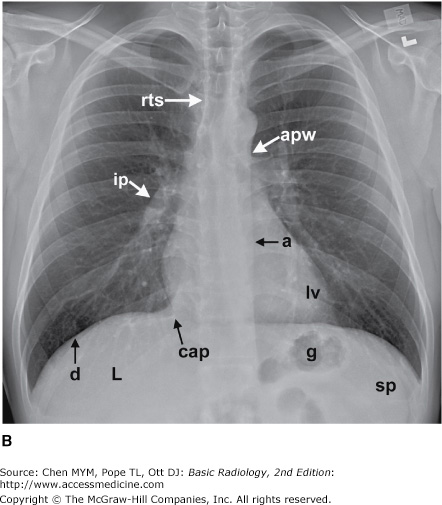

(A–C) Normal radiographic anatomy. Posteroanterior chest radiographs. a, aorta; ajl, anterior junction line; apw, aortopulmonary window; ca, carina; cap, cardiophrenic angle; cl, clavicle; cpa, costophrenic angle; d, diaphragm; g, gastric air bubble; ip, interlobar (or descending) pulmonary artery; L, liver; la, left atrium; lv, left ventricle; p, main pulmonary artery; pjl, posterior junction line; rts, right tracheal (or paratracheal) stripe; s, scapula; sf, splenic flexure of colon; sp, spleen; t, trachea.
Figure 4-2.

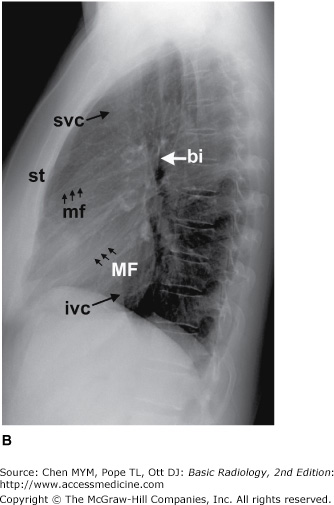
(A,B) Normal radiographic anatomy. Lateral chest radiographs. a, aorta; bi, bronchus intermedius; cpa, costophrenic angle; d, diaphragm; e, esophagus; ivc, inferior vena cava; lpa, left pulmonary artery; lul, left upper lobe bronchus; lv, left ventricle; m, manubrium; mf, minor fissure; MF, major fissure; rpa, right pulmonary artery; rul, right upper lobe bronchus; rv, right ventricle; st, sternum; svc, superior vena cava; t, trachea; v, vertebral body.
In some clinical situations, patients may not be able to stand or sit upright for the conventional PA and lateral radiographs, and an image must be taken with the patient’s back turned to the receptor and the x-ray beam traversing the patient in an anterior-to-posterior direction. These radiographs are called anteroposterior (AP) radiographs. They may be taken in the x-ray department but are more commonly obtained as portable studies at the patient’s bedside.
Images may also be obtained with the patient lying on one side in a decubitus position with the x-ray beam traversing the patient either PA or AP along a horizontal plane. These images are designated as lateral decubitus images (see Figure 4-63 C). A left lateral decubitus radiograph indicates that the left side of the patient is dependent against the table. A right lateral decubitus radiograph indicates that the right side of the patient is dependent against the table.
If the clinical situation prevents the patient from coming to the radiology department, a chest radiograph may be obtained at the patient’s bedside, and these are almost always AP radiographs. The AP portable radiograph does not provide as much information as PA and lateral chest radiographs for a number of reasons. Because it is a single view, lesions are not as easily or accurately localized along the AP axis of the thorax. The patients for whom these images are obtained are usually quite ill and cannot be positioned as well as patients traveling to the x-ray department. An ill patient may not be able to cooperate by holding his breath at full inspiration. A mobile x-ray generator is typically not as powerful as a fixed x-ray generator, and longer exposure times therefore are necessary to obtain sufficient exposure. The quality of portable chest radiographs, therefore, is often inferior to that of PA and lateral radiographs, as a result of both respiratory and cardiac motion. X-ray grids are used to reduce scatter radiation and improve image quality. Grids are used for most conventional chest radiographs done in radiology departments where fixed equipment is present. Grids are not usually used for portable radiographs, and the result is a high proportion of scattered x-rays, which degrade the image. Paradoxically, the portable radiograph may be more expensive than a conventional PA and lateral chest radiograph, owing to extra labor and equipment costs in obtaining a bedside radiograph.
Computed tomography is described in detail in Chapter 1. For CT examinations of the chest, intravenous contrast material is frequently administered for opacification of arteries and veins within the mediastinum and hila to facilitate the recognition of abnormal masses or lymph nodes. Anatomic features of the chest that are readily identifiable on CT scans are shown in Figures 4-3 and 4-4.
Figure 4-3.
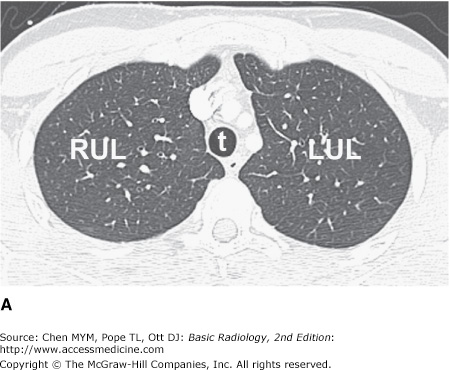
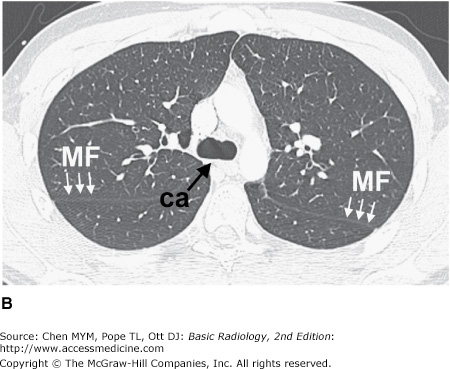
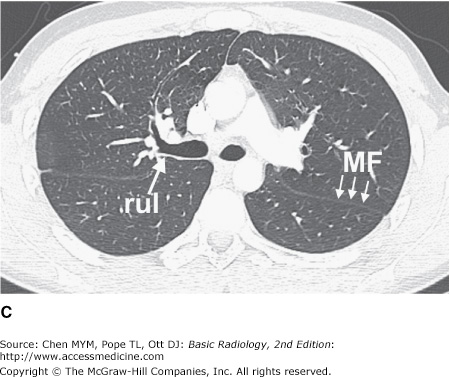
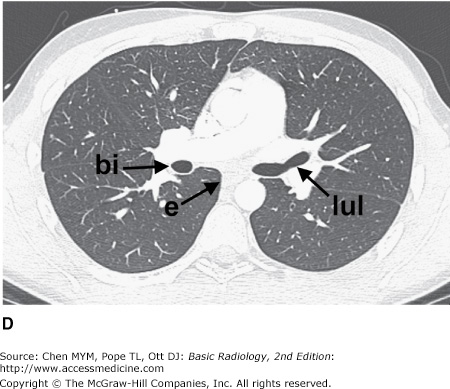
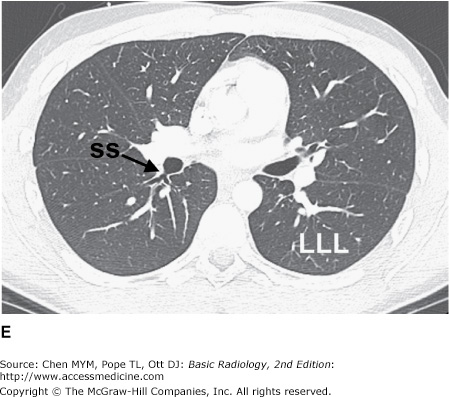
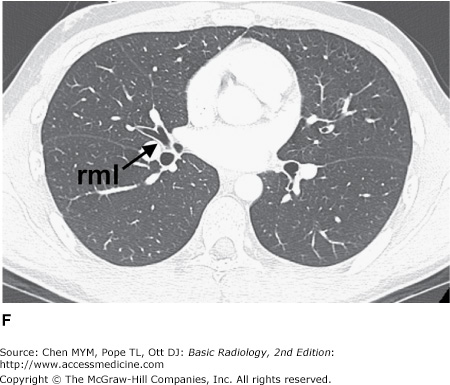
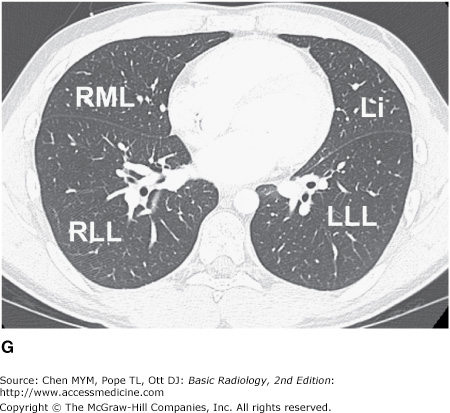
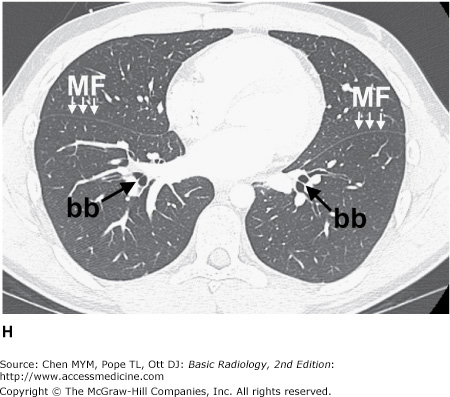
(A–H) Normal CT anatomy. Axial scans of the chest, contiguous slices at approximately 1 cm collimation, lung window settings. bb, basilar segmental bronchi of lower lobes; bi, bronchus intermedius; ca, carina; e, esophagus; Li, lingula segment of the left upper lobe; LLL, left lower lobe; lul, left upper lobe bronchus; LUL, left upper lobe; MF, major fissure; RLL, right lower lobe; RML, right middle lobe; rml, right middle lobe bronchus; rul, right upper lobe; rul, right upper lobe bronchus; ss, bronchus to superior segment of lower lobe; t, trachea.
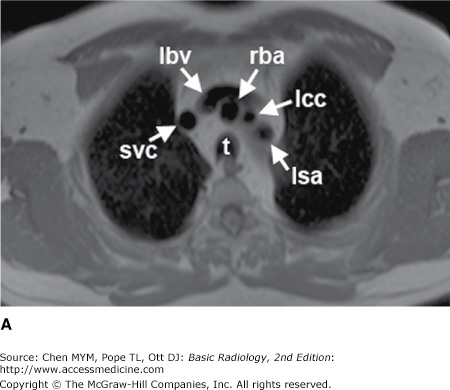
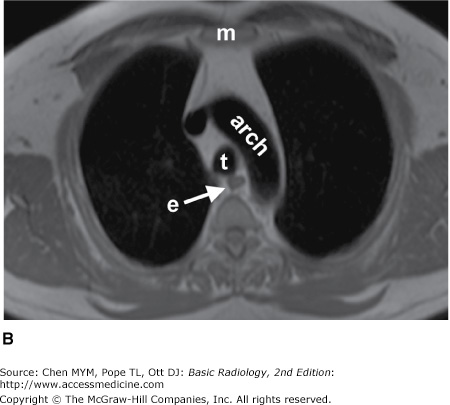
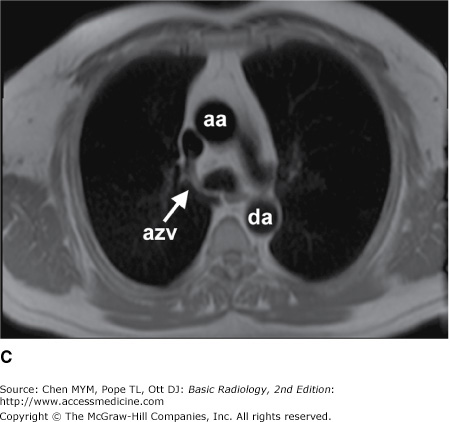
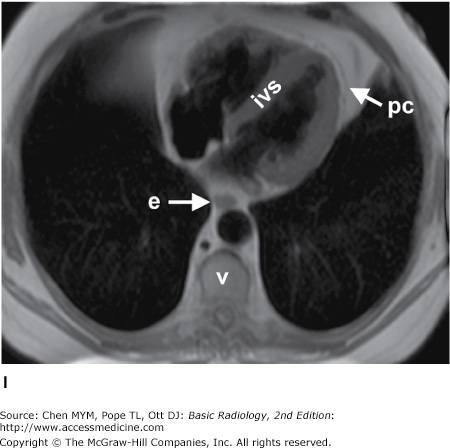
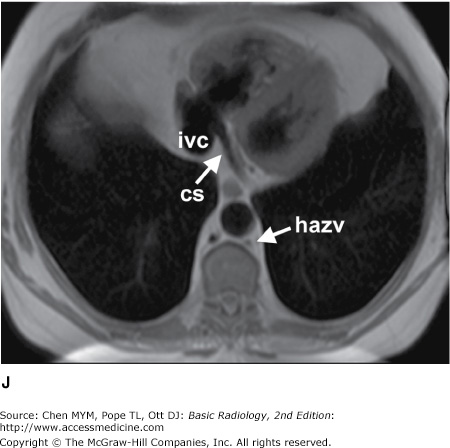
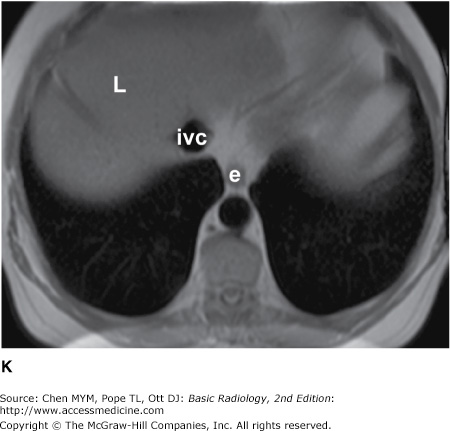
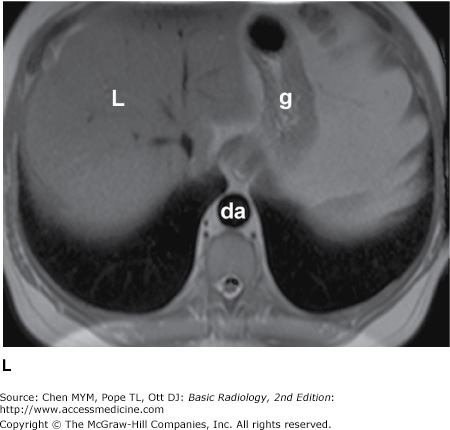
Figure 4-4.
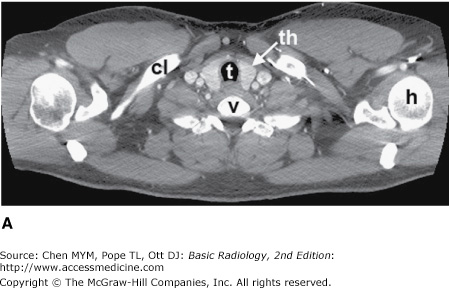
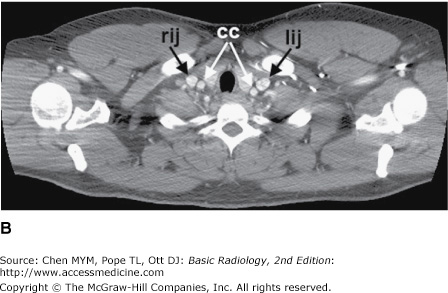
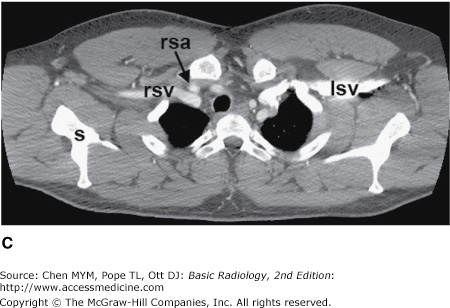
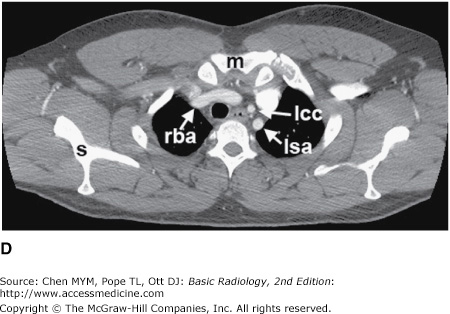
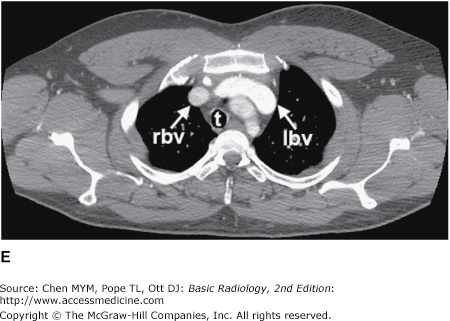
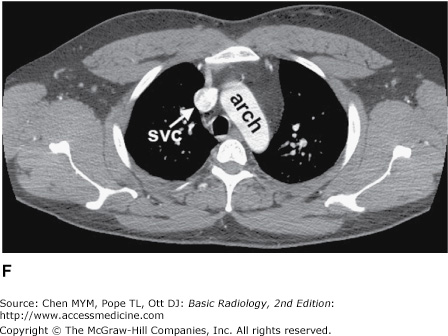
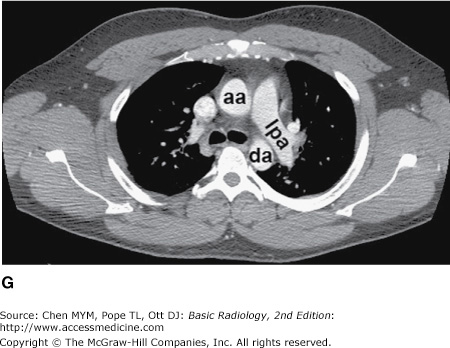
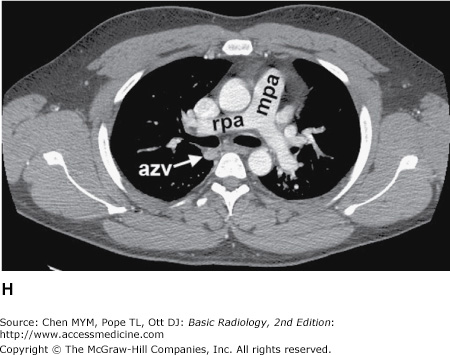
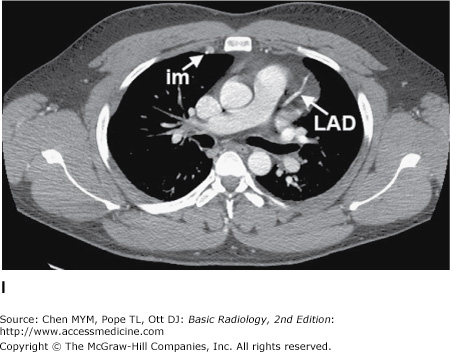
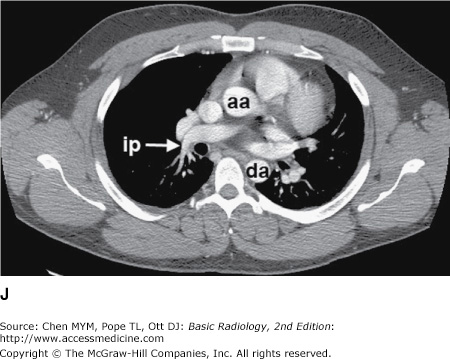
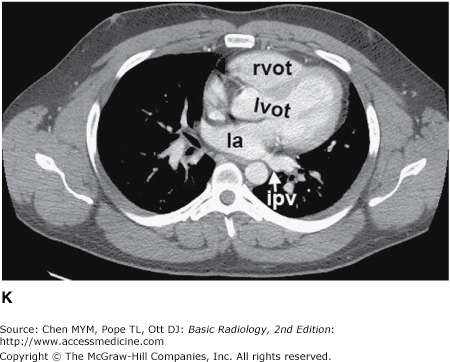
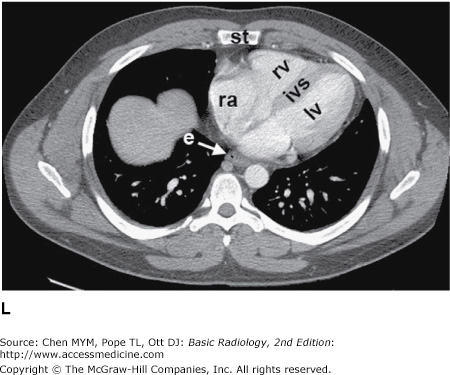
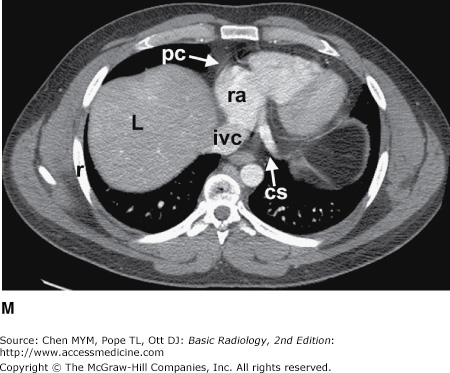
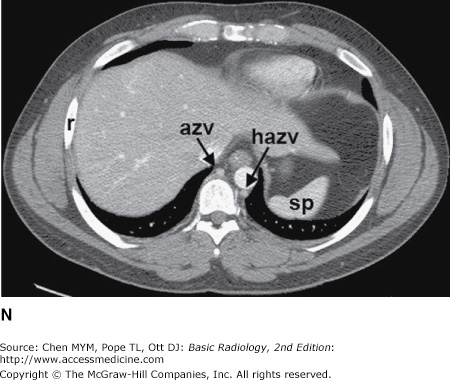
(A–N) Normal CT anatomy. Axial scans of the chest, contiguous slices at approximately 1 cm collimation, soft-tissue (mediastinal) window settings. aa, ascending aorta; arch, transverse section of the aortic arch; azv, azygos vein; cc, common carotid artery; cl, clavicle; cs, coronary sinus; da, descending aorta; e, esophagus; hazv, hemiazygos vein; h, humerus; im, internal mammary artery and vein; ip, interlobar (or descending) pulmonary artery; ipv, inferior pulmonary vein; ivc, inferior vena cava; ivs, interventricular septum; L, liver; la, left atrium; LAD, left anterior descending coronary artery; lbv, left brachiocephalic vein; lcc, left common carotid artery; lij, left internal jugular vein; lpa, left pulmonary artery; lsa, left subclavian artery; lsv, left subclavian vein; lv, left ventricle; lvot, left ventricular outflow tract; m, manubrium; mpa, main pulmonary artery; pc, pericardium; r, rib; ra, right atrium; rba, right brachiocephalic artery; rbv, right bronchiocephalic vein; rij, right internal jugular vein; rpa, right pulmonary artery; rsa, right subclavian artery; rsv, right subclavian vein; rv, right ventricle; rvot, right ventricular outflow tract; s, scapula; sp, spleen; st, sternum; svc, superior vena cava; t, trachea; th, thyroid; v, vertebral body.
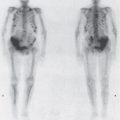
Nuclear medicine techniques used in evaluating diseases of the thorax include ventilation-perfusion (V/Q) scanning and scanning with tumor-seeking radiopharmaceuticals for tumor staging. The V/Q scan may be used for patients with suspected pulmonary thromboembolism and who have contrast allergy or renal failure. The V/Q scan is noninvasive, and when results are negative, fewer than 10% of patients have pulmonary thromboembolism. The ventilation study is typically performed with the patient inhaling 10 to 30 mCi of xenon-133 while images are obtained with a scintillation camera (Figure 4-5 A). Wash-in images are obtained for two consecutive 120-second periods, an equilibrium image is obtained, and then wash-out images are obtained over 30- to 60-second periods in posterior and left and right posterior oblique projections. This portion of the study takes about 15 minutes. The perfusion scan is obtained by intravenously injecting 2 to 4 mCi of technetium-99m-labeled macroaggregated albumin containing 200,000 to 700,000 particles. The particles range in size from 10 to 100 μm, and they lodge in capillaries and capillary arterioles, accurately reflecting pulmonary blood flow (Figure 4-5 B). The scintillation camera is set so that it obtains anterior, posterior, both posterior oblique, and both anterior oblique projections for 750,000 counts per image. The perfusion study takes about 30 minutes to perform.
Figure 4-5.
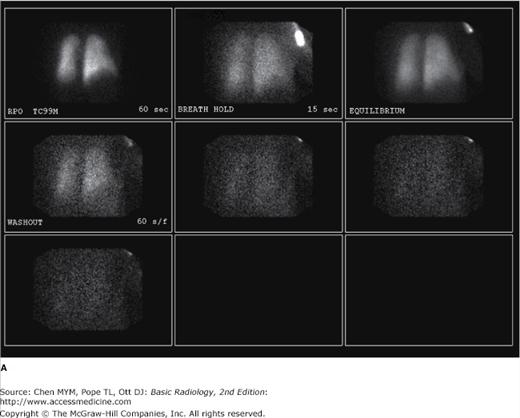
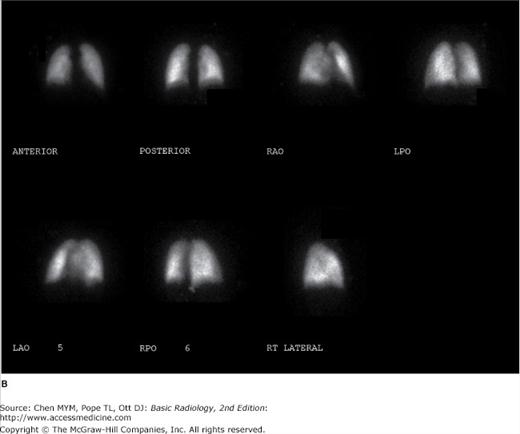
(A) Ventilation scan performed in the right posterior oblique projection shows normal wash-in of the xenon-133 gas and no retention of gas in any regions on the wash-out views. (B) Normal perfusion scan performed in seven projections, shows equal perfusion of radionuclide throughout all segments of the lungs. RAO, right anterior oblique; LAO, left anterior oblique; RPO, right posterior oblique; LPO, left posterior oblique.
Tomography is also available for radionuclide imaging. A PET scanner resembles a CT scanner and uses positron emitters (fluorine-18 [F-18] or carbon-11 [C-11]). Today, the most widely used positron emitter is F-18-fluorodeoxyglucose (FDG), which is used as a metabolic tracer. The raised metabolic rate can be used to distinguish neoplasm and inflammation from normal tissue. Although PET provides tomographic images, the spatial resolution (0.7 to 1.0 cm) is somewhat inferior to that of CT. This spatial resolution is improved by utilizing PET/CT fusion imaging in which a patient receives both a PET scan with F-18 FDG as well as a CT with or without contrast. These images can then be overlaid, or fused (Figure 4-6), to combine the spatial resolution of CT with the localization power of radionuclide imaging.
The principles and applications of MR are described in Chapter 1. Anatomic features of the chest that are readily identifiable on MR images are shown in Figures 4-7 and 4-8.
Figure 4-7.
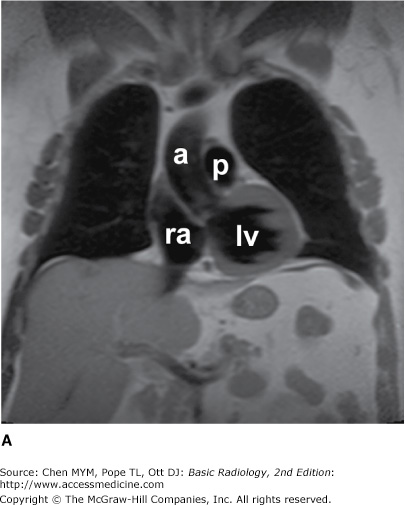
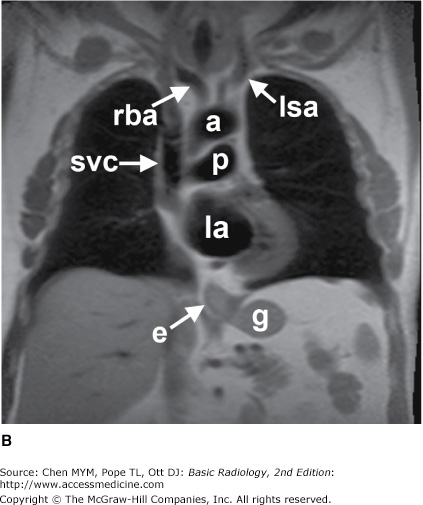
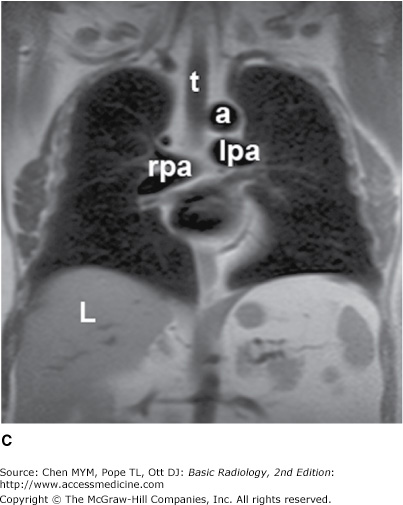
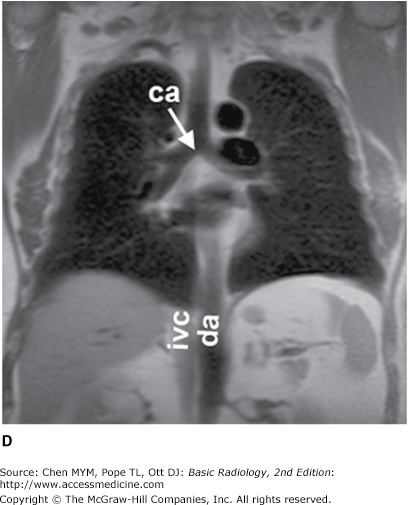
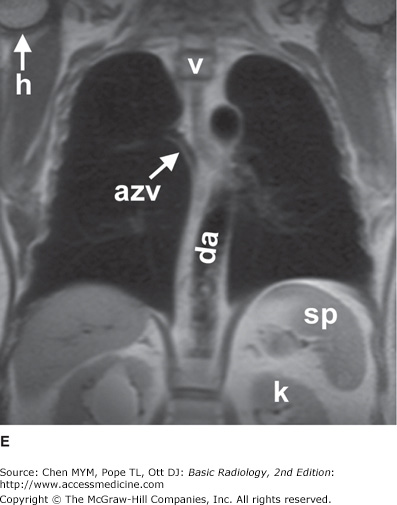
(A–E) Normal MR anatomy. Coronal spin-echo images of the thorax. a, aorta; azv, azygos vein; ca, carina; da, descending aorta; e, esophagus (seen distally); g, gastric fundus; h, humerus; ivc, inferior vena cava; k, kidney; L, Liver; la, left atrium; lpa, left pulmonary artery; lsa, left subclavian artery; lv, left ventricle; p, pulmonary artery; ra, right atrium; rba, right brachiocephalic artery; rpa, right pulmonary artery; sp, spleen; svc, superior vena cava; t, trachea; v, vertebral body.
Figure 4-8.
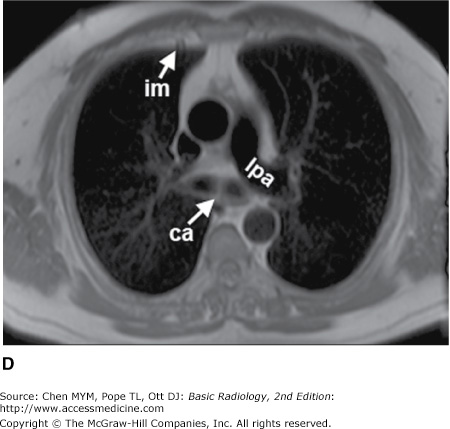
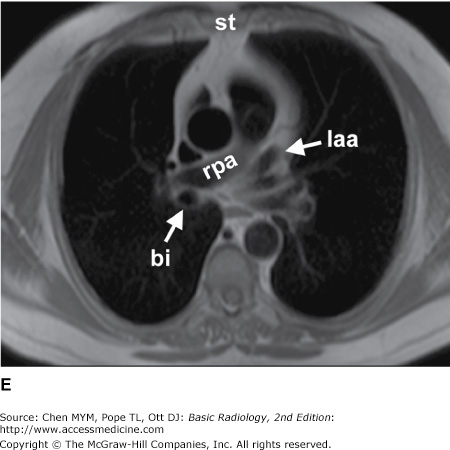
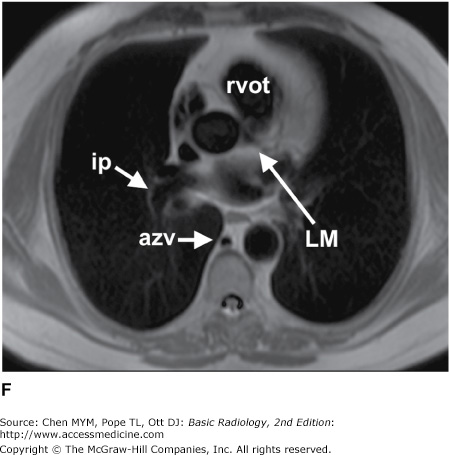
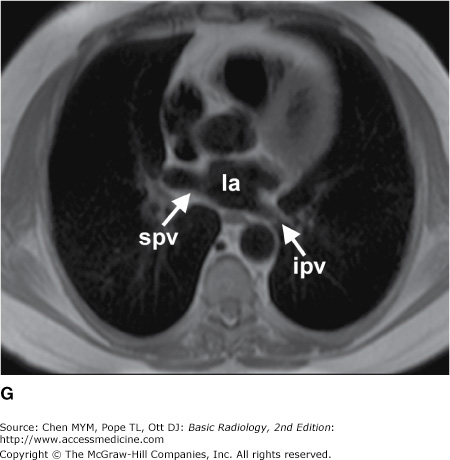

(A–L) Normal MR anatomy. Axial spin-echo images of the thorax. aa, ascending aorta; arch, transverse section of the aortic arch; azv, azygos vein; bi, bronchus intermedius; ca, carina; cs, coronary sinus; da, descending aorta; e, esophagus; g, gastric fundus; hazv, hemiazygos vein; im, internal mammary artery and vein; ip, interlobar (or descending) pulmonary artery; ipv, inferior pulmonary vein; ivc, inferior vena cava; ivs, interventricular septum; L, Liver; la, left atrium; laa, left atrial appendage; lbv, left brachiocephalic vein; lcc, left common carotid artery; LM, left main coronary artery; lpa, left pulmonary artery; lsa, left subclavian artery; lv, left ventricle; m, manubrium; pc, pericardium; ra, right atrium; rba, right brachiocephalic artery; rpa, right pulmonary artery; rv, right ventricle; rvot, right ventricular outflow tract; spv, superior pulmonary vein; st, sternum; svc, superior vena cava; t, trachea; v, vertebral body.
Ultrasound is described in detail in Chapter 1. Ultrasound of the chest is typically performed to evaluate fluid collections within the pleural space. Ultrasound may be used to guide thoracentesis, especially when the fluid collection is small or loculated. Less frequently, ultrasound is utilized to guide percutaneous biopsy of mediastinal or peripleural lung lesions. Advances in image fusion also allow fusion of ultrasound images with a separately performed CT examination, which can be useful for ultrasound-guided biopsies in the thorax.
Technique Selection
The number of diseases and clinical situations for which a chest radiograph may be indicated is so large that an exhaustive listing of individual indications is prohibitive. As a general rule, however, conventional radiographs should be obtained for any patient with symptoms suggesting disease of the heart, lungs, mediastinum, or chest wall. In addition, a chest radiograph is indicated for patients with systemic diseases that have a high likelihood of secondary involvement of those structures. Examples of the former are pneumonia and congestive heart failure and of the latter are a primary extrathoracic neoplasm and connective tissue disease.
In an acutely ill patient, the portable chest radiograph is an invaluable tool for monitoring the patient’s cardiopulmonary status. These radiographs are also used for monitoring of life-support hardware, such as central venous access catheters, nasogastric tubes, and endotracheal tubes.
Fluoroscopy provides real-time imaging of the chest. Fluoroscopy may be used to evaluate the motion of the diaphragm in a patient with suspected diaphragmatic paralysis. A paralyzed hemidiaphragm has sluggish motion as the patient breathes, and as the patient takes in a quick breath of air, it moves paradoxically upward as the normal hemidiaphragm moves downward (“sniff test”). Fluoroscopy and fluoroscopically positioned spot images are also useful for identification of calcification within a pulmonary nodule, within coronary arteries, or within cardiac valves. Fluoroscopic guidance can also be used for percutaneous transthoracic needle biopsy of lung masses.
Because the three dimensions of the thorax are captured on a single two-dimensional chest radiograph, superimposition of structures within the thorax may result in confusing shadows. Because CT provides images without this overlap, it is frequently used to clarify confusing shadows identified on conventional radiographs (Table 4-1). These examinations are also used to detect disease that is occult because of small size or a hidden position. Because of its wider range of density discrimination, CT can demonstrate mediastinal and chest wall abnormalities earlier than is possible with conventional chest radiography. Abnormalities of hilar structures can be identified on CT scans because of the decreased overlap of the complex structures of the hilum. CT scans of the chest are routinely ordered for oncology patients, both for evaluation of the extent of disease at presentation and for monitoring response to therapy or progression of disease. CT is useful for evaluation of the lung parenchyma, as thin sections (1 to 2 mm thick) reveal great anatomic detail. Thin-section CT (or high-resolution CT [HRCT]) may enable detection of occult pulmonary parenchymal disease and may be used for following the course of known pulmonary disease (Table 4-2). HRCT is especially useful in the diagnosis of interstitial lung diseases. Additionally, CT angiography (CTA) of the chest is particularly useful for the evaluation of vascular pathology as well as pulmonary embolus (Table 4-3). Because intravenous contrast material can be administered, vascular structures may be evaluated and the technique may be useful in patients with aortic dissection, aortic aneurysm, and superior vena caval obstruction. Because the cost of CT is approximately 10 to 20 times that of a PA and lateral chest radiograph, CT is not practical for monitoring the course of diseases on a daily basis.
Clarification of abnormal chest radiograph findings |
Staging of lung cancer and esophageal cancer |
Detecting metastatic disease from extrathoracic malignancy |
Evaluation of a solitary pulmonary nodule |
Suspected mediastinal or hilar mass |
Suspected pleural tumor or empyema |
Determining source of hemoptysis (eg, bronchiectasis) |
CT-guided percutaneous needle aspiration of lung and mediastinal masses |
CT-guided pleural drainage |
The diseases and situations for which nuclear medicine techniques are helpful are determined for the most part by the radioactive tracer, and these have been outlined in the technique section (Table 4-4).
Suspected pulmonary thromboembolism (V/Q scan) |
Differentiation of benign and malignant pulmonary nodule (PET) |
Staging of thoracic malignancy (eg, lung, breast, esophagus) (PET) |
Detecting recurrent or metastatic tumor (PET) |
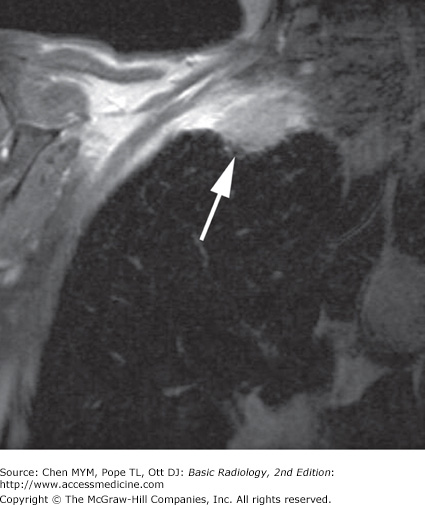
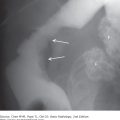
MR imaging of the thorax is most commonly used for cardiovascular imaging, but there are indications for MR imaging in mediastinal and pulmonary parenchymal imaging as well (Table 4-5). MR is helpful when bronchogenic carcinoma is suspected of invading vascular structures, including the cardiac chambers, pulmonary arteries and veins, and the superior vena cava. In a patient with suspected Pancoast’s (superior sulcus) tumor (Figure 4-9), MR imaging is preferred to CT because of the ability to obtain images in coronal and sagittal planes. The apex of the lung can be difficult to evaluate on axial images alone because of partial-volume effects.
Evaluation of a mediastinal mass |
Suspected Pancoast (superior sulcus) tumor |
Superior vena cava syndrome |
Staging of lung cancer, when CT suggests invasion of the heart, great vessel, chest wall, diaphragm |
Suspected aortic dissection |
Evaluation for central pulmonary embolus in patients with allergy to iodinated contrast media or renal failure |
Evaluation of the mediastinum and hilum in patients with allergy to iodinated contrast media or renal failure |
Congenital and acquired heart disease |
Ultrasonography is useful for imaging the soft tissues of the chest wall, heart, and pericardium, as well as fluid collections within the pleural space. Large, mobile pleural effusions are usually aspirated without sonographic guidance, because these collect predictably within dependent areas of the thorax. On the other hand, loculated pleural fluid collections may be difficult to aspirate without guidance, and the most appropriate entrance site may be marked with sonography for easier access. Ultrasonography has been used for guidance for biopsy of peripheral lung lesions as well.
Exercise 4-1. The Opaque Hemithorax
massive right pleural effusion.
total atelectasis of the right lung.
left pneumothorax.
aplasia of the right lung.
mediastinal hematoma.
left pleural effusion.
collapse of the left lung.
right pneumothorax.
collapse of the right lung.
mediastinal hematoma.
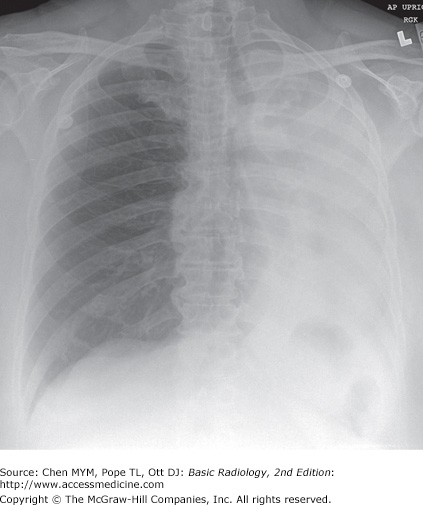
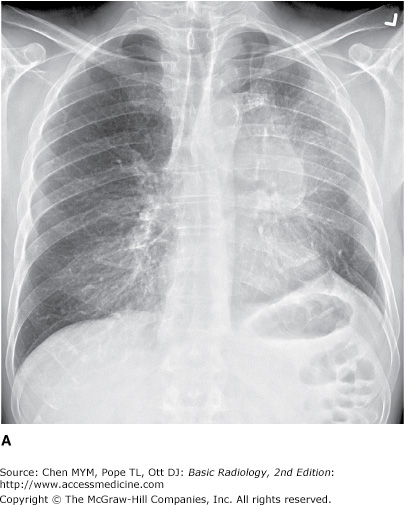
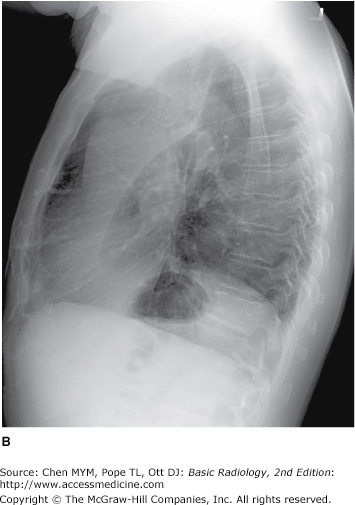
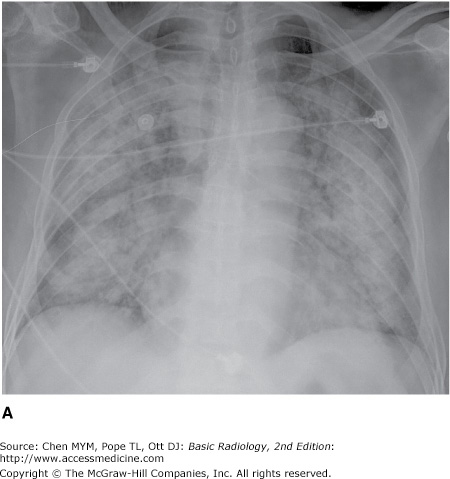
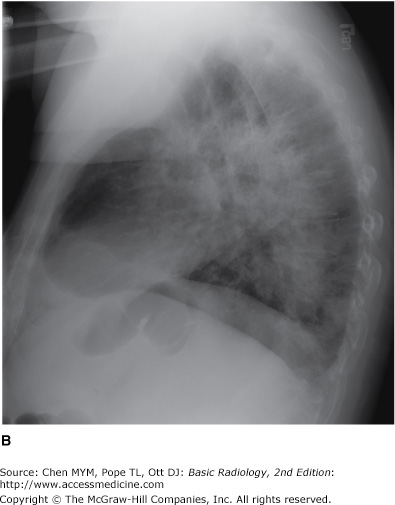
4-1. In this case, a frontal chest radiograph (Figure 4-10) shows that the right hemithorax is opaque. Signs of mass effect are present and suggest a space-occupying lesion in the right hemithorax. There is shift of the mediastinum toward the contralateral hemithorax, as evidenced by shift of the trachea and left heart border to the left. If a nasogastric tube were in place, esophageal shift could be inferred from the shift of the nasogastric tube. Space-occupying lesions also cause inferior displacement of the hemidiaphragm. Although the diaphragm itself is not visible, when the process is on the left, one can infer that the diaphragm is depressed by the inferior displacement of the gastric air bubble. Mass effect may also widen the distance between ribs. In this patient, the space-occupying lesion was a large right pleural effusion resulting from tuberculous empyema. A chest CT scan (Figure 4-12) in this patient shows the large pleural effusion and complete collapse of the underlying right lung against the medial aspect of the right hemithorax (A is the correct answer to Question 4-1).
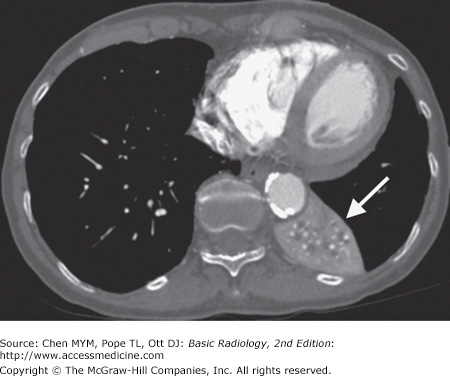
Figure 4-12.
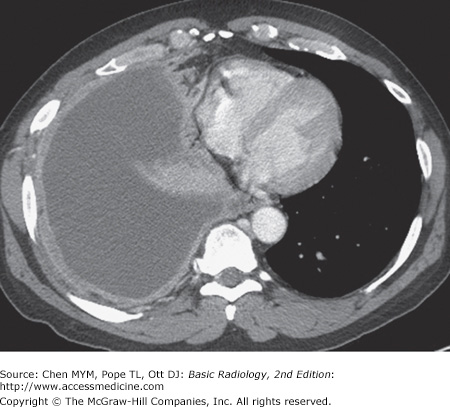
Axial CT scan of the chest of the same patient as in Figure 4-10 shows filling of the right pleural space by fluid, with compression of the right lung and displacement of the mediastinal contents into the left hemithorax. The pleural fluid in this case represented tuberculous empyema.
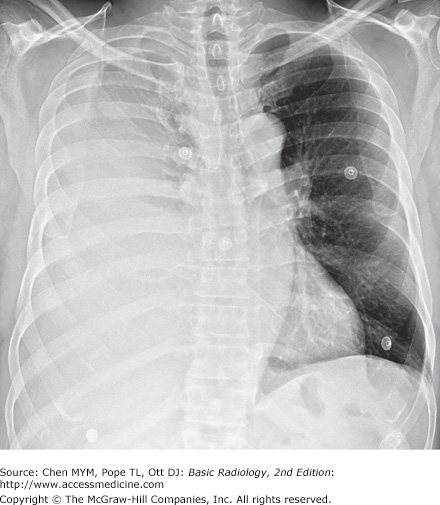
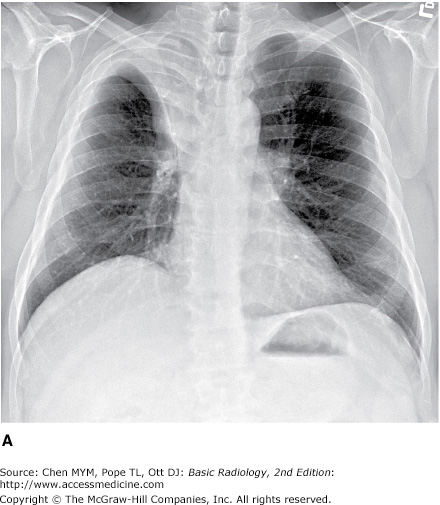
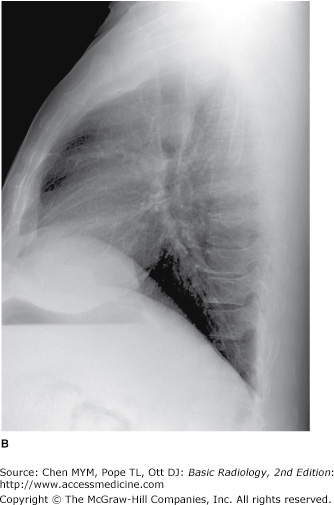
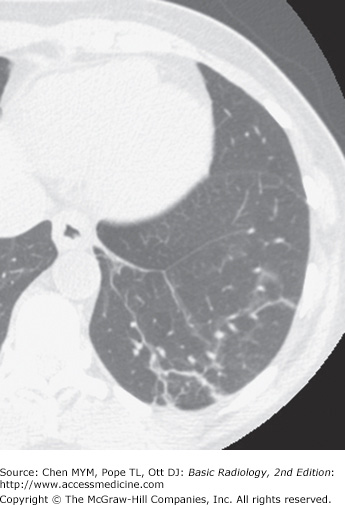
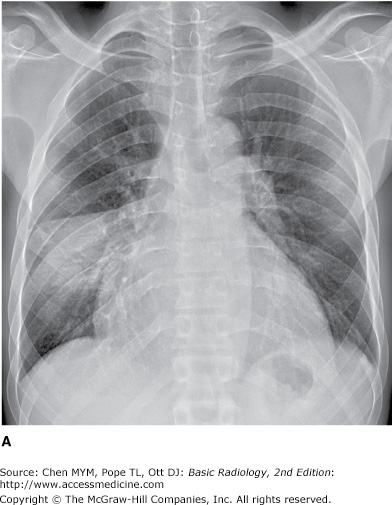
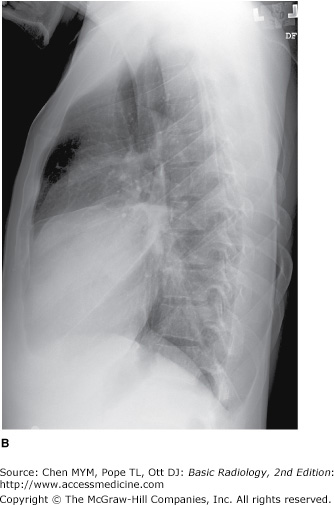
4-2. In this case, a frontal chest radiograph (Figure 4-11) shows that the left hemithorax is opaque. In contrast to the patient in Figure 4-10, the patient in Figure 4-11 has signs of volume loss within the left hemithorax. There is mediastinal shift toward the ipsilateral hemithorax, as evidenced by shift of the trachea and the right heart border into the left hemithorax. The gastric air bubble is higher in the left upper quadrant of the abdomen than is normally seen, because of elevation of the left hemidiaphragm. The mediastinal window of the chest CT examination (Figure 4-13 A) shows the mediastinal shift to the left and consolidation of the left lung. The lung window of the chest CT examination (Figure 4-13 B) shows that the right lung is aerated. In this patient, the left lung collapse is due to a bronchogenic carcinoma in the left main bronchus (asterisk). This case exhibits the signs of volume loss, as opposed to mass effect (B is the correct answer to Question 4-2).
Figure 4-13.
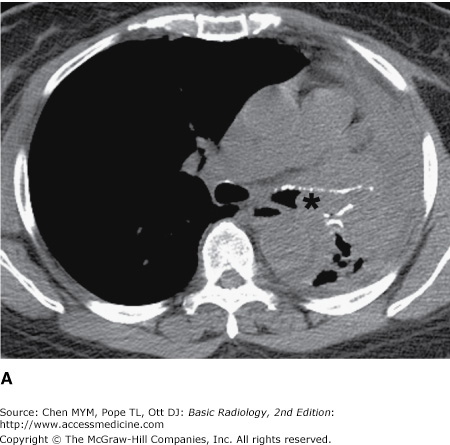
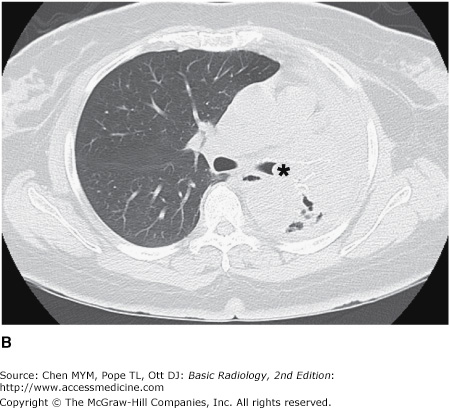
(A) CT scan of the same patient as in Figure 4-11 shows mediastinal shift to the left, consolidation of the entire left lung, and an endobronchial lesion in the left mainstem bronchus (asterisk). (B) Lung window shows that the right lung is overexpanded to compensate for the left lung atelectasis.
This exercise reviews the principal signs that allow one to distinguish mass effect from volume loss. The mass effect caused by a tumor or by a large pleural effusion expands the hemithorax and displaces the trachea, mediastinum, and diaphragm away from the mass. There may be a subtle increase in the distance between ribs. Volume loss, on the other hand, decreases the size of the hemithorax, and the trachea, mediastinum, and diaphragm move toward the involved hemithorax. The distance between the ribs on the abnormal side will be slightly decreased. In Figure 4-10, the opacification of the right hemithorax occurs as a result of massive right pleural effusion, and the right lung is collapsed as a result of both compression by the fluid present within the right pleural space and a loss of the negative intrapleural pressure that keeps the lung in close juxtaposition to the chest wall. In Figure 4-11, the collapse is due to obstruction of the left main bronchus, resulting in atelectasis (airlessness) of the left lung.
Exercise 4-2. Lobar Atelectasis
the major fissure in right upper lobe (RUL) collapse without a hilar mass.
the minor fissure in RUL collapse with a hilar mass.
the minor fissure in RUL collapse without a hilar mass.
the major fissure in RUL collapse with a hilar mass.
A triangular opacity is superimposed on the heart on the frontal radiograph.
The right heart border is obscured.
The minor fissure is superiorly displaced.
The right heart border is shifted to the left.
4-5. In Figure 4-16 A,B, a sign of left lower lobe collapse in this patient is which of the following?
Obscuration of the lateral wall of the ascending thoracic aorta
Superior displacement of the left hilum
Obliteration of the anterior aspect of the left hemidiaphragm on the lateral view
Triangular opacity in the left retrocardiac area on the frontal view
Shift of the major fissure toward the anterior chest wall on the lateral view
4-6. In Figure 4-17 A,B, signs of left upper lobe collapse seen in this patient include which of the following?
Crescent of air around the transverse section of the aortic arch resulting from hyperexpansion of the superior segment of the left lower lobe
Posterior displacement of the left major fissure on the lateral view
Obscuration of the right heart border
Tracheal deviation to the right
Inferior displacement of the left hilum
4-3. In Figure 4-14, there is opacity in the right upper lung that is sharply marginated on its inferior border. Volume loss is evidenced by the slight displacement of the trachea into the right hemithorax, the position of the right heart border further to the right of the thoracic spine than normal, and the slight elevation of the right hemidiaphragm, which is normally 1 to 1.5 cm higher than the left hemithorax. The pulmonary vessels of the right hilum are obscured by opacity in the right upper thorax. The configuration of the inferior margin of the opacity is that of a reverse S or S on its side. The “S-sign of Golden” describes the appearance of the minor fissure in right upper lobe collapse, which is due to bronchogenic carcinoma. In this case, bulky right hilar lymph-node enlargement has caused extrinsic compression of the right upper lobe bronchus and has resulted in right upper lobe collapse. The right hilar mass tethers the medial aspect of the minor fissure to its normal midthoracic position, whereas the lateral aspect of the minor fissure moves freely and collapses superiorly. In patients in whom the minor fissure is incomplete, collateral air drift across the canals of Lambert and the pores of Kohn may allow a lobe to remain aerated despite complete obstruction of its bronchus. In Figure 4-14 A, hyperexpansion of the superior segment of the right lower lobe produces the ovoid lucency on the medial aspect of the collapsed right upper lobe. On the lateral radiograph, a V-shaped opacity is seen at the lung apex. A mass-like opacity is superimposed on the suprahilar area, corresponding to a combination of tumor and atelectatic lung (B is the correct answer to Question 4-3). In patients with right upper lobe collapse without a hilar mass, the fissure is able to rotate in a straighter line and does not result in the reverse S sign. The major fissure is oriented in a coronal plane and is not normally visualized on the frontal chest radiograph. Therefore, the major fissure would not account for the opacity seen on the frontal chest radiograph, either with or without a hilar mass.
4-4. In Figure 4-15 A,B, the right heart border is obscured by adjacent opacity on the PA radiograph. The lungs are hyperinflated. The heart is in the midthorax in approximately its normal position. The heart border has not been displaced to the left. On the lateral radiograph, a narrow triangular opacity is superimposed on the heart. The apex of the triangle points toward the hilum, and the base of the triangle is against the anterior chest wall. This is a collapsed right middle lobe. The right hemidiaphragm is slightly elevated, but there are no other signs of significant volume loss. Right middle lobe collapse may have minimal impact on the overall volume in the right hemithorax because it is the smallest of the pulmonary lobes, and the upper and lower lobes can expand to compensate for its volume loss. Right middle lobe collapse, unlike other lobar collapse, is often due to benign causes, such as extrinsic pressure by enlarged lymph nodes, which totally surround the bronchus. This enlargement is most frequently due to granulomatous disease of an infectious or noninfectious nature (B is the correct answer to Question 4-4).
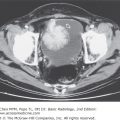
4-5. When the left lower lobe collapses, the result is a triangular opacity, which can be quite subtle, behind the heart. Secondary signs of volume loss, however, should prompt one to look closely for the collapse. These signs include shift of the trachea and heart to the left (note that the right heart border is now superimposed on the thoracic spine), inferior displacement of the left hilum, and elevation of the left hemidiaphragm. On the lateral radiograph, the right hemidiaphragm is visible along its entire contour. However, the left hemidiaphragm is obscured posteriorly because it is “silhouetted” by the collapsed left lower lobe. Because it is tethered medially by the inferior pulmonary ligament, the left lower lobe collapses posteriorly and medially (Figure 4-18). The major fissure is displaced posteriorly, as well as rotated into a more sagittal orientation than the normal coronal orientation (D is the correct answer to Question 4-5). You may have noted the large lung volumes in this patient, which are due to centrilobular emphysema. In this patient, who has a long history of cigarette smoking, a squamous-cell carcinoma in the left lower lobe bronchus was responsible for the collapsed left lower lobe.
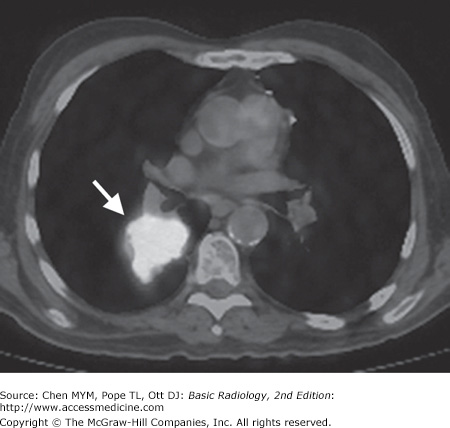
Figure 4-18.
Axial CT scan of the same patient as in Figure 4-16 shows a lenticular mass (arrow) within the posteromedial aspect of the left hemithorax. This represents the collapsed left lower lobe. Note the shift of the heart toward the left hemithorax.
4-6. The primary sign of volume loss in Figure 4-17 B is anterior displacement of the left major fissure on the lateral radiograph. The collapsed left upper lobe is opaque as a result of both airlessness and postobstructive pneumonitis. When there is little pneumonitis within the obstructed lobe, the left upper lobe can collapse completely behind the anterior chest wall, so that only a narrow band of opacity is visible behind the sternum. In this situation, the diagnosis may be suggested by the secondary signs of volume loss. Note the shift of the trachea to the left and the slight elevation of the left hemidiaphragm. The left lower lobe is hyperexpanded. The hyperexpanded superior segment of the left lower lobe produces a crescent of air around the transverse section of the aortic arch on the PA radiograph. A thin opaque line is visible at the apex of the left hemidiaphragm on the PA radiograph. Presence of this line, called a juxtaphrenic peak, should prompt one to look for upper lobe collapse. The hilum may be displaced anteriorly in left upper lobe collapse, but it is never displaced inferiorly. Option E, inferior displacement of the left hilum, is therefore false (A is the correct answer to Question 4-6). Because the lingular bronchus arises from the left upper lobe bronchus, the lingular segment of the left upper lobe is collapsed as well in this patient. The lingula is adjacent to the left heart border and is responsible for the obscuration of the left heart border in left upper lobe collapse.
The term atelectasis refers to volume loss, or airlessness, within the lung. The term collapse is often used to describe complete atelectasis of an entire lobe or an entire lung. Atelectasis can occur as a result of several pathophysiologic processes. Obstruction of a bronchus by bronchogenic carcinoma should always be considered in an adult with lobar atelectasis. The tumor may be within the bronchus (endobronchial), as occurs with squamous-cell carcinoma or small-cell undifferentiated carcinoma. The tumor may be outside the bronchus, and enlarged lymph nodes may cause extrinsic compression of the bronchus. In a child, aspiration of a foreign body is a more likely cause of obstruction of a bronchus. Complete obstruction of a lobar bronchus may not always result in lobar collapse because pathways of collateral ventilation are present within the lung. The pores of Kohn and the canals of Lambert allow collateral air drift between adjacent areas of lung but do not extend across pleural surfaces. The visceral pleural surface that covers the lung creates the interlobar fissures (minor fissure, major fissure) that separate lobes of the lungs. These fissures are not always complete, however, and may not extend entirely across the lung. When the right upper lobe bronchus is occluded, for example, the right upper lobe may remain partially aerated as a result of collateral air drift from the right middle lobe, around an incomplete minor fissure. Obstruction of smaller airways can occur as a result of mucous plugs, which are often present in intubated patients and in patients with chronic small airway disease.
Passive atelectasis (see Figure 4-10) occurs as a result of a space-occupying process within the pleural space. This is also called relaxation atelectasis, because the lung is no longer exposed to the negative intrapleural pressure that normally keeps the lung apposed to the chest wall. Any space-occupying pleural process, including a large pneumothorax (air in the pleural space), pleural effusion, hemothorax (blood in the pleural space), or pleural tumor, can cause atelectasis within the underlying lung. Compressive atelectasis is the term used to describe atelectasis caused by a space-occupying process within the lung itself. Cicatrization atelectasis describes the volume loss that occurs as a result of pulmonary scarring. Adhesive atelectasis occurs when there is a loss of the pulmonary surfactant that maintains the surface tension that keeps alveoli open. Adhesive atelectasis occurs with pulmonary embolism, and with respiratory distress syndrome of the newborn. Atelectasis of small areas of lung is often referred to as subsegmental atelectasis and may be recognized as linear bands of opacity, often at the lung bases (Figure 4-19).
It is helpful to remember the normal positions of the hemidiaphragms, trachea, mediastinum, and hila so that displacement of these structures can be readily noted. In most patients, the left hilum appears slightly higher than the right, because the left hilar opacity is predominantly due to the left pulmonary artery arching over the left main bronchus. The right hemidiaphragm is usually 1.0 to 1.5 cm higher than the left hemidiaphragm. The trachea should be in the midline, and the spinous processes of the upper thoracic vertebrae should be superimposed on the center of the tracheal air column. The right heart border normally lies just to the right of the thoracic spine. Subtle signs of volume loss may be more readily appreciated by comparison of the patient’s radiograph with baseline radiographs taken previously.
Exercise 4-3. Airspace Diseases
Collapse of the right upper lobe due to bronchial obstruction
Airspace consolidation of the right middle lobe
Empyema loculated within the right major fissure
Carcinoma in the right upper lobe
(Both of these patients have airspace opacities)
4-7. In this case (Figure 4-20), the opacity involves multiple lobes bilaterally (A is the correct answer to Question 4-7.).
4-8. In this case (Figure 4-21), the opacity is in the right middle lobe and obscures the medial margin of the heart. On the lateral view of this patient, the margins are sharply demarcated by the fissures, indicating the lobar nature of the process. Radiolucent structures that exhibit a branching pattern are noted to arborize through both opacities (B is the correct answer to Question 4-8.).
The patient in Figure 4-20 has pulmonary hemorrhage as a consequence of underlying Wegener’s granulomatosis, manifested as multilobar airspace disease bilaterally, also seen on CT (Figure 4-22). The patient in Figure 4-21 has pneumococcal pneumonia (Streptococcus pneumoniae) in the right middle lobe. The opacity seen on both radiographs is best described as airspace disease. The alveoli, or airspaces, that are normally filled with air have become filled with exudate. The exudate-filled alveoli surround the bronchi, so that the air-filled bronchi are visible as radiolucent branching structures within the more radiopaque background (Figure 4-23). Airspace disease is often lobar (Figure 4-21), multilobar, or diffuse (Figure 4-20) in distribution. The process may initially appear as multiple ill-defined nodules that rapidly coalesce. These nodules are the shadows of fluid-filled acini. They are 6 to 10 mm in diameter and always have ill-defined margins. The margins of these coalescing opacities are difficult to outline. Although there can be associated volume loss as the surfactant within the alveoli is lost, the signs of volume loss are often subtle and do not account for the opacity seen within the lung. Once airspace disease is identified, an attempt should be made to determine its cause. Airspace disease that appears suddenly or exhibits change over hours to days is due either to pulmonary hemorrhage or to contusion, pneumonia, or pulmonary edema (blood, pus, or water). The patient’s clinical history, physical examination, and laboratory data help to determine the most likely diagnosis. In patients likely to have infectious disorders, the responsible organism is usually not identified at first treatment, and the patient is just given antibiotics. In patients who do not respond to this initial treatment, an attempt should be made to identify the organism.
Figure 4-22.
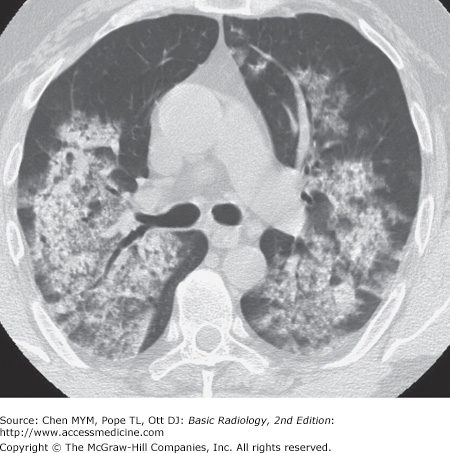
Axial CT image of the patient in Figure 4-20 shows diffuse airspace opacities representing blood-filled alveoli in this patient with hemoptysis.
Related posts:

Stay updated, free articles. Join our Telegram channel

Full access? Get Clinical Tree


