Radiology of the Urinary Tract: Introduction
Five years is a long time in radiology, and the pace of change in imaging has even quickened since the prior edition of this text. The increasing availability and technical capability of cross-sectional modalities such computed tomography (CT), magnetic resonance imaging (MRI), and ultrasound (US) now dominate imaging of the urinary system with multidetector (spiral) CT having the greatest impact. In our department, CT is called the “temple of truth” for good reason. These cross-sectional modalities have essentially eliminated the intravenous pyelogram (IVP), which after 70 years of being the backbone of urinary tract imaging, has had its epitaph written, and has little if any role in modern-day urinary imaging. The result of these progressive advances in imaging continues to be improved, earlier, and more accurate diagnosis of genitourinary tract disease.
This chapter introduces the basic concepts in imaging of the urinary tract. First, the imaging modalities currently in clinical practice and principles of their interpretation are discussed, especially regarding normal anatomy and its variants. The importance of choosing the most appropriate study for a given clinical scenario cannot be overemphasized, and the next section of the chapter reviews technique selection. A series of clinical exercises and case examples follow, demonstrating important imaging concepts and diseases of the urinary tract. Finally, suggested readings is provided at the end of the chapter.
Techniques and Normal Anatomy
This section introduces the common radiologic techniques used in evaluation of the urinary tract, with emphasis on an overview of each technique as it applies to the urinary tract. A discussion of normal anatomy and some important fundamental concepts of interpretation are included. A basic knowledge of the gross anatomy is assumed, with emphasis placed on the radiographic anatomic correlations.
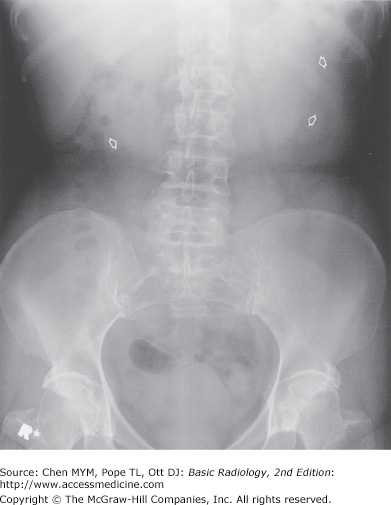
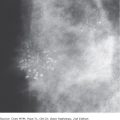
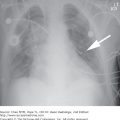
Conventional radiographs, or “plain films,” are an inexpensive, quick overview of the abdomen and can occasionally provide useful diagnostic information for selected urinary tract indications. A radiograph of the abdomen when used to evaluate the urinary tract is often referred to as a KUB (kidney, ureter, and bladder). “Gas, mass, bones, stones” can be used as a reminder of main areas to examine on the abdominal radiograph. On the normal abdominal radiograph, the renal outline may be visible adjacent to the upper lumbar spine and should be bilaterally symmetric and measure between 3 and 4 lumbar vertebrae in length. The ureters are not discernable, although knowledge of their normal course, between the tips of lumbar transverse process tips and pedicles, along the mid sacral ala, and finally gently coursing laterally below the sacrum to enter the bladder, allows for potential stone identification. The distended bladder may also be visible, if outlined by fat, on the KUB. The most common genitourinary findings seen on abdominal radiography will be in the form of urinary tract calcifications (Figure 9-1). Unfortunately, the KUB suffers from poor sensitivity and specificity regarding urinary tract calcifications. In the past, it was reported that 80% of calculi were radiopaque and could be identified on conventional radiographs. However, recent studies suggest that no more than 40% to 60% of urinary tract stones are detected and accurately diagnosed on plain radiographs. The sensitivity for detection of stones is limited when the calculi are small, of lower density composition, or when there is overlapping stool, bony structures, or air obscuring the stones. Additionally, the specificity of conventional radiography is somewhat limited because a multitude of other calcifications occur in the abdomen, including arterial vascular calcifications, pancreatic calcifications, gallstones, leiomyomas, and many more (more than 200 causes of calcification in the abdomen have been described). Phleboliths, which are calcified venous thromboses, are especially problematic because they frequently overlap the urinary tract and are difficult to differentiate from distal ureteral stones. Lucent centers are a hallmark of phleboliths, whereas renal calculi are often most dense centrally. Rarely, the conventional radiograph may suggest a soft-tissue mass or abnormal air (gas) within the urinary tract. Emphysematous pyelonephritis, a urologic emergency with high mortality, is the result of a renal infection by gas-producing organisms and may be diagnosed on plain films by mottled or linear collections of air within the renal parenchyma. Bony lesions, such as sclerotic bony changes, can suggest metastatic prostate cancer, and lytic bony lesions can be seen with disseminated renal cell carcinoma. Additionally, the bony changes of renal osteodystrophy (diffuse bony sclerosis) may be identified on plain radiographs. Vertebral anomalies are associated with congenital malformations of the urinary tract. Thus, although the KUB is limited by low sensitivity and specificity, close examination of the “gas, mass, bones, stones” may yield important, sometimes critical, diagnostic information.
Multidetector (spiral) CT is now the dominant radiologic imaging modality for evaluation of the urinary tract and adrenal glands. Several factors make CT quite effective. The high contrast and spatial resolution afforded by CT allow detection and evaluation of subtle differences in very small structures. Mathematical calculations of the attenuation of the CT x-ray beam allow quantitative evaluation of the relative density of structures (ie, their Hounsfield units) and by using these “CT numbers,” much unique diagnostic information on the urinary tract is gained. Examinations can be performed quickly and reproducibly with thin CT slices of the entire urinary tract now obtainable in just a few seconds. With these advances, CT can now be used to evaluate much of the urinary tract, including vascular, parenchymal, and urothelial components as well as adjacent structures including the adrenal glands.
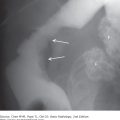
Careful techniques and protocols are critical to CT accuracy. CT scans of the urinary tract may be performed with and/or without intravenous iodinated contrast material depending on the indications. CT performed without contrast is typically used for the detection of renal or ureteral calculi, for which it is exquisitely sensitive. Additionally, noncontrast views of the kidneys serve as a baseline to evaluate for lesion enhancement after contrast administration, a critical factor in mass evaluation. Intravenously administered iodinated contrast is excreted by the kidney primarily by glomerular filtration, opacifying the urinary tract progressively from the kidney through the ureter and to the bladder. Contrast “opacification” during CT is most accurate, exquisitely demonstrating and evaluating the urinary tract. One of the major advances in the past 5 to 10 years has been advent of CT urography (CTU), a superior replacement of the IVP. CTU is most often indicated for evaluation of hematuria and typically consists of three scanning phases—noncontrast, nephrographic (90 seconds), and delayed (8 to 10 minutes) excretory phase. The noncontrast phase allows for stone detection and serves as a baseline to assess possible mass enhancement. The nephrographic phase is predominately used to evaluate the kidneys for mass lesions. Finally, the excretory phase allows assessment of the collecting system, particularly for the detection of urothelial carcinoma (Figure 9-2). Frequently, the axial CT images are augmented with multiplanar and three-dimensional reconstructions (Figure 9-3).
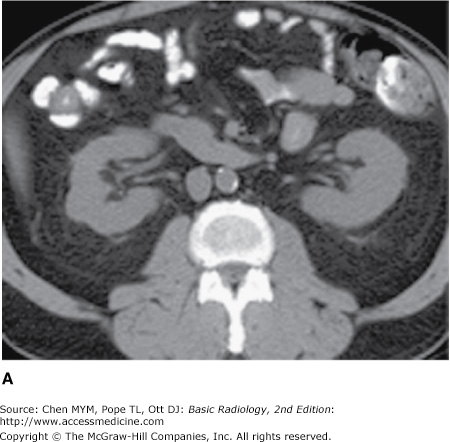
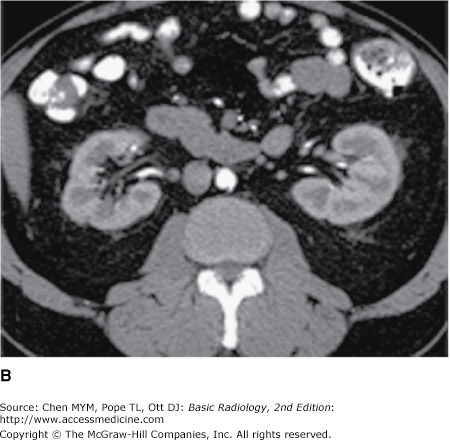
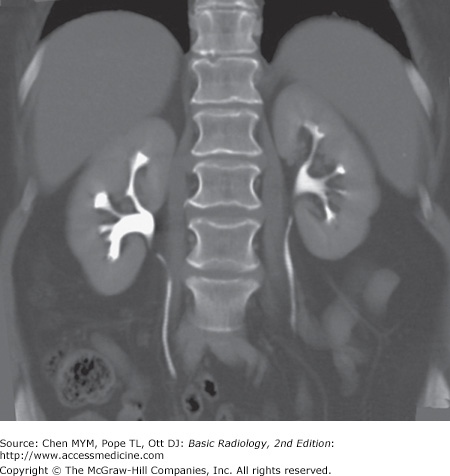
Figure 9-2.


Normal CT urogram. Note the homogeneous renal density on the noncontrast images (A), with bright enhancement of the renal parenchyma during the nephrographic phase (B), followed by intense opacification of the collecting system during the excretory phase (C). Multiplanar reformats are often very helpful (D).

The kidneys, which enclose the renal sinus and are surrounded by retroperitoneal fat, are well delineated on CT. The renal parenchyma is composed of outer cortex, containing much of the nephron, as well as the pyramid-shaped collecting duct containing inner medulla. On noncontrast examinations, the kidneys are homogeneous and have a density similar to most soft tissue (Figure 9-4 A). With rapid scanning after contrast administration, several sequential phases of opacification within the kidney can be delineated by CT including the corticomedullary, nephrographic, and excretory phases. The corticomedullary phase can be seen if scanning is performed during the first 20 to 70 seconds after contrast administration and represents the early preferential blood flow to the renal cortex (Figure 9-4 B). Subsequently, contrast begins to pass into the distal collecting tubules within the renal medulla, resulting in a more homogeneous opacification of the renal parenchyma termed the CT nephrographic phase (Figure 9-4 C). This generally occurs around 90 to 120 seconds after contrast medium injection. Finally, the excretory phase is seen when contrast opacifies the collecting system. Each different phase of opacification may better demonstrate different disease processes, and thus various scanning protocols are used to evaluate the kidneys depending on the clinical indication.

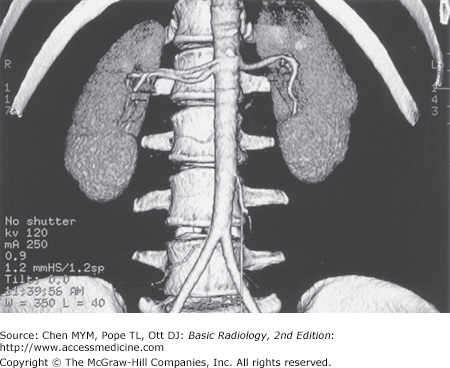
On CT, the kidneys should be evaluated for size, location, orientation, and contour (Figure 9-5). The kidneys are typically located at the level of the upper lumbar spine with the right kidney slightly lower than the left. They generally lie with their axes along the psoas muscles with the upper pole slightly more medial than the lower pole. Alterations in position and orientation of the kidneys may be related to congenital anomalies such as pelvic kidneys or may be secondary to mass effect from an adjacent lesion. The size of the kidneys is somewhat variable depending on the age, sex, and size of the patient, but generally range from 11 to 14 cm. Although the right is often slightly smaller than the left, the kidneys should be relatively symmetric in size, with a discrepancy greater than 2 cm suggesting pathology. There are a number of causes of abnormal renal size, ranging from incidental anomalies such as congenital renal hypoplasia to clinically significant conditions such as renal artery stenosis (small kidney) or infiltrating renal neoplasm (large kidney). The kidneys should have a reniform shape and a smooth contour. Clefts suggest scarring, which most often results from chronic vesicoureteral reflux/chronic bacterial pyelonephritis or from renal infarcts. Additionally, the kidneys should be evaluated for calcifications, hydronephrosis, and inflammation. A critical role for CT is mass/cyst detection and characterization. CT is very specific in identifying a lesion as a simple cyst when the lesion is homogenous and of water density, typically <10 HU. Lesions of higher density may represent hyperdense (complex) cysts or solid masses, and further evaluation with contrast CT to detect enhancement may be needed to differentiate these causes. Fat within a solid mass generally allows a confident diagnosis of angiomyolipoma. A solid, non-fat-containing mass in the adult should be considered a renal cell carcinoma until proven otherwise. CT is also useful in staging renal neoplasms. Non-neoplastic renal disease, such as trauma and complicated infections, is accurately demonstrated on CT, providing specific information regarding the extent and severity of the process. The remainder of the retroperitoneum, containing fat, the normal occupants of the retroperitoneum (kidneys, adrenal glands, pancreas, duodenum, and parts of the colon), and vascular structures, is well seen by CT, and diseases such as inflammation, infection, and neoplasms are readily demonstrated. Additionally, the thin section and rapid imaging of modern CT also allows noninvasive evaluation of the vascular system, including the major renal arterial and venous structures (Figure 9-6).
As previously mentioned, the unenhanced CT of the urinary system, commonly referred to as the urinary tract CT or “stone study,” is the procedure of choice for the detection of urolithiasis and associated obstruction, with unmatched specificity and sensitivity. There are many other advantages to using CT to evaluate suspected ureteral stones, including speed of the examination, identification of alternative explanations for the pain (appendicitis, diverticulitis, aneurysm, etc), and elimination of intravenous contrast complications. Scans no thicker than 5 mm are performed from the top of the kidneys to the symphysis pubis. The ureter can be visualized and followed from the renal pelvis to the bladder in most cases and appears as a tubular 2- to 3-mm fluid structure surrounded by retroperitoneal fat. Stones can be diagnosed by their high density and location within the ureter. Secondary signs of obstruction have been described, including dilation of the proximal ureter. As on the KUB, phleboliths can prove troubling because of their frequent close approximation with the distal ureter; however, their central lucency, lack of surrounding inflamed ureteral wall, and lack of secondary signs of obstruction usually allow their distinction.
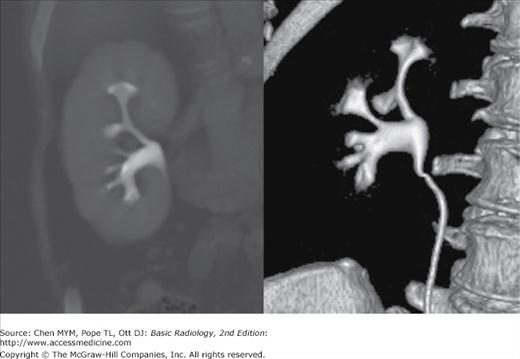
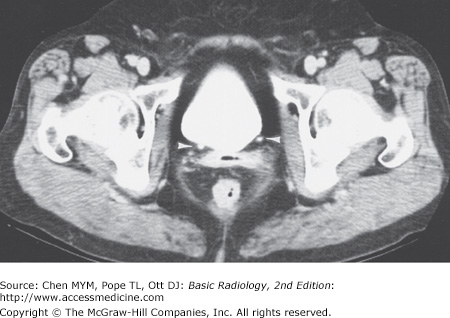
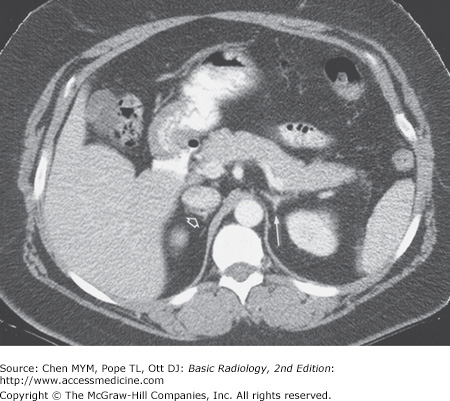
Although visible without contrast material, the intrarenal collecting system, ureters, and bladder are conspicuous and nicely demonstrated when contrast material has been administered and delayed images obtained. Collecting system anatomy is now visible in fine detail with the use of modern high-resolution (<1 mm) spiral CT and multiplanar (coronal, sagittal) and three-dimensional reformat methods. The intrarenal collecting system consists of calyces, infundibula, and the renal pelvis. Normally, each kidney consists of 7 to 14 evenly distributed calyces (Figure 9-7). The individual renal calyx, from the Latin for “chalice,” is a delicate-appearing cup-shaped structure. Not uncommonly, partial fusion of the calyces occurs, especially in the renal poles, creating the compound calyx. Other calyceal variants occur, including variants of number (polycalycosis, unicalyx kidney) and size (megacalycosis, microcalyx) and must be differentiated from true pathology. The normal delicate, cuplike appearance can be distorted or irregular in conditions such as papillary necrosis, tuberculosis, or urothelial (transitional cell) carcinoma. Diverticula may arise from the calyces creating a haven for stone formation, recurrent infection, or even transitional-cell malignancy. The renal pelvis is also quite variable in appearance. A common variation is the so-called extrarenal pelvis, where the pelvis lies outside the renal sinus. In this setting, the pelvis tends to be more prominent and rounded, mimicking hydronephrosis. This can be differentiated from true obstruction by normal-appearing calyces. The ureters appear as contrast-containing, rounded structures in the retroperitoneum (Figure 9-8). Because of peristalsis, portions of the ureters may be collapsed. On CT, the bladder appears as a rounded water or contrast density structure in the pelvis. Detection of malignancy arising from the urinary tract epithelium is a major concern, particularly with the advent of CT urography. Urothelial neoplasia generally appears as papillary solid lesions arising from the urothelial mucosa. Occasionally, urothelial neoplasm may appear as a more flat area of mucosal thickening. The urethra is not normally seen on CT.
The adrenal glands are well seen on CT, appearing as linear, arrowhead, or inverted Y-shaped structures usually consisting of body and medial and lateral limbs (Figure 9-9). The adrenal glands are normally less than 1 cm in thickness and 3 to 4 cm in length. They lie cephalad to the kidneys, with the right just posterior to the inferior vena cava (IVC) and the left anteromedial to the upper pole of the left kidney. Note that the embryological and functionally distinct outer cortex and inner medulla are not visibly separable. Although occasionally affected by trauma or infection, the adrenal mass evokes the most attention, and for this CT evaluation is well suited.
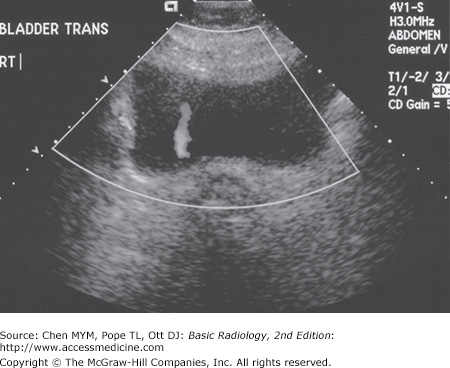
Ultrasound is a useful technique for evaluation of the urinary tract, with its principal advantages including wide availability, no need for intravenous contrast material, and lack of ionizing radiation. The kidneys are generally well seen by a posterior or lateral approach in all but the largest of patients (Figure 9-10). The renal medulla is hypoechoic (darker) relative to renal cortex and can be identified in some adults as cone-shaped central structures. In some patients, this corticomedullary distinction is not visible and should not be considered pathologic. The renal cortex is isoechoic or slightly hypoechoic compared with the echogenicity of the adjacent liver. Renal echogenicity exceeding that of the liver is abnormal and requires explanation. Most commonly, hyperechoic kidneys are the result of medical renal disease, such as end-stage hypertensive glomerulosclerosis. In addition to echogenicity and as with CT evaluation, the kidneys should be assessed for size, location, and symmetry. Scarring and masses can be evaluated. US assessment is often specific in identifying simple or mildly complicated cysts and differentiating these lesions from a solid mass. Solid masses, however, remain nonspecific and generally require further evaluation. There are normal variants that can mimic mass lesions, including dromedary humps, as well as central prominences of normal renal tissue interposed between lobes referred to as persistent columns of Bertin. Additionally, the parenchyma near the renal hila may appear prominent as well, occasionally mimicking a mass. Each of these variants may be distinguished by its normal echogenicity, lack of mass effect, and characteristic location. Occasionally, additional imaging with CT or MR may be required in equivocal masses. The renal sinus is the area engulfed by the kidney medially, harboring the renal pelvis, arteries, veins, nerves, and lymphatics that enter and exit the kidney, all contained within a variable amount of fat. Fat is typically brightly echogenic on ultrasound, and fat within the renal sinus dominates the ultrasonographic appearance, creating what is known as the “central echo complex.” The size of the central echo complex is variable, often more prominent in the elderly and minimal in the child. Absence of the central echo complex may suggest a mass such as a urothelial carcinoma replacing the normal fat. Alternatively, the complex may be very prominent in the benign condition of renal sinus lipomatosis. Calcifications often have a typical appearance on ultrasound, being brightly echogenic and resulting in shadowing posteriorly as the sound waves are attenuated. Renal stones or calcifications may be detected within the renal parenchyma or in the intrarenal collecting system. The echogenicity of the normal renal sinus, however, may be problematic by obscuring or mimicking small stones. Ultrasound is also excellent for detecting hydronephrosis, with the distended collecting system easily recognized within the central echo complex. The ureters are not normally seen on ultrasound because of obscuring overlying tissue and their small size. Evidence of their patency may be verified by Doppler detection of urine rapidly entering the bladder from the distal ureters that is, distal ureteral jets (Figure 9-11). The bladder is seen as a rounded or oval anechoic (fluid) structure in the pelvis. The bladder may demonstrate mass lesions, such as transitional-cell carcinoma, or stones. The urethra is not typically seen by ultrasound, although urethral diverticula may occasionally be demonstrated.
Figure 9-10.

Normal renal ultrasound, long axis view (A) and drawing (B). Note the smooth contour of the kidney. The rounded to cone-shaped medullary pyramids are hypoechoic to the cortex and should not be mistaken for a mass or dilated collecting system. The renal cortex should be similar to or slightly hypoechoic compared with liver. In addition, notice the hyperechoic fat of the renal sinus—the central echo complex.
Just as with CT, technical advances in MR imaging have led to increasing use in urinary tract imaging. Fast scanning techniques allowing breath-hold imaging, combined with the spectacular tissue contrast of MR imaging and the ability to directly image in any plane, make this an attractive modality for evaluating the urinary tract. Lack of ionizing radiation adds to its appeal, although cost, availability, claustrophobia, and the contraindication of certain materials including pacemakers remain major drawbacks. Finally, MR imaging of the kidney is performed with gadolinium as the contrast agent, not iodinated contrast material. The risk of contrast-induced nephropathy is minimal because of the very low concentrations of gadolinium chelate used in a typical MR study. A new phenomenon, however, has been described known as nephrogenic systemic fibrosis (NSF), which is a systemic disorder associated with significant morbidity and mortality, almost always seen in end-stage renal disease patients with a glomerular filtration rate (GFR) of less than 30 mL/min. Previously, MR was used as a primary modality in patients with renal insufficiency to avoid iodinated contrast nephropathy, but the advent of NSF as a clinical entity has contraindicated contrast-enhanced MR in these patients.
On MR imaging, the kidneys appear of variable signal intensity depending on the imaging factors, and as in CT, contrast-enhanced phases of imaging (arterial, corticomedullary, nephrographic, and excretory) are all visible (Figure 9-12). Specific imaging sequences are designed to manipulate imaging factors to allow for optimum evaluation of the particular clinical concern. The ability to image in any plain is advantageous for MR imaging. The kidneys should be evaluated in a similar fashion to that of other modalities. Finally, the adrenal glands are well seen by MRI, similar to CT; the normal shape is the same as described for CT, and the signal intensity depends on particular imaging parameters. The ureters and bladder can also be evaluated and are well depicted.
Figure 9-12.
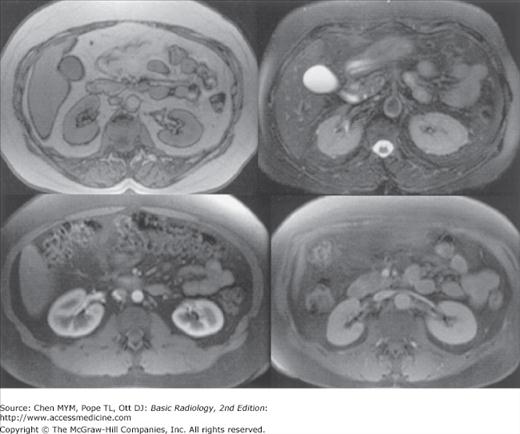
Normal MRI of the kidneys. The appearance of the kidneys is variable on MRI depending on imaging factors. The top left image is a T1-weighted sequence, and the top right is T2 weighted, whereas the bottom images were obtained after gadolinium injection and demonstrate corticomedullary and nephrographic phases.
MR urography is an emerging modality that promises to offer, or perhaps exceed, many of the benefits of CT urography without the use of ionizing radiation or the need for contrast administration (in some protocols). No consensus protocol for MR urography exists at this time. Many protocols, referred to as “static-fluid MRU,” use T2-weighted techniques only, analogous to MR cholangiopancreatography (MRCP). Techniques using IV gadolinium, “excretory MRU,” use multiphase T1 imaging in a manner similar to CT urography to evaluate the renal parenchyma and collecting system. Interpretation of the renal collecting system, ureters, and bladder with MR urography is similar to that of CT urography. A major limitation of MR urography is the limited sensitivity for calculi relative to CT. MR urography is equally sensitive for congenital or acquired structural anomalies. Relative sensitivity and specificity of MR versus CT urography for urothelial neoplasm is not well established. Although MR urography is proving effective for many of the indications of CT urography, the excellent availability, reproducibility, and performance of CTU as well as the cost, time, and insensitivity to stone disease has limited the utility of MRU.
Note should also be made of the developing use of MR in the staging of prostate cancer. MR of the prostate with the use of an endorectal coil is now in clinical use as a staging tool for diagnosed prostate cancer, assessing size of lesions, adenopathy, and involvement of other pelvic structures. Other benign prostatic processes mimic the signal characteristics of carcinoma, limiting the specificity of MR for screening and initial diagnosis. Correlation of MRI findings with prostate-specific antigen levels and with MR spectroscopy yields higher specificities; however, in clinical practice sonographically guided transrectal biopsy remains the standard of care for initial diagnosis.
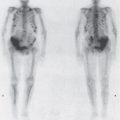
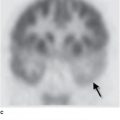
The basic technique of a nuclear medicine study is discussed in Chapter 1, whereas here we briefly examine the more specific role in evaluation of the urinary tract. In general, the value of nuclear imaging in the urinary tract is severalfold: functional information related to the quantifiable collected data, lower radiation dose than traditional radiographic techniques, and very low incidence of complications. Renal evaluation is typically performed by intravenous bolus injection of renal specific agents such as technetium-labeled mercaptoacetyltriglycine (Tc-MAG3). Images are acquired every few seconds demonstrating renal blood flow with additional images obtained over several minutes showing renal uptake and excretion. The recorded data can be used to produce images, but it also is quantifiable and is employed to generate time-activity curves (Figure 9-13). Information about renal perfusion, morphology, relative function of each kidney, and excretion can be extremely useful in evaluation of conditions such as renovascular hypertension, obstruction, and renal transplant examination. Although anatomically oriented data can be obtained with other radioisotopes that aggregate more in the renal parenchyma, in general, nuclear medicine renal studies suffer from fairly low spatial resolution and are therefore often used in conjunction with other imaging studies. Radionuclide cystography is another useful test used to diagnose and monitor vesicoureteral reflux. Here, technetium pertechnetate is mixed with saline and infused into the bladder with subsequent images obtained over the urinary tract. This study is quite sensitive for the detection of significant reflux, but at a considerably lower radiation dose than conventional cystography, making it particularly useful in children, especially in those needing follow-up and repeated imaging. Another important study is the radioactive iodine labeled metaiodobenzylguanidine (MIBG) examination. MIBG collects in adrenal medullary tissue and is useful in diagnosis and evaluation of pheochromocytoma. Positron emission tomography (PET) is evolving as a powerful imaging tool, especially when combined with CT (PET/CT), combining the functional data of PET with the anatomic CT information. Unfortunately, fluorine-labeled deoxyglucose (FDG), which is the primary agent used in PET/CT, is normally excreted by the kidneys, obscuring urinary tract pathology and limiting utilization. PET/CT has, however, shown promise in evaluation of possible metastatic disease.

Direct injection of water-soluble iodinated contrast material is a useful method of examining various regions of the urinary tract. The advantage of this method of evaluation is the direct control over the contrast injection rather than reliance on secondary excretion from the kidney.
Related posts:

Stay updated, free articles. Join our Telegram channel

Full access? Get Clinical Tree


