Abstract
Objective
To evaluate the response to neoadjuvant therapy in patients with colorectal liver metastases (CRLMs) using ultrasound(US) and contrast-enhanced ultrasound(CEUS), with correction to the tumor regression grade (TRG) of pathological results.
Methods
This study included patients with resectable CRLMs admitted from February to December 2022. After at least 4 cycles neoadjuvant therapy, all the patients received US and CEUS examinations within two weeks before hepatectomy. CEUS clips were postprocessed with color parameter imaging (CPI) and microflow imaging (MFI) analysis. Logistic regression analyses were used to develop an evaluation Nomogram. Ultrasound-based model was constructed to discriminate between the response (TRG1/2/3) and nonresponse (TRG4/5) groups at the lesion level. The model’s predictive ability was evaluated using the C index and calibration curve, with decision curve analysis assessing the Nomogram’s added value.
Results
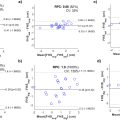
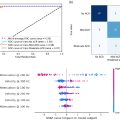
The study analyzed 105 CRLM lesions (the lesion with the highest diameter analyzed for each patient), with 43.8% showing a response to therapy. Univariate analysis identified calcification on US ( p = 0.039), CEUS enhancement degree ( p < 0.001), CEUS enhancement pattern (p<0.001), CEUS washout type ( p < 0.001), CEUS necrosis ( p < 0.001), CPI feeding artery ( p = 0.003) and MFI pattern ( p < 0.001) were significantly associated with TRG. The multivariate analysis showed CEUS enhancement pattern ( p = 0.026), CEUS washout type ( p = 0.018) and CEUS necrosis ( p = 0.005) were independently associated with the neoadjuvant therapy response. A Nomogram with the three independent predictors was developed, with an AUC of 0.898.
Conclusion
The ultrasound-based model provided accurate evaluation of pathological tumor response to preoperative chemotherapy in patients with CRLM, and may help to decide the individualized treatment strategy.
Introduction
Colorectal cancer ranks as the third most prevalent cancer and the second leading cause of cancer-related mortality globally [ ]. Liver metastasis occurs in about half of colorectal cancer patients and has been the primary cause of mortality in this population. Surgical resection stands as the foremost efficacious treatment for colorectal cancer liver metastasis (CRLM) [ ]. According to NCCN (national comprehensive cancer network) clinical practice guidelines in oncology (colon cancer, version1.2024), six months of perioperative systemic therapy should be administered to patients with synchronous or metachronous resectable metastatic disease. When a response to systemic therapy would likely convert a patient from an unresectable to a resectable disease state, this therapy should be initiated. First-line systemic treatment options for patients with CRLM include FOLFIRI, FOLFOX, CAPEOX, and FOLFIRINOX, with the option of adding bevacizumab to any of these regimens. Despite oxaliplatin and irinotecan are associated with sinusoidal injury and steatohepatitis, respectively [ ], preoperative chemotherapy is commonly administered to the majority of patients with CRLMs undergoing curative-intent surgery, as it has been shown to enhance oncologic outcomes [ ].
Evaluation of preoperative systemic treatment efficacy is crucial for patients’ clinical treatment decisions. Patients whose liver metastases respond to preoperative chemotherapy tend to continue to receive the same regimen after surgery, whereas those whose lesions progress may not be candidates for surgery due to their poor prognosis following resection [ ]. The current standard method for assessing tumor response is RECIST 1.1, which evaluates therapeutic efficacy through the assessment of tumor size [ ]. However, a bi-center study revealed a 40% inconsistency between RECIST and pathology, with pathology showing better prognostic reflection in cases of inconsistency [ ]. The tumor regression grading (TRG) system proposed by Rubbia-Brandt et al. [ ], based on the proportions of intratumoral tumor cells, fibrotic components, and necrotic tissue, is commonly used for assessing the efficacy of neoadjuvant therapy in CRLM. The BEV-ONCO trial has also prospectively confirmed the pathological response of CRLM was a significant biomarker for tumor recurrence after hepatectomy [ ]. However, from a clinical point of view, pathological response is not a surrogate tool for imaging, since it can only be conducted post-surgery, offering no guidance for clinical treatment decisions preoperatively.
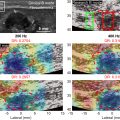
CEUS allows for excellent visualization of tumor perfusion and has been proven effective in diagnosing colorectal liver metastases compared to CT [ ]. A novel computer-aided color parameter imaging (CPI) technique for CEUS has demonstrated to effectively depict the distribution of tumor vasculature. This method involves color-coding the arrival times of microbubbles, allowing for a more detailed analysis of real-time illustration of continuous hemodynamic changes, including flow direction, distribution and arrival time [ ]. The principle of MFI (microflow imaging) is to accumulate signals of microbubble with the maximum intensity holding technique, and each frame includes the information between arrival times to this moment. The accumulation effect enables more nuanced visualization of tumor microvasculature compared to conventional imaging modalities [ , ]. In the era of personalized medicine, a better knowledge of the relationship between radiologic and pathologic response could be of major importance as it could help decide the regime and duration of postoperative chemotherapy. Currently, most studies have utilized quantitative values from CT, MRI or CEUS [ ], or features extracted through radiomics [ ] to predict patients’ response to neoadjuvant therapy. However, these studies often require pre- and post-treatment imaging data, and the reference standards are mostly RECIST 1.1.
To date, no research has focused on assessing the response of CRLM to neoadjuvant therapy using post-neoadjuvant CEUS characteristics. This study analyzed CEUS images with novel techniques like CPI and MFI following neoadjuvant therapy, exploring the correlation between various US/CEUS features and hepatectomy pathology, and established a Nomogram for evaluating the efficacy of neoadjuvant therapy for CRLM.
Methods
Patients
This retrospective study was approved by the local institutional review board, and written informed consent was waived. Between February 2022 to December 2022, 105 patients with liver metastases who underwent CEUS in our center were included in this study.
The inclusion criteria for this study were as follows: (i) age 18 years or older, (ii) successful (R0) resection of the primary tumor or ready to resect primary tumor, (iii) histologically confirmed CRLM, (iv) tumor regression grade classified according to the scheme of Rubbia-Brandt et al. [ ], (v) at least 4 cycles neoadjuvant therapy, (vi) liver metastases were visible on US and CEUS, (vii) no more than 10 liver metastases, (viii) US and CEUS were performed after neoadjuvant therapy (within two weeks prior to hepatectomy), and (ix) The lesions seen in the CEUS video are minimally affected by respiratory motion, which enables effective imaging using CPI and MFI techniques. The exclusion criteria were (i) extrahepatic metastasis before hepatectomy, (ii) presence of portal vein or hepatic vein tumor infiltration/cancer thrombus, (iii) coagulation disorders, failure of important organs such as heart, lung, liver, and kidney, (iv) maximum diameter of CRLM greater than 10 cm.
The basic characteristics of patients in this study were collected, including age, sex, carcinoembryonic antigen (CEA) level, carbohydrate antigen199(CA199) level, disease free interval, primary tumor site, primary N staging, number of metastases, tumor size, chemotherapy regimen, target therapy, KRAS gene, NRAS gene, BRAF gene. In this study, synchronous CRLM was defined as CRLM diagnosed within 12 months after the diagnosis of the primary colorectal cancer. The maximum lesion was used as target lesion for each patient.
The neoadjuvant therapy was performed according to the basic status of patients. The neoadjuvant therapy regimens mainly include oxaliplatin-based chemotherapy and irinotecan-based chemotherapy, such as XELOX, FOLFOX and FOLFIRI, and target therapy, such as cetuximab and bevacizumab. The patient selection flow chart and timeline were shown in Figure 1 and 2 .


Conventional ultrasound examination
A Logiq E9 ultrasound machine (GE Healthcare, Milwaukee, WI) was used with a C1-5 convex probe to obtain conventional images (B-mode sonography and CEUS). Conventional B-mode sonography was performed to identify the target lesion. The ultrasound contrast agent used was SonoVue (Bracco, Milan, Italy). Lyophilized SonoVue powder was dissolved in 5 mL of saline. A 2-mL dose of contrast agent was injected as a bolus into the antecubital vein via a 20-G cannula within 2–3 s, followed by a 5-mL saline flush. The mechanical index (MI) was set at 0.09–0.13. After injection of contrast agent, the liver was scanned using contrast enhanced harmonic gray-scale sonography, with a timer initiated simultaneously. Dynamic intra-lesional blood perfusion was observed continuously from the arterial phase to the late phase of perfusion. Consecutive video clips were recorded and stored for further analysis.
CPI and MFI analysis
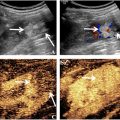
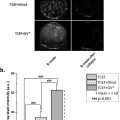
The stored CEUS clips were tailored from the time of contrast agent injection to the peak time of enhancement of liver lesions before CPI and MFI analysis. One radiologist (W.H) used the CPI software onboard the Logiq E9 XD Clear US system (GE Healthcare, Chicago, IL) to color-code clipped CEUS videos. Based on the CPI software utility manual and our prior researches [ , ], we developed a color model to represent the vascular hemodynamics of focal liver lesions. The CPI color model, based on an enhanced chronological sequence, consists of four colors: (i) red: the time from the arrival of the contrast agent at the hepatic artery to its arrival at the portal vein, representing the enhancement during the arterial phase. (ii) blue: representing the interval from the contrast agent’s arrival at the portal vein until the tumor is fully filled, corresponding to the portal venous phase enhancement. (iii) pink: occurring 2 s after the blue phase, and is used to delineate the tumor’s margins. (iv) purple: indicating when the contrast agent reaches the liver parenchyma. MFI was also performed and analyzed offline on the local disk. The clip was played frame by frame. The maximum intensity-holding sequence was started using the following settings: accumulation at 1.6; dynamic range at 36 dB. The accumulation time for each MFI sequence was 10 to 15 seconds, depending on the perfusion of the target tissue. This modification could maintain the maximum brightness on each pixel and be demonstrated as a consistent vision.
Evaluation of ultrasound features of CRLM
The ultrasound images and CEUS videos (including B-mode sonography) were reviewed by 2 experienced radiologists (W.Y., W.W.), each with at least 15 y of experience in the evaluation of liver CEUS images. Both readers were blinded to the pathological report of the liver metastases, with determination of US, CEUS, CPI, and MFI features reached by consensus.
By comparing with the surrounding parenchyma, we divided the echo of metastases into hyperecho (echo higher than the liver), hypoecho (echo lower than the liver), and isoecho (echo equal to the liver). The halo on B-mode ultrasound images refers to the low echo ring around the lesion.
Enhancement is defined as superior enhancement compared with the surrounding liver parenchyma at the arterial phase. Isoenhancement is defined as equal to the surrounding parenchyma at the arterial phase. Hypoenhancement is defined as inferior enhancement to the surrounding liver parenchyma. CEUS enhancement patterns were divided into four patterns: (i) complete enhancement: homogeneous enhancement of the entire lesion, (ii) inhomogeneous enhancement: enhancement within the lesion appears in a nodule pattern, or necrosis within the lesion, (iii) rim enhancement: enhancement distributed in a rim pattern along the edge of the lesion and (iv) no enhancement.
Wash-out is defined as a reduction in enhancement in comparison to liver parenchyma beginning in or after the arterial phase and resulting in hypo-enhancement [ ]. Early wash-out occurs within 60 s after contrast agent injection. Late wash-out occurs 60 s later contrast agent injection [ ].
CPI perfusion patterns were divided into four patterns: (i) centripetal perfusion: enhancement visualized from periphery to center, (ii) eccentric perfusion: enhancement started from center to the periphery, (iii) mosaic perfusion: enhancement within the lesion appears in a punctate or nodule pattern and (iv) no perfusion. CPI feeding artery refers to big vessels entering or surrounding the tumor.
Based on the literature published by Mao et al. [ ], we categorized the microvascular architectural pattern of liver metastases into three patterns according to the microvessel density architectures of the entire lesion: (i) sparse (≤20%), (ii) moderate (21–79%), (c) dense (≥80%).
Pathological analysis
All surgically resected colorectal liver metastases were macroscopically identified, recorded (number, location and size) and fixed in formalin. Tumor regression was scored for each metastasis according to the scheme of Rubbia-Brandt et al. [ ] for the assessment of pathologically response after neoadjuvant therapy in colorectal liver metastases. Lesions classification TRG 1–3 were categorized as response, lesions classification TRG 4–5 were categorized as nonresponse.
Statistical analysis
Means with standard deviation and frequency with percentage were used for describing continuous and categorical variables, respectively. For continuous variables that are normally distributed, we used the independent t-test to compare the response with the nonresponse group. For those that are not normally distributed, we used the Mann-Whitney U test. For categorical variables, we employed the Chi-square test to assess differences between the two groups. Univariate and multivariate analysis of relationships between US/CEUS characteristics and TRG grade was performed using a logistic regression analysis model and odds ratios (ORs) were calculated. A Nomogram was established based on the results of the multivariable analysis. The predictive accuracy of the Nomogram was measured with the concordance index (C-index) and assessed by calibration. P<0.05 was considered statistically significant. Statistical analysis was performed on a per-lesion basis. Statistical analysis was performed using R version 4.3.1 ( http://www.r-project.org ).
Results
Colorectal liver metastases characteristics
From February 2022 to December 2022, 105 patients (66 males and 39 females; mean age: 58.8 y, range 32-78 years) with CRLM met the inclusion criteria and entered the study. A total of 105 colorectal liver metastases were analyzed. Among them, 46 (46/105, 43.8%) lesions were classified as response. The average diameter of metastases was 3.4 ± 1.9 cm. 26 patients had solitary liver metastases (26/105, 24.8%), and 79 patients had multiple liver metastases (79/105, 75.2%). RAS/RAF mutational status was available for 87 patients, and of these 37 had KRAS mutation, three had NRAS mutation and 1 patient had BRAF mutation. The basic characteristics were presented in Table 1 .
| Variable | Response (n = 46) | Nonresponse (n = 59) | p |
|---|---|---|---|
| Age, Mean ± SD | 60.46 ± 9.76 | 57.42 ± 10.71 | 0.118 |
| Sex, n (%) | 0.710 | ||
| Female | 18 (39.13) | 21 (35.59) | |
| Male | 28 (60.87) | 38 (64.41) | |
| CEA(ng/mL), Mean ± SD | 25.20 ± 51.71 | 115.12 ± 528.64 | 0.278 |
| CA199(U/mL), Mean ± SD | 285.49 ± 1115.50 | 180.74 ± 741.33 | 0.824 |
| DFI, n (%) | 0.811 | ||
| <12 mo | 39 (84.78) | 49 (83.05) | |
| ≥12 mo | 7 (15.22) | 10 (16.95) | |
| Primary tumor site, n (%) | 0.952 | ||
| Left colon | 38 (82.61) | 49 (83.05) | |
| Right colon | 8 (17.39) | 10 (16.95) | |
| N staging, n (%) | 0.897 | ||
| 0 | 13 (28.26) | 16 (27.12) | |
| 1+ | 33 (71.74) | 43 (72.88) | |
| Tumor number, n (%) | 0.276 | ||
| Multiple | 37 (80.43) | 42 (71.19) | |
| Single | 9 (19.57) | 17 (28.81) | |
| Tumor size, n (%) | 0.383 | ||
| <3 cm | 25 (54.35) | 27 (45.76) | |
| ≥3 cm | 21 (45.65) | 32 (54.24) | |
| Distribution of tumors, n (%) | 0.492 | ||
| Bilobar | 25 (54.35) | 36 (61.02) | |
| Single | 21 (45.65) | 23 (38.98) | |
| Chemotherapy regimen, n (%) | 0.407 | ||
| Oxaliplatin-based | 31 (67.39) | 36 (61.02) | |
| Irinotecan-based | 14 (30.43) | 23 (38.98) | |
| No | 1 (2.17) | 0 (0.00) | |
| Target therapy, n (%) | 0.079 | ||
| No | 6 (13.04) | 16 (27.12) | |
| Yes | 40 (86.96) | 43 (72.88) | |
| KRAS gene, n (%) | |||
| Detection | 39 (84.78) | 48 (81.36) | 0.137 |
| Mutation | 20 | 17 | |
| Wild | 19 | 31 | |
| No detection | 7 (15.22) | 11 (18.64) | |
| NRAS gene, n (%) | |||
| Detection | 39 (84.78) | 48 (81.36) | 1.000 |
| Mutation | 1 | 2 | |
| Wild | 38 | 46 | |
| No detection | 7 (15.22) | 11 (18.64) | |
| BRAF gene, n (%) | |||
| Detection | 39 (84.78) | 48 (81.36) | 0.448 |
| Mutation | 1 | 0 | |
| Wild | 38 | 48 | |
| No detection | 7 (15.22) | 11 (18.64) |
US/CEUS findings of CRLM patients after neoadjuvant therapy
The US/CEUS features characterizing the CRLM nodules in this study are listed in Table 2 .
| Variables | Response (n = 46) | Nonresponse (n = 59) | OR [95%CI] | p |
|---|---|---|---|---|
| Echo | ||||
| Hyperecho | 24 (52.17) | 33 (55.93) | 1.00 [Reference] | |
| Hypoecho | 20 (43.48) | 24 (40.68) | 0.87 [0.39–1.93] | 0.736 |
| Isoecho | 2 (4.35) | 2 (3.39) | 0.73 [0.10–5.53] | 0.758 |
| Boundaries | ||||
| Clear | 14 (30.43) | 29 (49.15) | 1.00 [Reference] | |
| Unclear | 32 (69.57) | 30 (50.85) | 0.45 [0.20–1.02] | 0.055 |
| Halo | ||||
| No | 40 (86.96) | 45 (76.27) | 1.00 [Reference] | |
| Yes | 6 (13.04) | 14 (23.73) | 2.07 [0.73–5.91] | 0.172 |
| Calcification | 0.039 | |||
| No | 31 (67.39) | 50 (84.75) | 1.00 [Reference] | |
| Yes | 15 (32.61) | 9 (15.25) | 0.37 [0.15–0.95] | |
| CEUS enhancement degree | ||||
| Enhancement | 13 (28.27) | 48 (81.36) | 1.00 [Reference] | |
| Iso/Hypo enhancement | 33 (71.73) | 11 (18.64) | 0.09 [0.04–0.23] | <.001 |
| CEUS enhancement pattern | ||||
| Complete enhancement | 2 (4.35) | 33 (55.93) | 1.00 [Reference] | |
| Inhomogeneous | 5 (10.87) | 8 (13.56) | 0.10 [0.02–0.59] | 0.012 |
| Rim enhancement | 25 (54.35) | 16 (27.12) | 0.04 [0.01–0.18] | <.001 |
| No enhancement | 14 (30.43) | 2 (3.39) | 0.01 [0.00–0.07] | <.001 |
| CEUS washout type | ||||
| Early washout | 14 (30.43) | 42 (71.19) | 1.00 [Reference] | |
| Late washout | 32 (69.57) | 17 (28.81) | 0.18 [0.08–0.41] | <.001 |
| CEUS boundaries | ||||
| Clear | 28 (60.87) | 39 (66.10) | 1.00 [Reference] | |
| Unclear | 18 (39.13) | 20 (33.90) | 0.80 [0.36–1.78] | 0.580 |
| CEUS shape | ||||
| Irregular | 21 (45.65) | 16 (27.12) | 1.00 [Reference] | |
| Regular | 25 (54.35) | 43 (72.88) | 2.26 [1.00–5.11] | 0.051 |
| CEUS necrosis | ||||
| No | 9 (19.57) | 32 (54.24) | 1.00 [Reference] | |
| Yes | 37 (80.43) | 27 (45.76) | 0.21 [0.08–0.50] | <.001 |
| CPI pattern | ||||
| Centripetal | 27 (58.70) | 32 (54.24) | 1.00 [Reference] | |
| Eccentric | 7 (15.22) | 18 (30.51) | 2.17 [0.79–5.97] | 0.134 |
| Mosaic | 2 (4.35) | 9 (15.25) | 3.80 [0.75–19.10] | 0.106 |
| No enhancement | 10 (21.74) | 0 (0.00) | 0.00 [0.00–Inf] | 0.989 |
| CPI boundaries | ||||
| Clear | 24 (52.17) | 34 (57.63) | 1.00 [Reference] | |
| Unclear | 22 (47.83) | 25 (42.37) | 0.80 [0.37–1.74] | 0.577 |
| CPI shape | ||||
| Irregular | 19 (41.30) | 17 (28.81) | 1.00 [Reference] | |
| Regular | 27 (58.70) | 42 (71.19) | 1.74 [0.77–3.92] | 0.183 |
| CPI feeding artery | ||||
| No | 34 (73.91) | 26 (44.07) | 1.00 [Reference] | |
| Yes | 12 (26.09) | 33 (55.93) | 3.60 [1.56–8.29] | 0.003 |
| MFI | ||||
| Dense | 4 (8.70) | 26 (44.07) | 1.00 [Reference] | |
| Moderate | 21 (45.65) | 24 (40.68) | 0.18 [0.05–0.59] | 0.005 |
| Sparse | 21 (45.65) | 9 (15.25) | 0.07 [0.02–0.24] | <.001 |
Related posts:
 Strain Patterns With Ultrasound for Assessment of Abdominal Aortic Aneurysm Vessel Wall Biomechanics
 Evaluation of Renal Masses Using Contrast-Enhanced Ultrasound with Sonovue and Sonazoid
 A Bioengineered Cathepsin B-sensitive Gas Vesicle Nanosystem That Responds With Increased Gray-level Intensity of Ultrasound Biomicroscopic Images
 Automated Approach for Enhancing Fetal Head Station Assessment in Labor with Transperineal Ultrasound
 Attenuation Measuring Ultrasound Shearwave Elastography (AMUSE) as Noninvasive Imaging Biomarker for Liver Acute Cellular Rejection
 Amplitude-Modulation Frequency Optimization for Enhancing Harmonic Motion Imaging Performance of Breast Tumors in the Clinic
Stay updated, free articles. Join our Telegram channel

Full access? Get Clinical Tree


