Abstract
A particular challenge in clinical ultrasound imaging is acoustic clutter, which arises from the heterogeneity of the speed of sound and reverberations between layered tissue types. Although clutter is common when imaging through complex tissue such as the abdominal wall, few studies have investigated its effects on quantitative ultrasound (QUS) parameter estimation. The ultrasonic attenuation coefficient (AC) has shown promise as a biomarker for multiple applications. Recently, multiple regularized methods of AC estimation have been developed; however, their performance must be evaluated in clinically relevant scenarios such as in the presence of clutter. In a companion paper to this work, a material that produces clutter similar to that seen in clinical imaging was developed and characterized. Here, we utilize this clutter-generating phantom material to compare the bias and variance of AC estimates resulting from a conventional estimation method known as the spectral difference method (SDM) and a regularized method known as Analytical Global Regularized Backscatter Quantitative Ultrasound (ALGEBRA), which can either be implemented in 1D or 2D. A B-mode, target-based contrast-to-noise ratio was used to quantify the amount of clutter in data collected from a phantom with known AC. Estimation reliability was determined using the normalized root mean square error (NRMSE) and the percent bias. On average, 1D-ALGEBRA had a 22.86% smaller bias and a 32.19% smaller NRMSE than the SDM, while 2D-ALGEBRA had a 17.59% smaller bias and a 25.66% smaller NRMSE than the SDM. An analysis of variance model indicated that ALGEBRA is more robust to the presence of clutter than the SDM. Further statistical tests showed that the reduction in variance resulting from ALGEBRA was the main contributor to the reduction in NRMSE. This work demonstrates the utility of this clutter-generating phantom material in objective testing of QUS parameter estimation, as well as performance improvements obtained in phantoms with regularized methods from QUS parameter estimation in the presence of acoustic clutter.
Introduction
In diagnostic ultrasound imaging, steering and focusing is performed assuming ultrasound waves propagate through tissue with a constant and known velocity, such as 1540 m/s. However, the speed of sound departs from 1540 m/s for some tissue types including fat (∼1470 m/s [ , ]) and muscle (∼1590 m/s [ ]). Because of the complex structure of human tissue, the ultrasound beam experiences sound speed heterogeneity as it propagates. This heterogeneity causes portions of the wavefront to travel faster or slower, introducing beamforming errors from the assumed sound speed. This effect is known as phase aberration and causes distortion of the ultrasound point spread function [ ]. Typically, this distortion occurs as main lobe broadening and increased side lobes, which in turn cause decreased contrast and resolution in the B-mode image, thus reducing the diagnostic quality of the images [ ]. Measurements of aberration have been performed in multiple imaging applications such as abdominal [ , ], breast [ ], chest [ ], and skull [ , ]. In addition to aberration, degradation of ultrasound images can be caused by reverberations due to reflections between tissue type interfaces and multiple scattering. The undesired echoes that originate from both aberration and reverberation are called clutter [ ].
Clutter is commonly seen when imaging through the abdominal wall. As described by Dahl et al. [ ], the abdominal wall is comprised of several layers. On top is a layer of skin, followed by a superficial adipose tissue layer within intertwined connective tissue. Beneath this, a deeper adipose layer is followed by the abdominal muscles. The layers are separated by thick connective tissue bands called fascia. The thicknesses and orientation of each layer can vary from patient to patient. The presence of these layers causes heterogeneity in sound speed as well as reverberations due to the interfaces of differing tissue types. With the growing obesity epidemic [ ], effects from thicker layers of adipose tissue in the abdominal wall, and thus a greater error from the assumed sound speed, may become more prevalent in clinical settings.
Recently, in a companion paper to this work, Flint et al. [K. Flint et al., unpublished data, 2024] described the creation and characterization of a tissue-mimicking material that produces acoustic clutter and can be used in conjunction with any commercially available ultrasound phantoms, specifically those that have an existing or attachable well for coupling fluids. The material was comprised of agar spheres tuned to a desired sound speed using an alcohol solution and then strained and placed in mineral oil. This combination produced clutter from both aberration (due to sound speed differences) and reverberation (due to beam reflections between the surfaces of the beads). The authors found the material to be repeatable, tunable and representative of clinically relevant imaging conditions. The material described by the authors is utilized here to induce clutter in a commercial tissue-mimicking phantom. This work expands upon the companion paper by providing an example of how the clutter-generating, tissue-mimicking material could be used in objective and reproducible evaluations of quantitative ultrasound parameter estimation under clinically relevant imaging scenarios.
One important feature of ultrasonic wave propagation is beam attenuation, which is the reduction in amplitude as the wave travels. Attenuation estimation is necessary for accurate measurements of the backscatter coefficient (BSC), a common parameter in quantitative ultrasound, and parameters derived from the BSCs such as the effective scatterer diameter [ , ] and the acoustic concentration [ , ]. Additionally, the attenuation coefficient (AC) has been shown to correlate with micro-structural tissue changes, and thus has potential use as a quantitative imaging biomarker [ ]. Multiple methods for attenuation estimation have been proposed. Commonly used methods typically employ the reference phantom method [ ], a data-reduction technique that uses a well-characterized tissue-mimicking phantom to account for both electro-mechanical transduction and diffraction effects from the data before calculation of the AC and BSC. This is performed by normalizing the power spectra in the sample by power spectra from the reference phantom at the same depth and lateral position. Two conventional AC estimation methods are the spectral difference method (SDM) [ , ] and the spectral log difference method (SLDM) [ ]. Both the SDM and SLDM estimate the AC by parameterizing the change of the normalized power spectrum with depth. In the case of the SDM, this is performed using multiple overlapping power spectral estimation regions (PSERs) within the region of interest (ROI). The SLDM is a modified version of the SDM that uses two PSER regions (one proximal and one distal) to calculate the AC between them. In a comparison of methods performed by Labyed et al. [ ], the SDM had a lower variance than the SDLM; however, the SDLM is more robust to changes in acoustic concentration (a product of the number of scatterers per unit volume and the mean square difference of acoustic impedance between the scatterers and the background). Both the SDM and SLDM become biased if the frequency dependence of scattering within the ROI is heterogeneous, thus limiting their application in human biological tissue, which commonly has varying tissue types within a ROI [ ]. Nam et al. [ ] proposed a least-squares method to address this issue by estimating frequency-dependent backscatter simultaneously with attenuation. The least-squares method demonstrated improvements over the SDM in both homogeneous tissue-mimicking phantoms and phantoms with inhomogeneous acoustic properties [ ].
Recently, multiple methods have been developed that build upon the least-squares method by enforcing the similarity of neighboring estimates using regularization. Previous methods have estimated the AC values in each PSER location independently, thus neglecting the inherent spatial dependence of the parameters [ ]. The purpose of regularization is to incorporate the hypothesis of piece-wise continuity between neighboring QUS estimates as prior information. Coila et al. [ ] introduced a regularization term to the SDLM based on a total variation scheme. This method improved accuracy and precision in both simulated and tissue-mimicking phantom data. Romero et al. [ ] expanded upon the method by adding terms to simultaneously calculate the BSC using a total variation regularization scheme assuming a power law fit to the BSC. However, for both methods the minimization process used to solve for the parameters of interest involved using an alternating direction method of multipliers that requires specialized software packages and iterative solving, which can add computation time. This was addressed by Chahuara et al. [ ], who used iteratively reweighted least-squares to solve the minimization problem, significantly reducing the time for computation. In a parallel effort, Jafarpisheh et al. [ ] developed an analytic approach to simultaneously estimate the AC and BSC. Based on a system of linear equations, the method, known as Analytical Global Regularized Backscatter Quantitative Ultrasound (ALGEBRA), does not require specialized solvers and is relatively fast (<20 s for a 108 × 86 PSER grid) [ ]. ALGEBRA has two forms: 1D-ALGEBRA implements regularization in the axial direction, while 2D-ALGEBRA implements regularization in both the axial and lateral directions. This method has yielded improvements over the SDM for parametric estimation in tissue-mimicking phantoms by reducing parameter variance while maintaining accuracy [ ]. Regularized methods may reduce variance and increase the accuracy of QUS parameter estimation in vivo ; however, further research is required to validate their use in a variety of clinical scenarios.
Few studies have directly tested the impacts of clutter on attenuation estimation. Gong et al. [ ] suggested that clutter may bias attenuation and proposed a new method for attenuation estimation using harmonic imaging, which reduces the impact of clutter. However, the experiment did not compare the amount of clutter in the image to the attenuation estimate bias in the sample. In this work, the effects of clutter on attenuation estimation are interrogated through bias and variance of the attenuation estimates in known media. Clutter is generated using a phantom material comprised of agar beads in oil with sound speed and attenuation similar to those seen in the abdominal wall [K. Flint et al., unpublished data, 2024]. The contrast-to-noise ratio (CNR) is calculated in the B-mode image of cylindrical targets embedded in a tissue-mimicking phantom in order to quantify the impact of clutter generated by the clutter-generating material compared with the CNR when using a saline solution. Attenuation is estimated in data with and without clutter using the SDM, 1D-ALGEBRA and 2D-ALGEBRA. The bias and variance of the estimated AC is compared between the three AC estimation methods. Our hypothesis is that, being a depth-dependent process, the impact of clutter is reduced by the introduction of axial regularization in the estimation of AC.
Materials and methods
Clutter-generating phantom material
To produce clutter in the ultrasound data, a clutter-generating phantom material (CGPM) was created using the methods described by Flint et al. [K. Flint et al., unpublished data, 2024]. First, agar spheres were soaked in a solution of 1-propanol (10% concentration by volume), Liquid Germall Plus (1.5% concentration by volume) and deionized water for 6 days. Liquid Germall Plus was used as an anti-microbial preservative for the material. The agar spheres were composed of 3% (by weight) agar and 6% (by weight) talc. The agar spheres were manufactured using a shot tower and filtered to retain spheres with an approximate diameter range of 0.6–2.5 mm. By soaking the spheres in the alcohol solution, their speed of sound can be tuned to the desired target, in this case 1540 m/s. The agar spheres were then separated from the alcohol solution using a strainer and placed in mineral oil. A nominal speed of sound value for tissue is 1540 m/s [ , ], which the agar beads were tuned to. And, because the speed of sound of mineral oil is near that of fat (∼1470 m/s) [ ], the combined material provides acoustic properties similar to those seen in the abdominal wall. The difference in sound speed between the spheres and the mineral oil produces clutter in the phantom below the CGPM. Speed of sound and attenuation of the components of the CGPM, as well as the final mixture, were measured using a narrow-band through transmission technique in a water tank [ ]. Because one of our goals was to achieve comparable total attenuation loss to that produced by the body wall without the need for large quantities of the CGPM, the measured attenuation of the material was used to determine the thickness of the CGPM on top of the phantom. This was chosen so the attenuation loss would approximately match that in the body wall, as measured by Hinkleman et al. (4.23 ± 0.94 dB/cm at 3.75 MHz) [ ].
Quantification of acoustic clutter
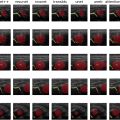
A CNR analysis was performed to quantify the amount of image degradation induced by the CGPM. Ultrasound radio-frequency data were collected from a Sono403 phantom (Sun Nuclear Corporation, Middleton, WI, USA) using three experimental conditions: with the transducer in direct contact with the phantom, with a 1 cm layer of the CGPM in the well of the phantom, and with a 1 cm layer of saline in the well of the phantom. A concentration of 46.7 g/L of salt yields a saline solution with speed of sound of 1540 m/s [ ]. Radio-frequency data were collected using the Axius Direct research interface on an ACUSON S3000 ultrasound system (Siemens Healthineers, Issaquah, WA, USA) equipped with a linear transducer (9L4) and IQ data were collected (through a research agreement) on a Siemens ACUSON Sequoia ultrasound system (Siemens Healthineers) equipped with two curvilinear transducers: 5C1 and DAX (Deep Abdominal Transducer). The transmit focus was set to 4 cm for all acquisitions with the 9L4. For the 5C1 and DAX acquisitions, the focal location is programmed by the manufacturer and thus was the same for all acquisitions. Using each transducer, 10 independent speckle realizations were collected from the region of the phantom with low-scattering cylinders. Figure 1 displays images of the targets. Due to the thickness of either the saline or CGPM being 1 cm, the depth of the anechoic inclusions in the image was 1 cm shallower for the in-contact data set. A 3 × 3 mm ROI was placed inside the 6 mm low-scattering object and in the background of the phantom at the same depth. The CNR was calculated on the envelope signals as (eqn [ ]):
CNR=|μLS−μB|σLS2+σB2
μ L S
and <SPAN role=presentation tabIndex=0 id=MathJax-Element-3-Frame class=MathJax style="POSITION: relative" data-mathml='μB’>??μB
μ B
are the mean envelope values in the low-scatterer and background ROIs, and <SPAN role=presentation tabIndex=0 id=MathJax-Element-4-Frame class=MathJax style="POSITION: relative" data-mathml='σLS’>???σLS
σ L S
and <SPAN role=presentation tabIndex=0 id=MathJax-Element-5-Frame class=MathJax style="POSITION: relative" data-mathml='σB’>??σB
σ B
are the standard deviation of the values in each region.

Attenuation estimation
The returned ultrasound signal power spectrum (S(f; z,x)) can be modeled as eqn (2) :
S(f;z,x)=G(f)×D(f;z,x)×A(f;z,x)×σb(f;z,x)
G ( f )
represents the combined transducer effects from transmitting and receiving the ultrasound signal, <SPAN role=presentation tabIndex=0 id=MathJax-Element-8-Frame class=MathJax style="POSITION: relative" data-mathml='D(f;z,x)’>?(?;?,?)D(f;z,x)
D ( f ; z , x )
represents diffraction effects, <SPAN role=presentation tabIndex=0 id=MathJax-Element-9-Frame class=MathJax style="POSITION: relative" data-mathml='A(f;z,x)’>?(?;?,?)A(f;z,x)
A ( f ; z , x )
is the total attenuation from the intervening tissue between the transducer and the ROI, and <SPAN role=presentation tabIndex=0 id=MathJax-Element-10-Frame class=MathJax style="POSITION: relative" data-mathml='σb(f;z,x)’>??(?;?,?)σb(f;z,x)
σ b ( f ; z , x )
is the BSC [ ]. Utilizing the reference phantom method, spectra calculated from data of the reference phantom are used to normalize the sample spectrum. The normalized spectrum <SPAN role=presentation tabIndex=0 id=MathJax-Element-11-Frame class=MathJax style="POSITION: relative" data-mathml='S(f;z,x)’>?(?;?,?)S(f;z,x)
S ( f ; z , x )
is shown by eqn (3) :
S(f;z,x)=Ss(f;z,x)Sr(f;z,x)=As(f;z,x)×σb,s(f;z,x)Ar(f;z)×σb,r(f)
r
stand for sample and reference, respectively. Values for the reference phantom are determined with a narrow-band through transmission technique for attenuation and with a planar interface technique for BSC [ , ]. The term A is the total attenuation, which can be modeled as eqn (4) :
A(f;z,x)=exp(−4∫0zα(f,z′,x)dz′)
α
is the AC in Np cm –1 [ ]. If the attenuation is assumed to vary linearly with frequency, eqn (4) becomes eqn (5) :
A(f;z,x)=exp(−4α(z,x)fz)
In this work, three methods for determining the AC of the sample were compared: The SDM, 1D-ALGEBRA and 2D-ALGEBRA. The following three sections describe each of these methods.
Spectral difference method
In the SDM, a linear function is fit to the logarithm of the normalized power spectra versus depth at each frequency. The slope of this line is used to calculate the local attenuation, a(f; z,x) . At a lateral position x this is (eqn [ ]):
α(f;z,x)=αr(f)−14∂S(f;z,x)∂z
α r ( f )
is the attenuation in the reference. Assuming attenuation increases linearly with frequency, the reported AC of the sample <SPAN role=presentation tabIndex=0 id=MathJax-Element-19-Frame class=MathJax style="POSITION: relative" data-mathml='(αs)’>(??)(αs)
( α s )
is the slope of <SPAN role=presentation tabIndex=0 id=MathJax-Element-20-Frame class=MathJax style="POSITION: relative" data-mathml='α(f;z,x)’>?(?;?,?)α(f;z,x)
α ( f ; z , x )
versus depth, z . In this work, noise in the estimate was reduced by first averaging <SPAN role=presentation tabIndex=0 id=MathJax-Element-21-Frame class=MathJax style="POSITION: relative" data-mathml='αs(f;z,x)’>??(?;?,?)αs(f;z,x)
α s ( f ; z , x )
across lateral locations before computing the slope. Units of a s are Neper/cm-MHz, which can be converted into the commonly used units of dB/cm-MHz through multiplication by 8.686.
1D-ALGEBRA
A summary of the ALGEBRA algorithm is presented here. For more detail readers are referred to [ ]. By taking the natural logarithm of eqn (3) , the problem can be linearized. The ALGEBRA algorithm uses this linearized equation as the data fidelity term, D, of a regularized minimization problem (eqn [ ]):
argmina,b,n{D+R}
Related posts:
 Quantitative Analysis of Contrast-Enhanced Ultrasound Images of Brain-Dead Donor Livers: Prediction of Early Allograft Dysfunction
 Safety of Shear Wave Elastography as Evidenced From Carotid Artery Strain and Strain Rate Induced by Acoustic Radiation Force Impulse and Arterial Pulsations
 SegFormer3D: Improving the Robustness of Deep Learning Model-Based Image Segmentation in Ultrasound Volumes of the Pediatric Hip
 Ultrasound Shear Wave Elastography and Shear Wave Dispersion: Correlation with Histopathological Changes in Autoimmune Hepatitis Patients
 Diagnosis of Salivary Gland Tumors Using Ultrasound Radiomics
 Low-intensity Pulsed Ultrasound Stimulation of the Intestine Improves Insulin Resistance in Type 2 Diabetes
Stay updated, free articles. Join our Telegram channel

Full access? Get Clinical Tree


