Radiology benefits managers (RBMs) and computerized decision support offer different advantages and disadvantages in the efforts to provide appropriate use of radiology resources. RBMs are effective in their hard-stop ability to reject inappropriate studies, incur a significant cost, and interpose an intermediary between patient and physician. Decision support is a more friendly educational product, but has not been implemented for all clinical indications and its efficacy is still being studied.
- •
Radiology benefits managers (RBMs) and computerized decision support offer different advantages and disadvantages in the efforts to provide appropriate use of radiology resources.
- •
RBMs are effective in their hard-stop ability to reject inappropriate studies, incur a significant cost, and interpose an intermediary between patient and physician.
- •
Decision support is a more friendly educational product, but has not been implemented for all clinical indications and its efficacy remains unproved.
Introduction
The question of what to do about the escalating costs of providing health care to the citizens of the United States has dominated the politics of this country over the past 3 years. Although ObamaCare versus RomneyCare versus MediCare versus MediScare are concepts that have led to divisions between conservative and liberal and libertarian and Tea Party advocates, one of the basic tenets of the debate has been that there is excess in the system. With respect to imaging, as opposed to (or perhaps in addition to) Big PHARMA, the assumption is that overutilization is a major driver in the escalation of health care expenses. This presumption emphasizes that this overutilization relates to the more expensive, higher relative value unit (RVU) procedures rather than more economical modalities. Therefore the combination of a drive from less expensive tests to more expensive tests and the overall increase in imaging tests per patient leads to the double-digit increases in imaging costs annually in the United States. To address these issues, the insertion of an intermediary between the ordering physician and the imaging procedure has led to the 2 solutions addressed in this article: radiology benefits managers (RBMs) and physician order entry decision support (OEDS).
Before addressing the solutions, it is useful to assess the problem in greater detail because the concept of overutilization has many facets that may or may not be addressed by RBMs and OEDS. Radiologists have long held that the increased imaging costs are not borne by traditional diagnostic imaging by radiologists. The rate of escalation of imaging costs has been driven to a large extent by specialty imaging not performed by radiologists but by cardiologists and oncologists and other subspecialists. Although this may reflect the increased incidence of cardiovascular disease and cancer in the population, the aging of the population and longer life spans, or the demand from the public for maximal health care from birth to death, radiologists often publicly opine that the increased usage is rooted in vested self-interest in a fee-for-service world. Radiologists cry “Self-referral!” ( Box 1 ).
- 1.
Fascination with new technologies
- 2.
Duplication of studies from site to site
- 3.
Inappropriate examination ordered/wrong body part imaged
- 4.
Defensive medicine
- 5.
Self-referral financial incentive
- 6.
Patient demand for test
- 7.
Studies ordered by protocol without individual consideration
- 8.
Fraudulent activity
By self-referral, the radiology community suggests that clinicians who order tests performed by those same clinicians are acting irresponsibly and with economic motivations other than the interest of the patient. Whether a cardiologist or orthopedic surgeon has a greater tendency to order a cardiac nuclear scintigram or magnetic resonance (MR) imaging of the knee when that clinician either owns the machine and charges the technical fee or interprets the same study and charges the professional fee has been studied in the literature based largely on Center for Medicare Services (CMS) and other provider sources of data. Most of the literature shows an ever-increasing proportion of imaging studies being conducted and interpreted by nonradiologists across the modalities with the highest RVUs. These articles and others show that, when scanners and imaging studies are owned and interpreted respectively by nonradiologists, the rate of growth in utilization exceeds that of the studies referred to and performed by radiologists. The per-patient utilization rate in CMS terms has increased more among self-referring specialties than in traditional diagnostic radiology. This per-patient rate addresses the issue of increased numbers of older patients living longer and having disease, and raises issues of vested self-interest by self-referrers leading to overutilization.
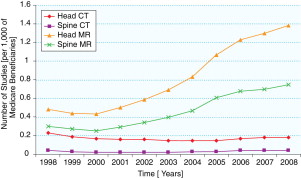
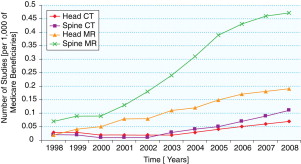
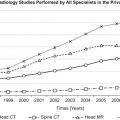
Specific examples of these influences are worth citing. They include: (1) between 1998 and 2002, private office radionuclide myocardial perfusion imaging by radiologists increased by 16%, whereas the increase for cardiologists was 101% ; (2) between 2000 and 2005, private office neuroradiology MR imaging examinations by radiologists increased by 83%, compared with a 254% increase by nonradiologists ; (3) during 2001 to 2006, private office computed tomography (CT) studies by radiologists increased by 85% versus 263% for nonradiologists ; (4) between 2002 and 2007, positron emission tomography (PET) studies by radiologists increased by 259%versus 737% for nonradiologists ; and (5) neurologists and neurosurgeons increased their private office neuroradiology MR studies by more than 200% between 1998 and 2008 ( Figs. 1 and 2 ). These differences document the impact of self-referral.
Another source of overutilization is duplicate studies. In a health care system in which the average period that a patient stays with a given insurance company is just 2.3 years, the likelihood that studies performed by providers supported by 1 insurer can be accessed by clinicians from a different insurance system is low. It requires an effort that the clinicians may find burdensome. It is easier just to order a new study in your own system than to retrieve images and reports from a foreign system. When the transient allegiance to an insurance provider is coupled with an ever-mobile society, there are lost studies in the system leading to duplicate imaging because the clinicians or patients are unaware of what has been previously performed. Until a universally accessible electronic patient record is created (one of the more worthy provisions of ObamaCare), the potential for repetitive imaging is high.
Inappropriate imaging may also stem from physician ignorance. With the expanded role of imaging in making diagnoses and the increased armamentarium of MR imaging, CT, MR angiography, CT angiography, nuclear medicine, and ultrasound techniques, the array of potential studies to order becomes daunting to someone not in academic centers experiencing the advances. As an example, clinical examination, ultrasound, CT, or MR imaging can be used to diagnose an appendiceal abscess. Which should be used? What is the standard of care in 2012? Is the cost of the study a factor? Are all studies readily available in the emergency department (ED)? To keep up with the imaging guidelines in a medical system in which the radiologist is rarely used in this capacity as a consultant is daunting.
In addition, another factor that is often decried as a source for increased use is fear of litigation. This input is frequently cited by physicians who blame defensive medicine as the source of many studies needed to rule out the 0% to 5% chance of an entity for fear of missing a diagnosis that may lead to a malpractice suit. The growth of imaging in the ED usually is most commonly attributed to defensive medicine because any motor vehicle collision, concussion, slip and fall, or pelvic/hip pain may harbor a subtle life-threatening lesion that is unapparent to clinical examination. The pan-scan from lower extremity to the vertex of the skull to exclude disorders in patients who are inebriated, unconscious, unreliable historians, or in accidents that have a higher rate of such injuries has led to marked imaging increases emanating from the ED. The advent of CT scanners within the ED has also led to increased use ( Table 1 ) and the added concern about unnecessary radiation to the populace.
| Relationship to CT Scanner Installation | Number of Patients Seen in ED | Number of Patients Scanned with CT | % of Patients Scanned | Rate of Positive Findings (%) |
|---|---|---|---|---|
| Year before | 48866 | 3884 | 7.9 | 23.3 |
| Year after | 50,611 | 6569 | 13.0 | 15.0 |
| Change | 1745 | 2685 | 69 (increase) a | 35.6 (decrease) a |
Inappropriate selection of examinations was studied by Lehnert and Bree. Reviewing 459 examinations performed, the investigators found that 26% were inappropriate, including examples of studies in which no tests should have been performed, the wrong test was ordered, the wrong body part was ordered, or the study was duplicative. The rate at which a significant finding was found on these inappropriate tests was less than half the rate in those studies in which the indication and study were appropriate.
An America’s Health Insurance Plans (AHIP) white paper suggested several additional factors that account for inappropriate imaging, including (1) deficiencies in the quality of imaging services by those performing the test, (2) lack of information on imaging effectiveness in some clinical situations, and (3) direct-to-consumer advertising and the impact on consumer demand for these services.
It has been estimated that all of the factors discussed earlier suggest that one-third of imaging procedures are inappropriate, costing the country between $3 billion and $10 billion annually.
To address several of these issues, the insertion of a pause in the system (ie, RBMs and OEDS) is a potentially worthy and cost-effective safety net. This article addresses the competitive advantages and disadvantages of each of these suggested solutions to some of the ills of our radiology procedure order and procurement system as well as suggesting future directions that may be more useful in controlling a system that has uncontrolled for too long.
RBMs
RBMs have stated goals of (1) guiding usage, (2) controlling costs, (3) guaranteeing quality, (4) smoothing patient throughput, (5) determining study appropriateness, (6) preventing redundancy, (7) improving efficiency, and (8) improving patient safety by reducing exposure to unnecessary ionizing radiation. RBMs have made significant headway in the commercial insurance market and are contracted by many insurers. They are currently in operation in 50 states and control use for more than 90 million patients. Medicare currently disallows the requirement for RBMs in its fee-for-service programs but not its Medicaid and Medicare Advantage plans.
The top 4 RBMS by number of patients cover about 90 million patients in the United States ( Box 2 ). They include MedSolutions (Franklin, TN), which began in 1992 and focused exclusively on so-called intelligent cost management in 1997 ( www.medsolutions.com ). MedSolutions was recently selected by Cigna to be its exclusive RBM for members covered in the United States. MedSolutions has worked with Cigna for 13 years, but its overall client base stands at about 25 million individuals nationwide, including Medicare Advantage beneficiaries. American Imaging Management (AIM) Inc has headquarters in Deerfield, Illinois, was founded in 1989, and acquired by WellPoint Inc in 2007 ( www.americanimaging.net ). AIM’s growth has been exceptional, from 5 million members in 2004 to 13 million in 2005, to 20 million in 2007, to 30 million in 2008, and, as of 2010, it covered 35 million members. CareCore National claims to be the largest specialty benefits manager and has bases in South Carolina and Colorado ( www.carecorenational.com ). Its services include cardiac imaging (established 2005), cardiac implantable devices, oncologic agents (2007), radiation therapy, pain management, and laboratory services (2008). CareCore National was founded in 1994 and currently manages services of 30 million people. National Imaging Associates (NIA) was founded in 1995, acquired by Magellan Health Services in 2006, and is headquartered in Avon, Connecticut ( www.niahealthcare.com ). As of 2009, NIA covered 18 million Americans.
AIM
Care to Care
CareCore National
HealthHelp
MedCurrent
MedSolutions
NIA
To provide a scope of the nature of these companies, insight can be gained from the employee ranks. A company such as NIA manages approximately 400,000 studies per month. Although this is similar to the total output of a 930-bed hospital like Johns Hopkins Hospital, NIA only focuses on high-RVU studies like CT, MR imaging, cardiac nuclear medicine, and PET, and does not manage inpatient services, which are often paid for on a diagnosis-related group (DRG) system. The DRG system for inpatients yields a flat rate to the hospital based on a specific diagnosis and payment is not wholly based on use. NIA has 6000 employees, including 75 physician reviewers and 5 full-time radiologists. NIA is employed by many insurance companies to manage their imaging services. Insurance clients include Absolute Total Care, Blue Cross Blue Shield of Florida, CareSource, Cigna, Geisinger Health Plan, Highmark, Keystone Mercy Health, Magnolia Health Plan, WellPath, and Harvard Pilgrim Health Care ( www.niahealthcare.com ).
How does the process work? NIA reviews a physician’s request for a study before its performance. Although initially this is through a computer-based system staffed by clinical service representatives (CSRs) for appropriateness, if any red flags between a (1) match of study and indications, or (2) length of symptoms (eg, MR imaging of the lumbar spine ordered within 5 days of onset of back pain with no neurologic symptoms rather than industry standard of waiting 6 weeks), or (3) recent studies are identified, a health professional (usually a nurse) intervenes. From this encounter, the requesting physician may be bumped up to a physician consultant for study approval.
General percentages suggest that 70% of studies are immediately approved based on algorithms inputted by a technical employee in the initial call for most RBMs. Approximately 30% speak to a medical professional (perhaps a technologist or billing specialist or nurse). Of the 30%, about half are resolved at this level. Of the remaining 15% of cases, there is an interaction with a physician with a decision to approve, reject, or cancel the study that is ordered (Michael Pentecost, personal communication, 2010).
The results from HealthHelp, published as part of an article on RBM impact by Levin and colleagues ( http://www.jacr.org/article/S1546-1440(09)00462-1/fulltext-article-footnote-1#article-footnote-1 ), are similar and can be found in Table 2 .
| Requests (n) | Approved (%) | Request Withdrawn (%) | Examination Changed (%) | No Callback (%) | No Consensus (%) | Referred to Next Tier (%) | |
|---|---|---|---|---|---|---|---|
| Tier 1 | 404,612 | 299,961 (74) | 4164 (1) | — | — | — | 100,487 (25) |
| Tier 2 | 100,487 | 82,598 (82) | 4468 (4) | 1736 (2) | 1849 (2) | — | 9836 (10) |
| Tier 3 | 9836 | 6406 (65) | 1261 (13) | 397 (4) | 1620 (16) | 152 (2) | — |
From the data found in Table 1 , there is an overall rate of study withdrawn or changed of 4%; 9833 requests were withdrawn in 2008. Given a Medicare global fee rate of (an inexpensive study) $280 for a noncontrast head CT, this would result in savings of $2,753,240.
NIA also monitors the quality of the imaging centers to which its managed patients are directed. The age of the scanners, whether they are American College of Radiology (ACR) certified, and the owner of the scanner are scrutinized. Self-referral is addressed by identifying those imaging centers that reside within clinical offices or are listed as being owned wholly or in part by the ordering physicians. NIA keeps records as to whether an ordering physicians have a specific financial interest in the imaging center to which they direct their patients.
Although many RBMs follow ACR guidelines for what studies are appropriate for which indications, some, like NIA, use proprietary software (Informa) to derive their own set of guidelines that may supplement the ACR guidelines or may be based on evidence-based literature that may contradict ACR guidelines. These guidelines are reviewed periodically by the Imaging Advisory Committee and the physician leadership of NIA. Public display of these guidelines based on individual insurance programs provides transparency in NIA’s processes. From NIA’s RadMD Web site ( www.radmd.com ), an insurer, an imaging modality, and a specific imaging study can be chosen.
In the case of disputes between referring physicians and the initial call center contact/nurse/physician/radiologist expert chain of command in an RBM, some RBMs use a third-party arbiter such as MCMC (Managing Care. Managing Claims. Quincy, MA). MCMC provides independent evidence-based peer reviews from a panel of paid medical consultants with rapid turnaround times. The likelihood of coming to such an independent arbitration is low in the processes of most RBMs. Personal intervention by radiologist medical directors usually solves any disagreements on imaging test appropriateness.
What are the controversial techniques that RBMs may use that lead some to question their intermediary function? Some physicians aggressively disdain the attitudes of RBMs about self-referral. Cardiologists and orthopedic surgeons in particular think that the patient convenience and guarantee of compliance when studies are performed directly in a physician’s office (1-stop shop) warrant approval of these studies. Many RBMs use a strategy also used by some insurers in that they only approve studies at sites where at least 5 modalities of imaging (eg, MR imaging, CT, ultrasound, mammography, nuclear medicine) are offered. This strategy has an effect of preventing self-referral sites of physicians that only have higher RVUs (CT and MR imaging) but may also exclude some smaller outpatient radiology groups that do not have the means to provide all modalities because of lack of resources for purchasing the machinery or lack of expertise for reading all studies. RBMs may also engage in the privileging of radiology providers to perform and interpret imaging studies. Site inspections to ensure that equipment, software, and safety standards are maintained may also be performed by RBMs.
RBMs may also keep profiles of referring physicians and practice patterns to identify those physicians who are heavier or indiscriminate users of high-RVU procedures. These physician offices may go through algorithms for approval that have more resistance points that physicians who have better records of ordering less frequent and/or more appropriate (by RBM standards) studies. The RBMs realize that the hassle factor of approval of studies may be effective in having physicians defer some studies and/or change practice patterns. Hence the RBMs may place obstacles before physicians who have a track record of abuse. RBMs are also paid incentives for reducing use. In some cases, bonuses may be linked to individual performance with the organization for ratios of denied or approved studies. Preferential treatment to those physicians who are low-use orderers may include higher fees and bonuses paid to those physicians. In some cases, the pressure of performance (being monitored by the RBM) and the overall hassle factor may lead to reductions in ordering imaging studies.
The impact of RBMs on use is couched in some secrecy because of the conflict sometimes perceived between referring physicians and RBMs and patients and RBMs. However, a July 2008 white paper by AHIP of Washington, DC ( http://www.ahip.org/content/default.aspx?docid=24057 ), estimated that the use of RBMs reduced imaging expenditures by 10% to 20%. Based on these data, the Medicare Payment Advisory Commission (MedPAC) has recommended that RBMs be examined for use in the Medicare system.
The AHIP white paper (p.7) states that:
…After implementation of a radiology benefit management program, health insurance plans report use rates have dropped the annual trend significantly, ranging from 20% to greater than 100%…
The reference for this claim is not the peer reviewed literature, but is listed in the white paper as:
Interviews conducted with health insurance plans for US Government Accountability Office.
Later in the same white paper (p. 8), the AHIP states that “radiology benefit management programs are able to achieve 10 to 20 percent reduction in actual expenditures; while mature programs can hold annual costs trends between 5 and 7 percent.”
The AHIP goes on to state that:
Several health insurance plans have reported reductions in the average growth of use from 25% to 1% after a radiology benefit management program was implemented. Others report an 82% decrease in use of inappropriate imaging and reductions of up to $2.00 per member per month over two years.
The reference for this statement is also difficult to critically assess because it is cited as “Interviews with health plans as reported in US Government Accountability Office. Medicare Part B imaging services: rapid spending growth and shift to physician offices indicate need for CMS to consider additional management practices. GAO-08-452. Washington, DC. June 2008.”
Nonetheless, these numbers are offered frequently by insurers for RBM impact.
The Government Accountability Office report also recounts the following scenario with respect to impact of RBMs:
An official at one plan told us about the plan’s experience using RBM-performed prior authorization. To control rapid spending growth, the plan contracted with an RBM in the late 1990s to perform prior authorization for advanced imaging services. After 3 years, when expenditures for these services stopped growing, the plan discontinued using the RBM for prior authorization, assuming that a lasting change had been achieved in physicians’ ordering of the services. However, over the subsequent 3 years, annual growth in imaging services climbed to more than 10 percent, on average. In 2006, the plan reinstated the RBM’s prior authorization program and 6 months after implementation, growth had again declined to single digits.
One point to make about RBMs is the subjective nature of the review process. The neuroradiology team at Thomas Jefferson University hospital works in collaboration with HealthHelp LLC in a utilization management program. Friedman and Smith reported a 2-fold variability between neuroradiology use reviewers in withdrawal rates when consulting with the referring physician about a potentially nonindicated study. The withdrawal rates (which include canceled or changed studies) varied from 12.8% to 23.5% between 5 neuroradiologists. More specifically, canceled studies ranged from 7.6% to 18.0% between the 5. When subspecialty fellows’ rates were surveyed, a 4-fold rate of withdrawal of the ordered study was observed, ranging from 6.8% to 27.2%, and canceled studies varied by a factor of 7. Even though the rules under which decisions were supposed to be made were identical across these utilization management (UM) radiologists, there was wide variation in rejections. This finding points out the subjectivity of the gatekeeper function that could be at play by professional reviewers in RBMs. Friedman and Smith state that “…the personality characteristics of each neuroradiologist (reviewer) are more likely to come into play in this situation: for example, qualities such as persuasiveness, persistence, and tolerance for potential conflict become important…” These traits are exaggerated when fellows, not attendings, are in the sentinel role, as noted earlier. The investigators conclude that “…it is essential that radiologists with the most appropriate skill sets play key roles in the delivery of UM services.” This opinion is subjective.
Whether the promised savings of RBMs exceed the administrative expense of the RBM interaction has not been fully explored to date. There is a cost that the RBMs charge, but those rates are not transparent. The net impact that RBMs have on the total health system was recently explored by Lee and colleagues. The costs of the RBMs are listed in Box 3 .
Related posts:

Stay updated, free articles. Join our Telegram channel

Full access? Get Clinical Tree


