Degenerative Disease
ANNULAR FISSURES
KEY FACTS
Most are found in the lumbar spine of middle-aged and older adults but may occur at any age.
They are seen as small areas of high T2 signal in posterior band of anulus fibrosus.
Annular fissures may enhance after contrast administration (representing in-growth of granulation tissues).
They may be asymptomatic or produce symptoms by virtue of release of inflammatory substances that irritate nerve endings.
It is better to avoid using the term “tear” as it may have legal implications.
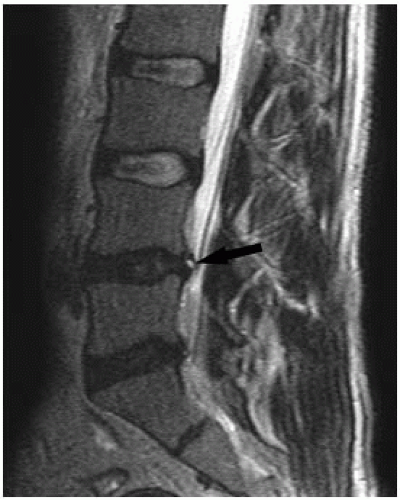 FIGURE 21-1. Sagittal T2 shows a bright posterior annular fissure (arrow) at L4-L5. |
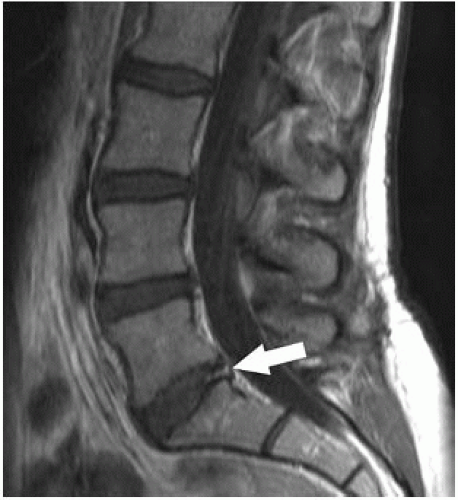 FIGURE 21-2. Sagittal postcontrast T1, in a different patient, shows enhancing annular fissure (arrow) at L5-S1. |
SUGGESTED READING
Stadnik TW, Lee RR, Coen HL, Neirynck EC, Buisseret TS, Osteaux MJ. Annular tears and disk herniation: preyalence and contrast enhancement on MR images in the absence of low back pain or sciatica. Radiology 1998;206:49-55.
HERNIATED DISC, LUMBAR SPINE
KEY FACTS
By 18 years of age, 28% of population has degenerative changes, and after 50 years of age, 85% to 95% have degenerative changes; low T2 signal intensity of discs probably reflects loss of proteoglycans.
Most lumbar herniated discs occur at L4-L5 and L5-S1 and are slightly eccentric in location due to median ligament.
Herniated disc implies a fissure in the anulus fibrosus (small linear area of high T2 signal) with posterior protrusion/extrusion of nucleus pulposus, which may be contained by an intact posterior longitudinal ligament (PLL) (subligamentous) or be accompanied by a tear of that ligament.
Central and slightly eccentric herniated discs affect the roots exiting at the level immediately below.
90% of individuals with disc herniations show clinical improvement after 8 to 10 weeks of symptomatic treatment, 50% show significant reduction in size of herniation by magnetic resonance imaging (MRI), and 8% to 10% will get worse. Improvement may be due to reduction of peridiscal hematoma and inflammatory changes.
Far lateral and extraforaminal disc herniations constitute 1% to 11% of all lumbar disc herniations and tend to occur more often in older (>50 years) male patients.
Most far lateral herniated discs occur at L2-L3 and L3-L4 levels.
Some lateral herniated discs occasionally produce bone erosion.
Recurrent or residual herniated discs may be a cause for the failed back syndrome.
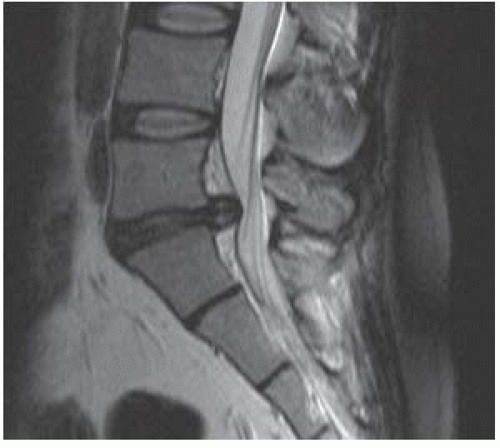 FIGURE 21-3. Midsagittal T2 shows a subligamentous disc hernianation at L5-S1. |
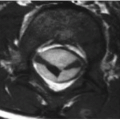
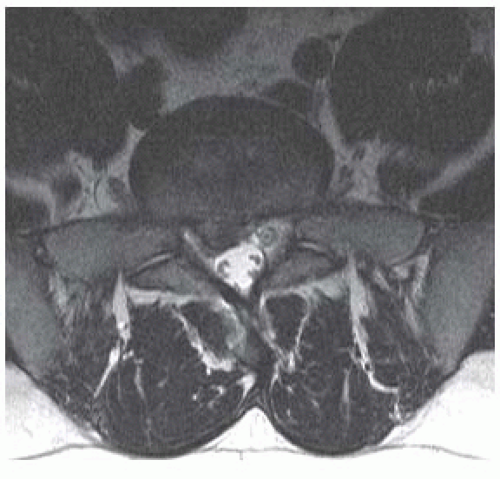 FIGURE 21-4. AxialT2, in the same patient, shows the rightward location of the herniated disc. |
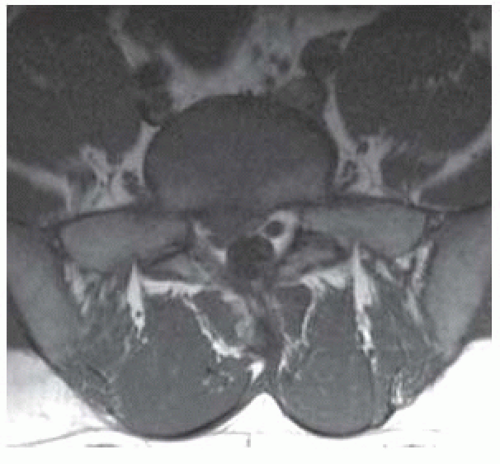 FIGURE 21-5. Corresponding T1 shows the herniated disc compressing the right S1 nerve root. |
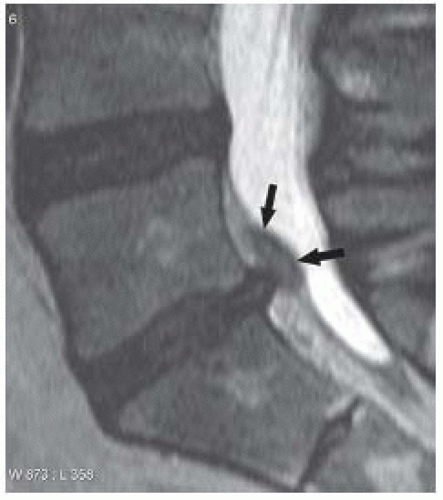 FIGURE 21-6. MidsagittalT2, in a different patient, shows an L5-S1 herniated disc and accompanying presumed epidural hematoma (arrows). |
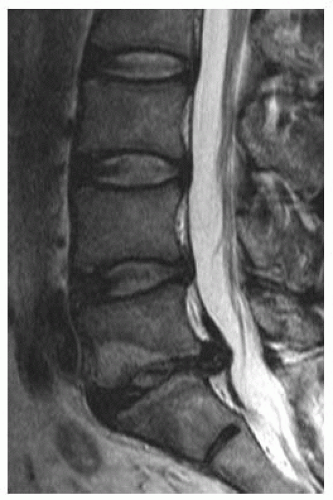 FIGURE 21-7. Midsagittal T2, in a different patient, shows herniated disc at L5-S1. |
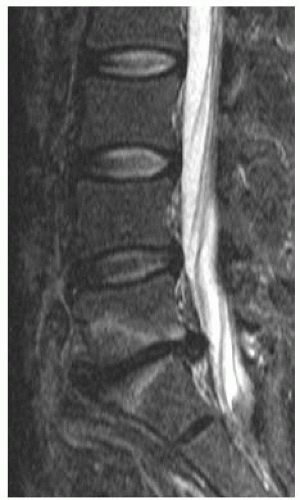 FIGURE 21-8. Corresponding image after 8 weeks of conservative therapy shows some reduction in the volume of the herniated disc. |
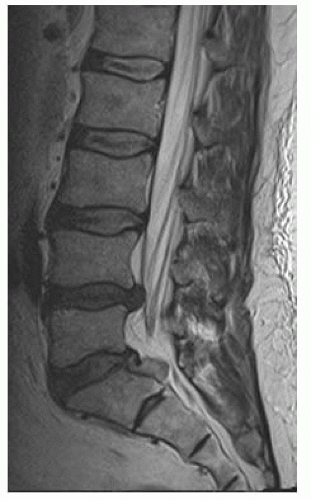 FIGURE 21-9. Midsagittal T2 image, in a different patient, shows a disc herniation at L5-S1. Note torn PLL and that disc fragment is brighter than the parent one, indicating edema and thus acuteness. |
SUGGESTED READING
Costello RF, Beall DP. Nomenclature and standard reporting terminology of intervertebral disk herniation. Magn Reson Imaging Clin N Am 2007;15:167-174.
FREE HERNIATED DISC FRAGMENT, LUMBAR SPINE
KEY FACTS
A free disc fragment implies ruptured anulus fibrosus and PLL with migration of disc fragment.
Free disc fragments may migrate superiorly, inferiorly, bidirectionally, or posteriorly.
They may move into the lateral recess or posterior to the thecal sac and then become “sequestered.” Occasionally, they will erode the dura and become intradural.
Free disc fragments may be surrounded by granulation tissue, which enhances after contrast administration (especially on MRI).
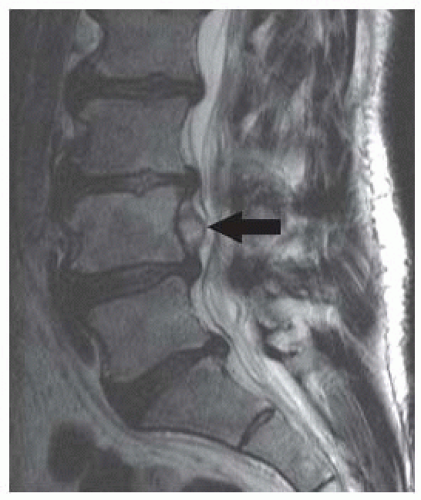 FIGURE 21-10. Midsagittal T2 shows a herniated disc fragment (arrow) that migrated superiorly and is located in the ventral epidural space posterior to L4. |
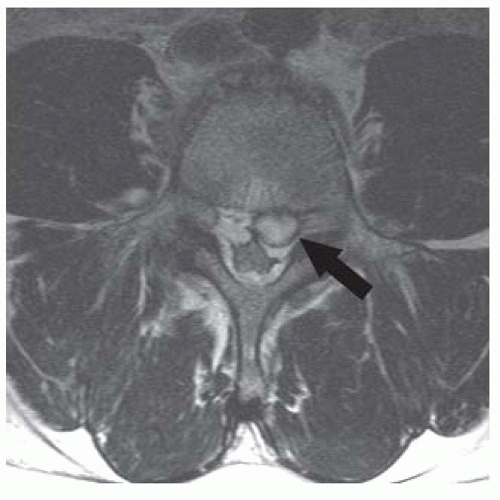 FIGURE 21-11. Axial T1, in the same patient, shows the location of this free disc fragment (arrow). |
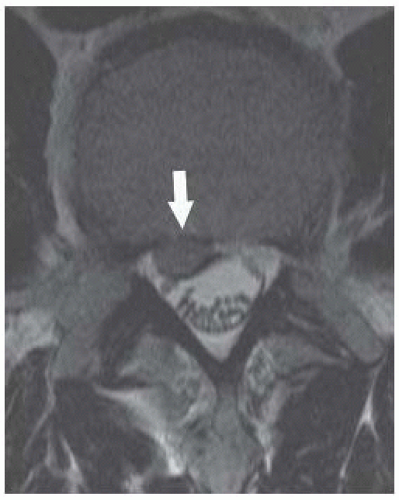 FIGURE 21-12. Axial T2, in a different patient, shows a detached disc fragment (arrow) posterior to L4. |
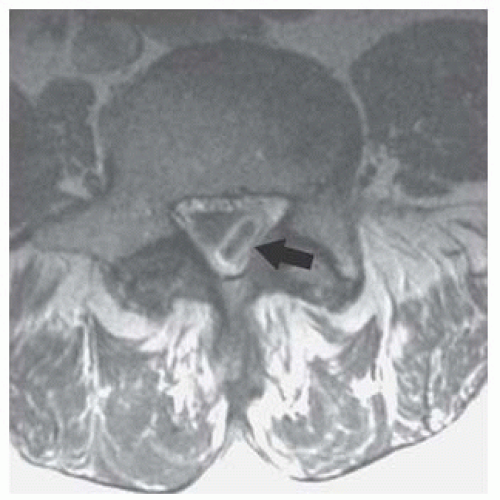 FIGURE 21-13. Axial postcontrast T1, in a different patient, shows an enhancing sequesterd disc fragment (arrow) in the posterolateral region of the canal at the L5 level. |
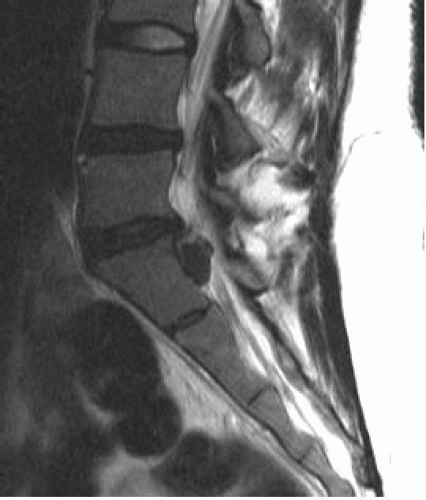 FIGURE 21-14. Midsagittal T2, in a different patient, showing a sequestered disc fragment in the ventral epidural space posterior to S1. |
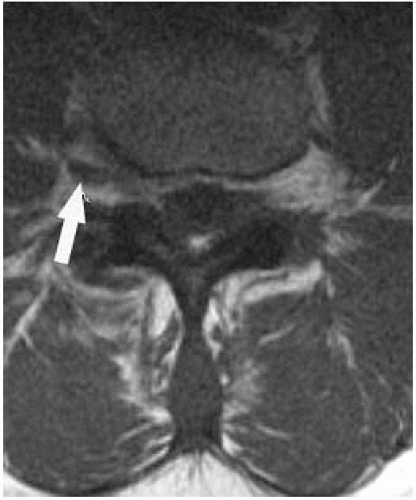 FIGURE 21-15. Axial postcontrast T1, in a different patient, shows a nonenhancing disc fragment (arrow) in the right neural foramen. |
SUGGESTED READING
Brant-Zawadzki MN, Dennis SC, Gade GF, Weinstein MP. Low back pain. Radiology 2000;217:321-330.
SCHMORL NODES
KEY FACTS
Represent herniation of nucleus pulposus into the end-plate.
Most are found in the superior end-plate and are clinically asymptomatic or present with self-limiting back pain.
Most are found between T7-L2.
They may develop after an end-plate fracture.
They occur with equal frequency in the young and the elderly.
Schmorl nodes may show contrast enhancement acutely.
Occasionally, they may be large and “cyst-like.”
Main differential diagnosis: end-plate fracture, discitis, metastasis.
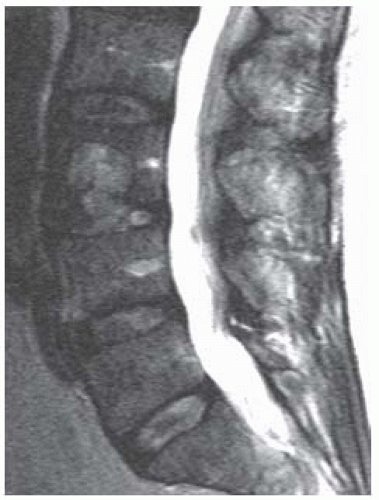 FIGURE 21-16. MidsagittalT2 shows central discontinuity of the inferior end-plate of L3 with high signal in that vertebral body. |
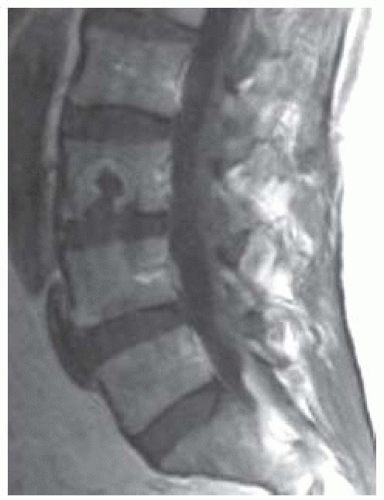 FIGURE 21-17. Corresponding postcontrast T1 shows the Schmorl node with peripheral enhancement. |
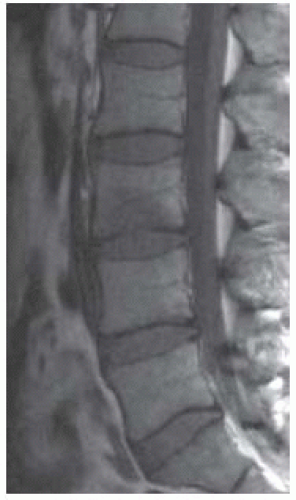 FIGURE 21-18. Midsagittal noncontrast T1 shows nonspecific area of low signal in the inferior aspect of L3 (indistinguishable from tumor) in a patient with acute back pain. |
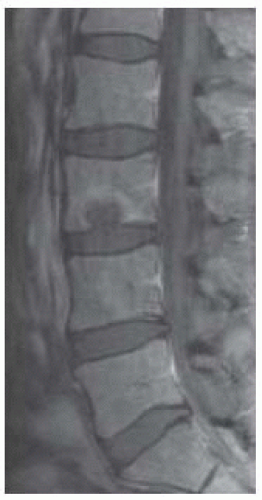 FIGURE 21-19. Corresponding postcontrast T1 shows a typical enhancing Schmorl node. |
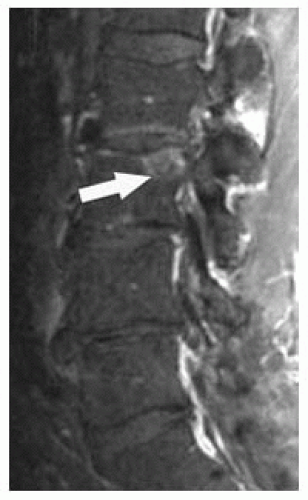 FIGURE 21-20. Midsagittal fat-suppressed post-contrast T1 shows area of enhancement (arrow) in L3 suspicious for the Schmorl node. |
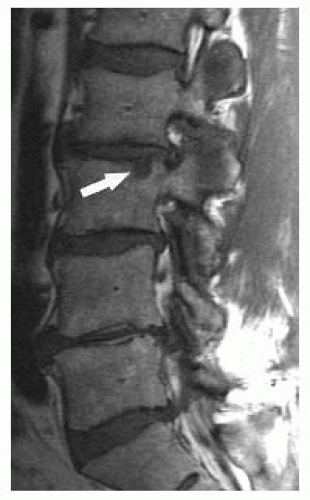 FIGURE 21-21. Corresponding precontrast T1 shows a typical smaller Schmorl node (arrow). |
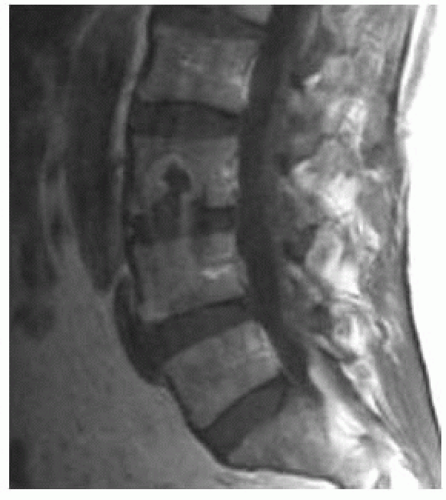 FIGURE 21-22. Midsagittal postcontrast T1, in a different patient, shows a large Schmorl node with peripheral enhancement involving L3. |
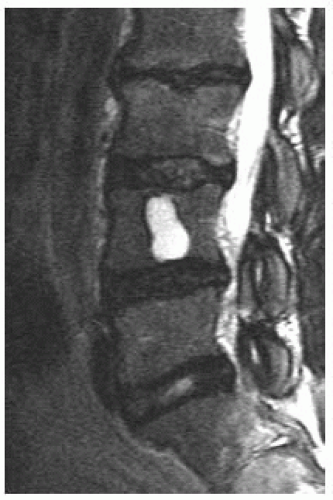 FIGURE 21-23. Midsagittal T2, in a different patient, shows the “cystic” L4 Schmorl node. |
SUGGESTED READING
Pfirrmann CW, Resnick D. Schmorl nodes of the thoracic and lumbar spine: radiographic-pathologic study of prevalence, characterization, and correlation with degenerative changes of 1,650 spinal levels in 100 cadavers. Radiology 2001;219:368-374.
HERNIATED DISC, CERVICAL SPINE
KEY FACTS
Cervical disc herniations may be symptomatic or asymptomatic; most occur during fourth to fifth decades of life; there is no prior history of trauma in most cases, but they may occur secondary to trauma.
By MRI, degenerative changes in the cervical spine are present in 25% of the population <40 years of age and in 60% of the population >60 years of age.
Most frequently involved levels are C5-C6 (30%) and C6-C7 (60%); most are central in location.
Axial T2 images creates white cerebrospinal fluid (CSF) and provides contrast with adjacent bone; T1 images may be done after administration of gadolinium (contrast is then created by enhancing the epidural plexus against black bone and CSF).
Occasionally, cervical herniated discs are bright on T1 images (hydrated calcium?).Related posts:

Stay updated, free articles. Join our Telegram channel

Full access? Get Clinical Tree