Abstract
Objective
Antibody-based therapy has emerged as a powerful tool for targeted treatment of neurological diseases, such as brain cancer and neurodegenerative disorders. However, direct, scalable, and safe confirmation of antibody delivery into the brain remains challenging. Antibodies can be effectively tracked when tagged with molecules that are detectable by medical imaging modalities, such as MRI, PET, or SPECT. In this study, we aimed to confirm gadolinium (Gd)-labeled IgG antibody delivery into the mouse brain using MRI, following exposure to focused ultrasound (FUS) and circulating microbubbles.
Methods
We acquired MR images of the mouse brain to evaluate antibody delivery into the targeted brain region. First, we quantified the MR signal of Gd-labeled IgG antibodies in phantoms using preclinical 9.4 T and clinical 3 T MRI scanners. Then, we determined optimal ultrasound and MR imaging parameters to non-invasively and safely disrupt the blood-brain barrier in a localized and reversible manner and effectively monitor antibody delivery into the murine brain, respectively.
Results
We confirmed that IgG antibodies can be reliably delivered into the murine brain using FUS and microbubble treatment and that we can track their biodistribution within the brain parenchyma using clinically relevant MR image sequences. The maximum detected volume of Gd-IgG antibody delivery (n = 4) was determined to be 0.12 ± 0.02 mm 3 at t = 75.3 ± 17.3 minutes following treatment.
Conclusion
This work paves the way for a scalable and non-ionizing method for performing and evaluating antibody delivery into the brain.
Introduction
Antibody therapies developed for central nervous system (CNS) diseases, such as brain tumors or neurodegenerative diseases, are not able to reach the brain parenchyma in therapeutic concentrations, due to the presence of the blood–brain barrier (BBB) [ ]. This is the major limiting factor for drug delivery into the brain [ , ]. Focused ultrasound (FUS) for targeted drug delivery through reversible BBB opening is a non-invasive, transient, and safe method to treat a targeted brain region of interest [ ]. Low-intensity FUS coupled with circulating microbubbles (MBs) can be used to open the BBB effectively and without associated damage [ , ]. However, confirmation of BBB opening and delivery of pharmacotherapies into the brain using a reliable, safe, and scalable imaging modality remains challenging. Magnetic resonance guided FUS (MRgFUS) provides accurate spatial localization and can be clinically used for precise ablative or non-ablative treatment of solid tumors and neurological disorders [ ]. FUS can be used for treating small tissue volumes and effectively delivering therapeutic molecules, such as antibodies, or mediating drug release from drug carriers, such as liposomes [ ].
MR-labeled components can be incorporated in the design of therapeutic entities and used to confirm their delivery into the targeted tissues. Tracking MR-imageable thermo-sensitive liposomes (iTSLs) in tumors using MR imaging (MRI) assists the application of FUS for precise drug release and therapy. In a recent study by Amrahli et al. [ ], a macrocyclic gadolinium (Gd)-based MRI contrast agent was covalently linked to a lipid, and this was incorporated at 30 mol% into the lipid bilayer of iTSLs that encapsulated doxorubicin (iTSL-DOX). This study showed that iTSL-DOX was able to enhance MR T 1 contrast of tumors (e.g., triple-negative breast cancer) in mice and provided good signal for liposome tracking, which in turn allowed for timely FUS application. Olsman et al. [ ] showed that MRgFUS in combination with MBs resulted in an increased delivery of transferrin receptor (TfR)-targeting liposomes to brain tissue in rats, whereas no increased delivery of the isotype immunoglobulin G (IgG) liposomes was observed. The TfR-targeting and isotype IgG liposomes were loaded with cisplatin and labeled with a fluorophore and the liposomes were functionalized with an antibody against either the rat TfR (OX26) or an isotype IgG. However, fluorescence-based drug delivery confirmation in the brain is not easily scalable to a clinical setting due to the thick human skull.
Localized release of MR-labeled drugs within the tumor resulting in high drug concentration can change drug transport rate constants across vessel walls. As a consequence, dynamic contrast-enhanced MRI (DCE-MRI) coupled with a pharmacokinetic model can be used to detect and quantify changes in such drug vascular transport rate constants. In DCE-MRI, multiple MRI scans are acquired before, during, and after intravenous administration of MRI contrast agents. This scan sequence is then processed using multi-compartmental models, such as the Tofts model [ ], to derive permeability metrics. Aryal et al. [ ] demonstrated that the concentration of DOX that was encapsulated in liposomes was greater than the control tumors by a factor of two in a rat glioma model, though the corresponding enhancements in K trans to the MRI contrast agent Gd-DTPA were variable and did not correlate with DOX delivery (MBs + FUS + Magnevist + liposomal doxorubicin). In this study, liposomes were not MR-labeled, so there was a discrepancy between liposome and Gd-DTPA delivery patterns. Fite et al. [ ] used DCE-MRI to show that the accumulation of gadoteridol was enhanced in tumors treated with temperature-sensitive liposomal doxorubicin and ultrasound hyperthermia in a neu deletion (NDL) breast cancer mouse model. Park et al. [ ] characterized the permeability of the rat brain to Gd-DTPA after BBB disruption induced by FUS and MBs. Rich et al. [ ] showed that MRI-visible, albumin-based nanoclusters were able to diffuse into brain tissue with FUS BBB opening and provided enough MRI contrast to confirm location in the target brain region. Aryal et al. [ ] demonstrated the use of MR- and fluorophore-labeled liposomes for the quantification of their delivery into the brain parenchyma following exposure to FUS, via MRI as well as fluorescence microscopy.
Overall, FUS and MBs can be used together with Gd-based paramagnetic MRI contrast agents in drug carriers for drug delivery [ ]. However, the clinical investigations for the use of MRgFUS for targeted drug delivery, for example, using thermo-responsive liposomes, are limited [ , , ]. There are some preclinical and limited clinical studies on the delivery of antibodies into the brain using FUS [ , ]. There are currently no antibodies conjugated with Gd-based contrast agents in clinical use. There are very few studies reporting antibody-Gd conjugates, due to chemical challenges ( i.e. , with conjugation) and the effect on relaxivity [ ]. As a result, there are no studies using monoclonal antibodies conjugated to Gd for confirmation of their delivery into the brain following treatment FUS and circulating MBs.
In this study, we used commercially available Gd-labeled IgG antibodies (Gd-IgG) and delivered them into the brain of wild-type CD-1 mice. For this purpose, we applied FUS and circulating MBs to non-invasively disrupt the BBB in a localized and reversible manner. MRI was used to confirm antibody delivery into the targeted brain region. For this purpose, we first confirmed the MR signal of Gd-IgG antibodies and conventional MRI contrast agents in phantoms using preclinical 9.4 T and clinical 3 T MRI scanners. Second, we determined the optimal ultrasound and imaging parameters to non-invasively disrupt the BBB and confirm the delivery of IgG antibodies into the murine brain, respectively. Finally, we confirmed that IgG antibodies can be reliably delivered into the mouse brain using optimal FUS parameters, and that we could track their biodistribution within the brain parenchyma using clinically relevant MRI sequences.
Materials and methods
Materials
Microbubbles
BR1 MBs (research grade equivalent to SonoVue MBs; Bracco, Milan, Italy) were activated following manufacturer’s instructions. MBs were administered intravenously (IV) with a bolus injection through a tail vein catheter at a dose of 2.5-5 μL/g (∼ 50–100 μL per mouse).
MRI contrast agent
Vasovist (Bayer Schering Pharma AG, Berlin, Germany) was used as a small molecular weight MRI contrast agent in this study. Vasovist is a gadolinium diethylenetriaminepentaacetic acid (Gd-DTPA) chelate substituted with a diphenylcyclohexylphosphate group, with a molecular weight of 975.88 Da. The contrast agent was at a concentration of 0.25 mmol/mL (or 250 mM) or 29.3 mg/mL in this product. MRI contrast agents were administered intraperitoneally (IP) immediately after FUS exposure at a dose of 5 μL/g (∼ 100 μL per mouse).
Antibodies
Gd-labeled IgG (Gd-IgG) antibodies (macromolecular contrast agent based on DTPA; BioPal Inc, Worcester, MA, USA) were used in this study. This is a reagent that is engineered to be used as an MRI contrast reagent and is classified as a brightening agent acting through the T 1 relaxation process. Gd-IgG were supplied at a concentration of 25 mg/ml. According to the manufacturer, there are approximately 10 to 15 gadolinium atoms per IgG unit. The molecular weight of the Gd-IgG unit is approximately 160 kDa and concentration of Gd was calculated to be 0.261 mg/ml or 1.66 mM. Antibodies were administered intravenously (IV) through a tail vein catheter, concurrently with MBs, at a dose of 4 – 10 μL/g (∼ 80 – 200 μL per mouse).
Phantoms
Antibodies were diluted using saline at Gd concentrations of 0.03, 0.06, 0.125, 0.25, 0.5 and 1 mmol per litre (mM) and placed in six different 5 mm NMR tubes. Another NMR tube included only saline (0 mM) and was used as a control. Antibody concentrations were chosen to cover a large range of two orders of magnitude (0.03–1 mM) and acquire a meaningful calibration curve. Molar concentrations below 0.03 mM did not yield sufficient signal in preliminary experiments, while concentrations higher than 1 mM were not expected to be clinically relevant. The NMR tubes were placed inside a larger plastic tube filled with water. The schematic of the phantom is shown in Figure 1 a. Similarly, phantoms for the MRI contrast agents at the same Gd concentrations were prepared. MR signal of both antibodies and MRI contrast agents in phantoms was acquired using both preclinical 9.4 T and clinical 3 T MRI scanners.

Animals
Female wild-type CD-1 mice were used in this study (age: 8–14 weeks, weight: 25–35 g). An acclimatization period of seven days was allowed prior to the initiation of any procedure. All experimental protocols were approved by the institutional animal facility committee and the UK Home Office regulatory body (project license PP5854694). Mice were kept in a standard 12h:12h light:darkness cycle and were fed ad libitum. Animals were routinely monitored before and after the ultrasound experiments, to assess general behavior and potential treatment-related symptoms.
Ultrasound experiments
Experimental setup
Mice were first anesthetized in an induction chamber with 4% vaporized isoflurane mixed with oxygen, delivered through a digital vaporizer (Somnosuite, Kent Scientific, Torrington, CT, USA). Anesthesia was maintained with 2% vaporized isoflurane through a nose cone during the entire experiment. The induction flow rate was 200 mL/min and the nose cone flow rate for anesthesia maintenance was 100 mL/min. Anesthesia depth was regularly assessed by pedal reflex, through a tow pinch. The mouse head was placed within a stereotaxic frame with 18° ear bars (World Precision Instruments, Hertfordshire, UK) and then the fur was removed from the mouse’s head with an electric trimmer and depilatory cream. The ultrasound test system is illustrated in Figure 1 b. After applying ultrasound gel to the mouse head, a container covered by a transparent parafilm membrane filled with degassed water was placed on the gel, making the sutures of the skull clear for targeting purposes. The ultrasound transducer, mounted with a container filled with distilled water covered by an acoustically transparent parafilm membrane, was lowered into the container.
Targeting
For targeting purposes, a 1 mm thick metal cross was aligned to the lambdoid suture of the murine skull. An imaging single-element transducer (center frequency: 7.5 MHz, focal depth: 45 mm, diameter: 25 mm; V320-SU, Olympus Industrial, Essex, UK) was used in pulse-echo mode, being connected to a pulser-receiver (VK-71000, GAMPT mbH, Merseburg, Germany) and moved by a 3D computer-controlled positioning system (Velmex Inc., Bloomfield, NY, USA). A raster scan was performed across a 15 mm x 15 mm region and using a 1 mm step size in the axial and lateral directions. The transducer was positioned to accurately place the focus in the axial direction ( i.e. , the echo from the metal cross was measured at 60 μs). Then, the transducer was moved 2 mm to the left and 2–4 mm distally, to target the hippocampal region (in the left hemisphere). This brain region was chosen due to its potential as a therapeutic target ( e.g. , in Alzheimer’s disease) and due to the low acoustic attenuation of the parietal bone. The targeted region is shown in Figure 1 c. The opposite right hemisphere was used as an internal control (no ultrasound treatment) in all experiments.
Ultrasound treatment
After targeting, therapeutic ultrasound pulses were emitted from the single-element spherical-segment FUS transducer (center frequency: 0.5 MHz, focal depth: 45 mm, focal width: 1 mm; H-195, Sonic Concepts, Bothell, WA, USA). Therapeutic pulses were generated from a function generator (33500B Series; Agilent Technologies, Santa Clara, CA, USA) and passed through a 50-dB power amplifier (Precision Acoustics Ltd, Dorchester, UK) before reaching the transducer. Pulse length and pulse repetition frequency were 500 cycles (or 1 ms) and 5 Hz, respectively. The number of pulses was 5 for control experiments (no MBs) and 600 for sonicating circulating MBs. These parameters were chosen based on our previous work showing that 5 control pulses are sufficient to estimate the baseline acoustic signal from reflections, and 600 treatment pulses at 5 Hz PRF are sufficient to deliver a range of both small [ ] and large [ , ] molecular weight agents. During the optimization phase, we tested a range of acoustic pressures (0.35–0.75 MPa), as well as microbubble (50–100 μL) and antibody (80–200 μL) injected volumes, in an effort to achieve an acceptable risk-benefit ratio, that is, successful delivery of Gd-IgG antibodies without compromising safety. Apart from the acoustic pressure, which was sequentially decreased to improve the safety profile of the treatment, all other ultrasound parameters were constant. Following the optimization phase, treatment was performed at free-field peak-negative pressure of 0.35 MPa in the main experiments. After the end of ultrasound treatment, mice were removed from the nose cone and placed into a heated recovery chamber, prior to transportation to the MRI scanner. Following the last MRI scan, mice were humanely sacrificed via cervical dislocation under terminal anesthesia.
Passive acoustic detection
During the ultrasound treatment, a passive cavitation detector (PCD; center frequency: 7.5 MHz, focal depth: 45 mm, diameter: 25 mm; V320-SU, Olympus Industrial, Essex, UK) was used to detect MB signal, to verify their presence and behavior in the targeted region. This detector was positioned through the central opening in the therapeutic transducer with the foci aligned and overlapping. These acoustic emissions were filtered by a 3–30 MHz band-pass filter (Mini-Circuits, Brooklyn, NY, USA) and then recorded by a 14-bit oscilloscope sampling at 100 MHz (Gage Razor Express, 2 Channel, 200 MS/s per CH, 14-bit, 125 MHz BW, 4 GS (8 GB) Onboard Memory). Time domain signals were processed with Fast Fourier Transforms (FFT) to evaluate the frequency content of microbubble emissions and characterize cavitation responses. The energy emitted during a single therapeutic pulse with a duration of <SPAN role=presentation tabIndex=0 id=MathJax-Element-1-Frame class=MathJax style="POSITION: relative" data-mathml='T’>?T
T
was estimated using the time-domain signal via <SPAN role=presentation tabIndex=0 id=MathJax-Element-2-Frame class=MathJax style="POSITION: relative" data-mathml='E=∑t=0TV2Δt’>?=∑??=0?2??E=∑t=0TV2Δt
E = ∑ t = 0 T V 2 Δ t
where <SPAN role=presentation tabIndex=0 id=MathJax-Element-3-Frame class=MathJax style="POSITION: relative" data-mathml='V’>?V
V
was the voltage at each time point in volts and <SPAN role=presentation tabIndex=0 id=MathJax-Element-4-Frame class=MathJax style="POSITION: relative" data-mathml='Δt’>??Δt
Δ t
was the sampling period. Here, the electrical energy in the detection system was assumed to be proportional to the acoustic energy radiated by the MBs, and for simplicity the dimensionless resistance value was 1, so the energy units are given in <SPAN role=presentation tabIndex=0 id=MathJax-Element-5-Frame class=MathJax style="POSITION: relative" data-mathml='V2s’>?2?V2s
V 2 s
[ ].
MRI systems
Following the ultrasound treatment, mice were transferred to the MRI suite ( Fig. 1 d), anesthetized with 2% isoflurane, placed in a 3 cm birdcage coil, and scanned with a small-animal 9.4 T MRI system (Bruker BioSpin, Billerica, MA, USA). We acquired MRI scans at different time points (20–320 minutes after treatment). Our aim was to determine the optimal time window with the maximum contrast enhancement after intravenous Gd-IgG administration. We performed MRI measurements using the following sequences: FLASH T1 (TR/TE = 230/3.3 ms, averages = 4, FOV = 20 × 20 mm, matrix size = 256 × 256, slice thickness = 0.5 mm), T1 RARE (TR/TE = 600/18 ms, averages = 4, FOV = 20 × 20 mm, matrix size = 128 × 128, slice thickness = 1 mm) and T2 TURBORARE (TR/TE = 2500/30 ms, averages = 4, FOV = 20 × 20 mm, matrix size = 256 × 256, slice thickness = 0.5 mm). In addition to the 9.4 T MRI system, we used a clinical 3 T whole-body clinical scanner (Achieva, Philips Medical Systems, Best, Netherlands) to measure the MR signal of the antibodies and MRI contrast agents in phantoms ( Fig. 1 d) and evaluate scalability of our measurements into a clinical setting.
Quantification of BBB opening volume
The mean intensity of the Gd-labeled IgG contrast-enhanced region or the apparent BBB opening volume was determined by manually selecting a region of interest (ROI) within the treated hemisphere in the T 1 weighted MRI scans on MATLAB (The Mathworks, Natick, MA, USA). The mean reference intensity and its standard deviation for each mouse were determined using the control region in the right hemisphere. A threshold was automatically selected so that the mean intensity within the opening volume was greater than that of the control region with a confidence level of 99.73% ( i.e. , mean <SPAN role=presentation tabIndex=0 id=MathJax-Element-6-Frame class=MathJax style="POSITION: relative" data-mathml='±’>±±
±
3 S.D.) assuming the intensity of the subtracted image follows a Gaussian distribution [ ]. The Gd-labeled IgG contrast-enhanced volume corresponded to the regions whose intensity was greater than the threshold. The contralateral hemisphere was used as an internal control to avoid bias due to MRI signal inhomogeneity across different animals and to reduce animal numbers. The ROI was manually drawn on MATLAB within the treated and non-treated brain regions, maintaining a constant area of interrogation across hemispheres and animals. The same process was performed across all axial MRI slices to evaluate voxels with enhanced contrast compared to the contralateral side. To estimate the 3D volume of contrast enhancement, we repeated the processing routine for each axial MRI slice, and then added the enhancement areas across all MRI brain slices.
Statistics
Measurements are presented as mean ± standard deviation, unless otherwise stated. A paired t-test was used to compare MRI signal intensity between treated vs. nontreated hemispheres, using the contralateral brain region as an internal control. A power analysis was performed prior to the experiments, to identify the minimum number of subjects required to establish antibody delivery detection in the murine brain. Assuming a confidence level of 95%, a power of 90%, a mean contrast enhancement of 25%, and a standard deviation of 10%, the minimum sample size was 4 animals. The anticipated contrast enhancement was assumed to be lower for antibodies than free Gd enhancement measured in our previous work using similar acoustic parameters, which was up to 35% [ ]. Statistical significance was assumed at p < 0.05.
Results
MR signal of Gd-IgG antibodies
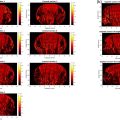
The T 1 and T 2 weighted MRI signals of Gd-IgG antibodies and conventional MRI contrast agents with different Gd concentrations measured using the preclinical 9.4 T scanner are presented in Figure 2 a. The pixel spacing was 0.23 mm and slice thickness was 1 mm for these measurements. The T 1 MR signal increased as the Gd concentration increased from 0 to 1 mM for both samples. As expected, the T 2 MR signal decreased as the Gd concentration increased from 0 to 1 mM for both samples. The T 1 and T 2 relaxivity values for antibodies and MRI contrast agent with different Gd concentrations were determined using T 1 and T 2 mapping. T 1 and T 2 relaxivities ( i.e. , R 1 = 1/T 1 and R 2 = 1/T 2 ) of the samples are presented in Figure 2 b. T 1 relaxivities were 2.24 and 10.46 mM -1 s -1 for antibodies and MRI contrast agents, respectively. Conventional MRI contrast agents had higher T 1 relaxivities than the macromolecular Gd-IgGs. Similarly, the T 2 relaxivities were 10.41 and 18.49 mM -1 s -1 for antibodies and MRI contrast agents, respectively.

Related posts:
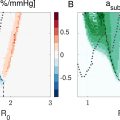 Ambient Pressure Sensitivity of Subharmonic Vibrating Single Microbubbles
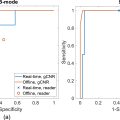 Comparative Assessment of Real-Time and Offline Short-Lag Spatial Coherence Imaging of Ultrasound Breast Masses
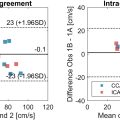 Ultrasound-based Velocity Vector Imaging in the Carotid Bifurcation: Repeatability and an In VivoComparison With 4-D Flow MRI
 Hepatic Portal Venous Perfusion Imaging Using Vessel-Labeling Super-Resolution Ultrasound
 The Potential for Blood–Brain Barrier Disruption During Transcranial Ultrasound Super-Resolution Imaging
 SSAT-Swin: Deep Learning-Based Spinal Ultrasound Feature Segmentation for Scoliosis Using Self-Supervised Swin Transformer
Stay updated, free articles. Join our Telegram channel

Full access? Get Clinical Tree


