Digital Mammography
X-ray mammography continues to be the only imaging technique with the proven capability of detecting clinically occult breast cancer with a resulting decrease in breast cancer deaths. The primary reason to image the breast using x-rays is to detect breast cancers at a smaller size and earlier stage in an effort to interrupt the growth of these tumors prior to successful metastatic spread. X-ray mammography is the only imaging technique that has been shown to decrease mortality in randomized controlled trials that screened asymptomatic women (1,2,3) and, when introduced into the general population, has resulted in a marked decrease in the death rate from breast cancers (4,5,6). For the first time since 1940, the death rate from breast cancer began to decrease in 1990, and this can be directly linked to the onset of widespread mammographic screening in the United States (7). Although film/screen technology has matured to the point where only small improvements are likely, efforts to improve the detection of breast cancer using x-ray imaging continue. The development of digital mammography has opened up new opportunities for investigation that hold the promise of increased cancer detection with a decrease in false-positive tests.
What is A Digital Image?
Simply stated, a digital image is one that can be represented by a series of digits (numbers). The first digital mammograms were actually digitized mammograms. The standard film/screen image was converted into a digital image. Film/screen mammography is an example of an analog detection system. The x-ray photons that pass through the breast are converted to light by a fluorescing screen. This light triggers a reaction in the emulsion of the film that is developed by a chemical process, producing a grayscale image of the photon distribution. Although limited by the grain size of the film emulsion, the components of a film image are fairly continuous. If a sensitometer is moved in a line across a film image, the amount of light coming through the image along this path registers as a continuous line that increases as more light comes through and decreases over spots where less light comes through. The transition from white through gray to black appears to be fairly uninterrupted (Fig. 27-1A–C). The analog line is continuous and goes up and down in a fairly smooth motion. Instead of recording that signal as a continuous line, it could be measured at specific intervals along its course. At each interval the height of the line could be recorded as numbers. Since the line is now being represented as a series of numbers, the representation is digital. Converting the analog signal to digits is called analog-to-digital conversion. If the points that are measured in the conversion are far apart, then the numbers that are recorded would only approximate the actual continuous line. Some highs and lows might be missed and subtle nuances contained in the continuous line (Fig. 27-2). To achieve a better approximation of the continuous line, the measurements could be made closer together, and the numbers recorded would provide a better approximation. Of course, the only way to perfectly copy the continuous analog signal would be to have the measured points be infinitely close together. As a result, digitizing an analog signal is always going to be less continuous (smooth) than the original signal. Digitization of film (converting an analog signal to a digital signal) was the first form of digital imaging. Collecting the information directly in digital form is the way digital imaging is performed today. The closer the sampling, the finer the representation of the line (and total image). The coarser the sampling, the lower the quality of the image.
Much of x-ray imaging has become digital. Because of the high spatial resolution requirements of a breast imaging detector and the cost of building such detectors, as well as the politics surrounding mammographic screening, the development of digital detectors for mammography has been slower than for other parts of the body. Opponents of mammography screening have raised the specter of a medical-industrial complex that is suspected of making billions of dollars from mammography screening, when the fact is that most companies do not make a large profit from mammography devices. Computed tomography (CT) and magnetic resonance imaging (MRI) systems are much more profitable. As a consequence, the development of digital mammography has been slow.
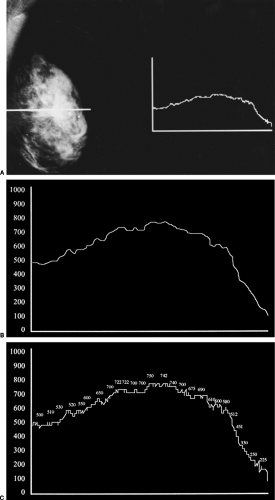 Figure 27-1 Digitization converts an analog signal into a digital signal. If the density of the film (assume completely black is zero and pure white is the highest signal) is measured across a line of the image (A), it appears as a continuous line (B), depending on the whiteness or blackness of the image at each point along the line. The height of the line can be represented by numbers at any specified points (C) (digital conversion), and this produces a digital measure. Every point on the image can be converted to a number. The size of the point determines the fineness or coarseness of the digital representation. |
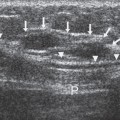
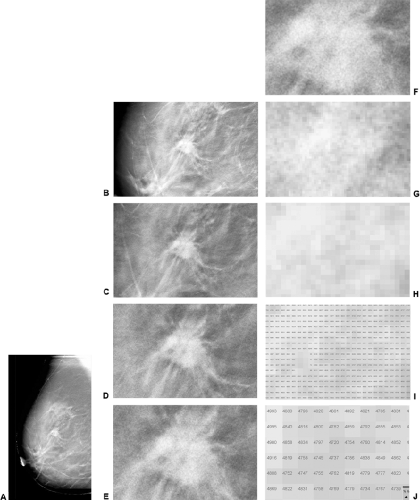 Figure 27-2 Each pixel in a digital image is representative of the amount (number) of radiation striking the image. Digital images are called digital because pixels can be identified by their row number, column number, and a number that represents the x-ray energy that has been deposited in the pixel. This can be seen by progressively enlarging this image from a digital tomosynthesis study (A). As the image is enlarged, the individual pixels become visible and eventually each individual pixel is clearly seen, and the number can be seen corresponding to grayscale assignment, representing the x-ray energy deposited at the pixel in the detector. |
Disadvantages of Film
There are several important disadvantages of film/screen combinations. As a consequence of the fact that the film is both the detector and the display medium, the actual exposure requirements are dictated by the need to produce an image on the film that is viewable. Film does not respond linearly to incident photons. It is not very sensitive to the early photons striking it so that areas of high x-ray absorption in the breast (low transmission of photons to the film) all appear similarly white on the image (the toe of the Hunter and Driffield curve) (Fig. 27-3), and it is only over a fairly narrow range of exposure that small changes in photon attenuation result in differences in film blackening (contrast). Since the normal structures of the breast and cancers of the breast have similar x-ray attenuation, this limitation can make it difficult to visualize and separate normal from abnormal structures. Contrast is extremely important. Although film has high spatial resolution, if there is insufficient contrast between two small structures, then they will not be visible as separate structures (contrast resolution).
Another limitation of film is that, once the image is developed, it is immutable. The information is displayed in only a single presentation, and, if the exposure has not been optimal, the image will be suboptimal. The film is the only record of the image, and, if it is lost or damaged, the loss is irretrievable. Storage of x-ray films requires large amounts of space, and studies are not infrequently lost. If a consultation with another physician or expert is desired, the images must be physically moved to the consultant.
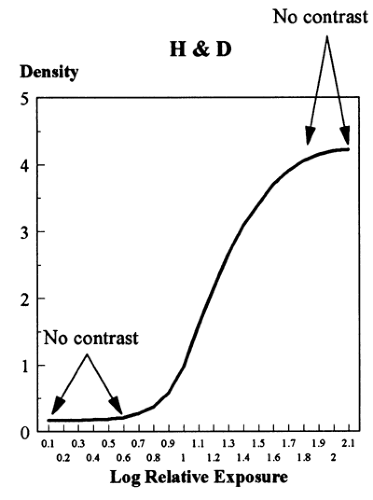 Figure 27-3 If there is no contrast between two structures, they cannot be distinguished. At both ends of the Hunter and Driffield curve, where it flattens out (the very white areas of the film and the very dark areas), there is no contrast between structures of both high and low attenuation. |
The History of The Development of Digital Mammography
Efforts to develop digital detectors for mammography began in the 1980s. Some explored the use of storage phosphor devices (8). American Science and Engineering built the first high-resolution (9 line pairs per millimeter [lppm]) system that used a slot-scanning technique (Fig. 27-4). Unfortunately, the computer requirements at the time were far too expensive, and they were unable to commercialize the device.
Small field of view digital detectors began to be available in the early 1990s. Most of these were based on charge-coupled devices (CCDs) and were incorporated into stereotactic biopsy devices. In the early to middle 1990s, General Electric (GE) developed an amorphous-silicon/cesium iodide system that had sufficient resolution and could be built large enough to image an entire small- to medium-sized breast. At the same time, LORAD began to build a full-field system by tiling multiple small-field CCD cameras together to make a system that could image an entire breast. The Fisher Company, using technology developed by Martin Yaffe, Ph.D., from Toronto, began to build a slot-scanning system, and Fuji tried to adapt their storage phosphor technology for breast imaging.
I believe that the development of these technologies was
slowed by an unfortunate decision at the Food and Drug Administration (FDA). A health planner who had formerly been with the National Cancer Institute began to work at the FDA. A major opponent of screening for women aged 40 to 49, he convinced the leadership at the FDA that digital mammography was so revolutionary that radiologists were going to see things they had never seen before, and, as a consequence, the number of unnecessary biopsies would increase. Ignoring the arguments of breast imaging experts, who pointed out that digital detectors were little more than changes in a film/screen system (which only required 510K FDA approval), the FDA decided to place digital mammography under the premarket approval (PMA) process. This is a far more onerous and expensive process for a company and is usually reserved for completely new devices, whereas the 510K process only requires the manufacturers to show that their system is “substantially equivalent” to a device that already has FDA approval. Digital mammography was the only conversion from film/screen imaging to digital imaging for a body part that was forced to gain approval under the PMA process. It took simple image comparisons for digital chest x-rays to be approved for chest imaging under the 510K process, and the same was true for bone and abdominal imaging. Although FDA is trying to improve the PMA process, when a device is approved under a PMA, any modification to the system requires additional, extensive submissions and review. This has greatly impeded the development of digital mammographic systems.
slowed by an unfortunate decision at the Food and Drug Administration (FDA). A health planner who had formerly been with the National Cancer Institute began to work at the FDA. A major opponent of screening for women aged 40 to 49, he convinced the leadership at the FDA that digital mammography was so revolutionary that radiologists were going to see things they had never seen before, and, as a consequence, the number of unnecessary biopsies would increase. Ignoring the arguments of breast imaging experts, who pointed out that digital detectors were little more than changes in a film/screen system (which only required 510K FDA approval), the FDA decided to place digital mammography under the premarket approval (PMA) process. This is a far more onerous and expensive process for a company and is usually reserved for completely new devices, whereas the 510K process only requires the manufacturers to show that their system is “substantially equivalent” to a device that already has FDA approval. Digital mammography was the only conversion from film/screen imaging to digital imaging for a body part that was forced to gain approval under the PMA process. It took simple image comparisons for digital chest x-rays to be approved for chest imaging under the 510K process, and the same was true for bone and abdominal imaging. Although FDA is trying to improve the PMA process, when a device is approved under a PMA, any modification to the system requires additional, extensive submissions and review. This has greatly impeded the development of digital mammographic systems.
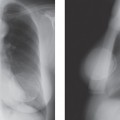
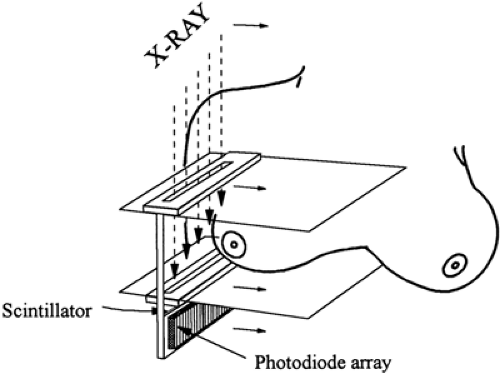 Figure 27-4 The American Science and Engineering line-scanning digital mammography system used pre- and post-breast slits to virtually eliminate scatter. The x-rays entered the scintillator along its edge, and the light emitted was converted to electricity by the photodiode array aligned along the scintillator. This provided high x-ray photon detection efficiency with a short light path to reduce spread in the scintillator. |
The initial approval process for digital mammography was further complicated by a requirement that was to be imposed by the FDA. Since only 2 to 4 cancers would be expected for every 1,000 women screened in a screening study, the FDA recognized that it could not require a direct comparison of digital mammograms to film/screen in a screening program, so it allowed the manufacturers to perform reader studies that involved the “enrichment” of a group of screening mammograms with images of breasts with cancers. If the areas under the receiver operating characteristic (ROC) curve for the analysis of the digital set of images were within acceptable range of the ROC for film/screen, then the FDA would give provisional approval of the device. However, the FDA was initially going to require that the companies perform postapproval studies to show that, in a screening situation, digital imaging was equivalent to film/screen images. The manufacturers were stunned, since these very large studies would cost millions of dollars. One of the companies approached Congress, arguing that they could not possibly fund such a postapproval study, and, consequently, Congress earmarked $26 million to pay for the postapproval studies. When I and others testified before an FDA panel that was to determine whether the GE PMA (the first to be approved) should be granted, we not only convinced the panel that the data supported approval, but we convinced them to recommend that the companies not have to perform a postapproval screening study. Based on our testimony the panel then convinced the FDA to approve the GE device, and the FDA dropped the requirement for postapproval screening studies. The millions of dollars, however, had already been set aside by Congress to pay for a study that was no longer required by the FDA. Instead of using the funds for a more important study, such as the evaluation of ultrasound or MRI for screening, as I suggested, the congressional mandate required that the money be used to evaluate digital mammography. As a consequence, the American College of Radiology (ACR) Imaging Network stepped in, and the Digital Mammographic Imaging Screening Trial (DMIST) was developed to use the money to do the study that was no longer required by the FDA. DMIST (see below) evaluated approximately 49,528 women who agreed to have both digital as well as film/screen mammograms and the studies were interpreted in a blinded fashion, with the radiologists being permitted to recommend further evaluation on the basis of either study. The inclusion of such a large cohort of women provides the study with a great deal of statistical power, so that small differences between film/screen and digital mammography will be detectable. Unfortunately, there are problems with the DMIST study. Patients who were studied at the Massachusetts General Hospital (MGH) and were enrolled in the DMIST trial had their images reviewed with a suboptimal display workstation. Because the FDA approved the LORAD Selenia system under the PMA process, readers at the MGH were required to review the digital images using the presentation algorithm that was approved by the FDA. Although LORAD would not reveal its proprietary algorithm, the images were displayed with extremely high contrast and appeared to have some edge enhancement as well. This has the effect of making every crossing of a Cooper’s ligament appear to be a possible spiculated lesion and resulted in a much higher recall rate for the digital studies than for the film/screen studies. There were only 14 cancers diagnosed among the 1,357 women included in the MGH portion of the DMIST study, so that statistical analysis is not possible for cancer detection. However, we found four cancers on both the digital images and the film/screen images. Digital found one cancer that was missed on film/screen, and one cancer was detected on film/screen that was missed on digital. Seven cancers were detected on the screening study 1 year later (DMIST would classify these as false negatives, despite the fact that they were detected by screening), and the 14th cancer was detected by an MRI examination. We found no difference in cancer detection rates between digital mammography and film/screen, and this has been our feeling in general.
Most experts in breast imaging realized that the digital detector systems where comparable to film/screen imaging as soon as they were able to view the images. Given that the physics of the systems was well understood, and that the images could be adjusted to look identical to a film/screen
study (Fig. 27-5), it was apparent that the detectors could replace conventional film/screen technology, as well as providing all of the advantages of having a computerized image. Gradually the manufactures have been able to fulfill the requirements of the PMA process. They have been able to gain FDA approval for their systems, and digital mammography systems have become commercially available.
study (Fig. 27-5), it was apparent that the detectors could replace conventional film/screen technology, as well as providing all of the advantages of having a computerized image. Gradually the manufactures have been able to fulfill the requirements of the PMA process. They have been able to gain FDA approval for their systems, and digital mammography systems have become commercially available.
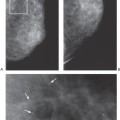
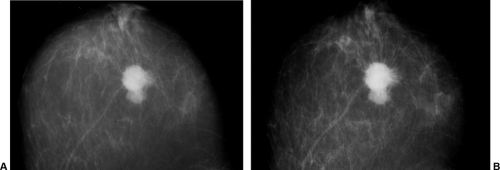 Figure 27-5 Digital mammograms can be made to look exactly like film/screen mammograms. The spiculated mass on this film/screen mammogram (A) can be made to look identical in appearance to the digital mammogram obtained on the same day (B). |
Digital Mammograms Are Comparable to Film/Screen Mammograms
Although there are clear logistical benefits to digital mammography (storage, etc.), the hope that digital mammography would be better for detecting cancer than conventional film/screen mammography, this has not been obvious. Nevertheless, studies have shown that digital mammography and film/screen mammography are certainly comparable. Lewin et al (9,10) performed a blinded comparison between the GE system and conventional film/screen imaging and found that they were essentially equivalent. They examined 6,736 women, repeating the standard two-view film/screen mammograms with digital mammographic examinations. Both studies together resulted in additional evaluation in 1,467 women and resulted in 181 biopsies that yielded 42 cancers. Of the 42 cancers, 9 were detected only on the digital mammograms, while 15 were detected only on the film/screen studies. The remaining 18 were detected by both imaging studies. The difference in cancer detection was not statistically significant. In their study there were fewer callbacks based on the digital mammograms than with the film/screen mammography (799 versus 1,007, p < 0.001). There was no significant difference between the ROC curve area for digital versus film/screen imaging. The differences in yield between the two imaging techniques could be attributed to reader variability as well as the fact that the patients were repositioned between the two studies. Lewin et al concluded that digital mammography was comparable to film/screen mammography.
The Lewin et al results were reaffirmed in a study by Skaane et al (11) using a similar protocol. They imaged 3,683 women with both film/screen and digital techniques and then performed a blinded interpretation of the 2 approaches. They detected 31 cancers. Screen-film mammography detected 28 (0.76%) cancers, while full-field digital mammography found 23 (0.62%). The difference between cancer detection rates was not significant (p = 0.23). In contrast to Lewin et al, the recall rate for digital mammography (168/3,683 = 4.6%) was higher then it was for film/screen mammography (128/3,683 = 3.5%). The positive predictive value based on needle biopsy was 46% for film/screen and 39% for full-field digital mammography. They performed a side-by-side image comparison to evaluate cancer conspicuity. They concluded that 19 cancers were seen equally well using both techniques, while 6 cancers were slightly better demonstrated on the film/screen images, and 6 cancers were slightly better seen using full-field digital mammography. They concluded that there was no statistically significant difference in cancer detection rates between film/screen and full-field digital mammography and that full-field digital mammography with soft-copy reading was comparable to screen-film mammography in population-based screening.
In a larger study, researchers in Norway did show a higher detection rate (nonsignificant) for digital mammography using a different study design (12). In the Oslo II screening trial 43,429 women were invited to attend a screening program. Almost 63% (25,263) of the invited women, aged 45 to 69, participated, and they were randomly assigned to having screening using either film/screen mammography or digital mammography. Standard images were obtained and each study was double read. There were 73 cancers detected among the 17,911 women who had
film/screen mammography (detection rate, 0.41%), and there were 41 cancers in 6,997 women detected by digital mammography (detection rate, 0.59%). The detection rates were not significantly different (p = 0.06).
film/screen mammography (detection rate, 0.41%), and there were 41 cancers in 6,997 women detected by digital mammography (detection rate, 0.59%). The detection rates were not significantly different (p = 0.06).
The Oslo II investigators compared detection rates for women aged 45 to 49 versus 50 to 69. Among the women aged 50 to 69, 56 cancers were detected in 10,304 women by film/screen imaging (detection rate, 0.54%), while 33 cancers were detected among 3,985 women using digital mammography (detection rate, 0.83%). This difference in cancer detection rate approached significance (p = 0.053). In the group of women aged 45 to 49, 17 cancers were detected in 7,607 women using film/screen mammography (detection rate, 0.22%), while 8 cancers were found in 3,012 women using digital mammography (detection rate, 0.27%). Contrary to the results of Lewin et al, the recall rates were significantly higher among the women having digital mammography screening (p < 0.05).
The DMIST Screening Mammography Trial
In September of 2005, the results from the DMIST trial were published in the New England Journal of Medicine (13). Much to everyone’s surprise, although digital mammography and film/screen mammography were judged to be equivalent over the entire population studied, digital appeared to be significantly better for detecting breast cancer in women “under the age of 50,” women with “radiographically dense breasts,” and “premenopausal and perimenopausal women.” For those of us who have converted to all digital mammography this was welcome news, and the digital mammography manufacturers were thrilled. However, there are a number of problems with the analysis that will need to be sorted out.
The authors made the usual mistake of breaking the data into these artificial categories. There are no data to support a dichotomous review based on the age of 50. It is likely that, as with all of the other parameters of screening, the facts surrounding digital imaging, if they truly vary, will likely vary steadily with increasing age and not change abruptly at the age of 50, or any other age. It is unfortunate that the authors, once again reinforced the false suggestion that the age of 50 has some biological consequence when none of the data support this (14).
The DMIST trial included 49,528 women. Due to various missing pieces of information the results for 42,760 women were, ultimately, analyzed. When all of the women were included there was no, statistically significant, difference in cancer detection rates between film/screen and digital mammography. The analysts found that the accuracy (sensitivity and specificity) of digital was higher than film/screen for women under the age of 50 (15% better; 95% Confidence Interval 5%–25%); women with dense or heterogeneously dense (ACR patterns 3&4) breast tissue (11% better; 95% Confidence Interval 4%–18%); and for pre or perimenopausal women (15% better; 95% Confidence Interval 5%–24%).
There were a total of 335 cancers diagnosed in the DMIST trial. Among these, 254 (75.8%) were in the first year and an additional 81 (24%) were diagnosed between days 366 and 455. It is unclear why the authors chose to consider the follow-up period of 455 days and to count any cancer (whether detected by subsequent screening mammography or not) that was not found at the index screen as a false negative. The reader should be aware that this makes the sensitivity of mammography look extremely low, when it is considerably higher than reported in the main section of the paper.
Overall there were 231 invasive breast cancers diagnosed in the DMIST trial. Among these 158 (69%) were detected at the DMIST screen while the remaining 31% were found subsequent to that screen. When the authors (inappropriately) broke out the data for women under the age of 50 they found that 28% of the cancers were found by both F/S and digital while 7% were found by F/S alone and 33% were found by digital alone and 33% were considered false negatives. When they looked at women age 50 and above both techniques found 39% of the invasive cancers while F/S found an additional 17% and digital found an additional 13% while another 31% were called false negative. For women with dense tissue patterns (ACR 3&4) both techniques found 31% of the cancers while F/S added another 10% with digital finding an additional 23%. Both were counted as having missed 36%. Finally, when they looked at women who were pre or perimenopausal 27% of the invasive cancers were found on both digital mammograms and F/S while F/S found an additional 11.7% while digital added another 31.7% and both “missed” 30%.
The reader is reminded that in the DMIST analysis above, women are counted more than once since many fulfill all of the three criteria. The reader is also cautioned that the data analysis is really preliminary. It remains to be seen if the subgroups analyzed are truly legitimate, or actually artificial. Based on the physics, actual image comparisons, and blinded reader studies it is clear that digital mammography is quite comparable to film/screen mammography and may be superior in some subpopulations. The DMIST data are encouraging, but it is not clear that the development of digital mammography will result in the increase in breast cancer detection that was anticipated.
It is actually somewhat disconcerting that, although DMIST showed that, among some subgroups more cancers were detected by digital alone, there were still cancers detected only on the film/screen studies. A major unanswered question is why were cancers seen on one system and not on the other. The investigators need to review the studies to determine whether or not these were due to observer error, or true differences. If the latter is the case it would suggest that, to maximize cancer detection, both studies would need to be obtained which, of course, would be
prohibitive. I suspect that the differences in DMIST were largely due to observer variability and not true technological differences. Unfortunately, the investigators reported the results before they reviewed the cancer cases to see why cancers were missed and why they were seen. In our own DMIST cases one cancer was missed on the digital examination that was reported by the film/screen reader, and one case was missed on film/screen study and seen by digital. When we reviewed the images, the cancers were evident on both studies and had been overlooked by the readers. The cancer that was missed by film/screen was a spiculated mass in a fatty breast while the cancer missed by digital was evident as calcifications in a dense breast. The DMIST numbers are an objective analysis, but the investigators need to review the images to determine the true significance of their results.
prohibitive. I suspect that the differences in DMIST were largely due to observer variability and not true technological differences. Unfortunately, the investigators reported the results before they reviewed the cancer cases to see why cancers were missed and why they were seen. In our own DMIST cases one cancer was missed on the digital examination that was reported by the film/screen reader, and one case was missed on film/screen study and seen by digital. When we reviewed the images, the cancers were evident on both studies and had been overlooked by the readers. The cancer that was missed by film/screen was a spiculated mass in a fatty breast while the cancer missed by digital was evident as calcifications in a dense breast. The DMIST numbers are an objective analysis, but the investigators need to review the images to determine the true significance of their results.
Based on the physics, actual image comparisons, and blinded reader studies it is clear that digital mammography is quite comparable to film/screen mammography. Digital may prove to be somewhat better at detecting cancers. The pressure is now greater for practices to switch to digital mammography. I suspect that the reason more practices have not converted to digital mammography is due to the much higher costs involved. The questionable increased cancer detection rate still makes it difficult to justify the costs, but public pressure could drive the conversion. Nevertheless, the development of digital detectors has resulted in major new approaches to x-ray imaging of the breast. I believe that the major advantages found using digital breast tomosynthesis (DBT) (increased cancer detection and decreased false positives) will result in the replacement of conventional two-dimensional mammography to DBT (see Digital Breast Tomosynthesis).
Direct Digital Mammography
Digital mammography differs from a digitized mammogram. It is a mammogram that is acquired primarily as an electronic image without the use of x-ray film. Some digital mammography systems convert the x-ray photons passing through the breast into light by using materials similar to the screens of film/screen systems. Amorphous-selenium detectors convert the x-ray photon energy directly to an electronic signal, while the incident photons cause an energy level increase in the stimulable phosphor systems that is stored and then released when the detector is scanned by a laser. The light energy that is released is converted into an electronic signal (15).
Digital detectors can be thought of as a spreadsheet. Each cell in the spreadsheet represents an x-ray detector (or light detector, if the x-rays are first converted to light). Since each cell has a row number and a column number (Fig. 27-6), the coordinates of the cell and the energy of the x-ray photons counted at those coordinates (or number of photons themselves) can be recorded as a series of numbers. Each cell is called a pixel, which stands for picture element. The size of the pixel is one of the major components of the spatial resolution of the system. Although there are a number of other factors involved, the size of the pixel determines the size of the structures that can be resolved by a digital system. The image can thus be defined by row numbers, column numbers, and photon numbers at each of these coordinates, defining the entire recorded image as series of digits—hence, a digital image.
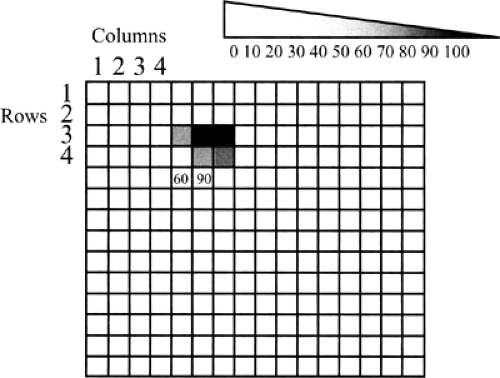 Figure 27-6 A digital image can be defined completely as a series of numbers (digits). A digital image is like a spreadsheet where the rows are numbered, the columns are numbered, and the amount of energy hitting each detector element can be represented as a number. Thus, the whole image can be represented as a series of numbers. By assigning each number a level of gray, the image can be converted from numbers to a picture. |
The process can then be reversed to display the image. Instead of numbers in cells of the spreadsheet, a level of gray (white to black) can be assigned to each cell in proportion to the number (energy) of the photons that were counted at that cell location. The image becomes visible as a grayscale image by filling in the cells with a level of gray that is based on the energy or number of x-rays counted in each cell. The numbers between pure white and pure black can be assigned, and contrast and brightness can be easily varied and enhanced because different “windows” and grayscale levels can be assigned, since the image is computer generated. Unlike a film/screen image, which cannot be altered and is based on the exposure used and the chemical processing of the film, a digital image can be adjusted in infinite combinations, including completely inverting the image so that black structures become white and white become black (Fig. 27-7). Since the image is defined by numbers, it can be sent electronically anywhere in the world and can be displayed simultaneously in an infinite number of sites to look exactly the same, regardless of
where it is viewed. This great range, versatility, and improvement in contrast separation is one of the major benefits of a digital mammogram.
where it is viewed. This great range, versatility, and improvement in contrast separation is one of the major benefits of a digital mammogram.
 Figure 27-7 Positive- or negative-image presentation. A simple manipulation, easily performed with a digital image, is the reversal of the image, so that white on black (A) becomes black on white (B). These calcifications imaged on the AS&E digital system in 1985 were due to high grade DCIS. |
Theoretically, a pixel can be any size, and the detector pixels can vary in size, depending on the type and design of the detector. Although there are other important variables, in general, the smaller the pixel, the higher the potential spatial resolution (Fig. 27-8). Larger pixel sizes provide lower spatial resolution. Although smaller pixels should be able to produce higher spatial resolution if the dose is held constant, this benefit may be diminished by the fact that signal-to-noise ratio (SNR) will decrease as the pixel size is diminished and the image will be noisier. This effect can be seen in the following example. Assume that 100 x-ray photons fall onto a 100-μm pixel and that there are 20 noise signals that are generated for each pixel. The SNR would be 100/20 or 5. If we now divide up the pixel into 4 smaller pixels so that each is 50 μm (Fig. 27-9), the signal
is divided by 4 so that each pixel now sees 25 photons. However, since the noise is the same for each pixel (20 spurious counts per pixel), the SNR will drop to 25/20 or 1.25 and the image will appear noisier. This is oversimplified, but the important point to realize is that simply having smaller pixels does not mean that the image is improved.
is divided by 4 so that each pixel now sees 25 photons. However, since the noise is the same for each pixel (20 spurious counts per pixel), the SNR will drop to 25/20 or 1.25 and the image will appear noisier. This is oversimplified, but the important point to realize is that simply having smaller pixels does not mean that the image is improved.
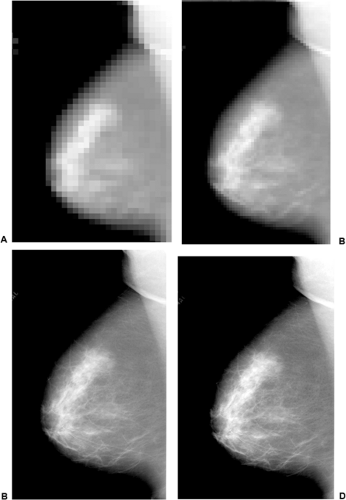 Figure 27-8 As the pixel size decreases the spatial resolution increases. With large pixels the spatial resolution is very poor (A). As the pixel size decreases the spatial resolution improves (B–D). |
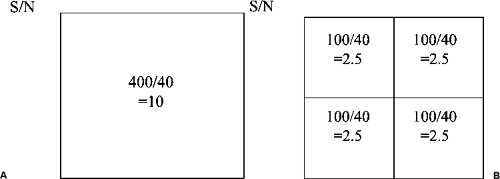 Figure 27-9 Increasing the resolution by decreasing the size of the pixel can worsen the signal-to-noise ratio. If a detector pixel is 400 μm on a side (A), the noise level for each pixel is 40, and 400 signals are detected, then the signal-to-noise ratio is 400/40, which is 10. If the size of the detector elements is cut in half so that each is 100 μm (B) and nothing else is done, then the signal-to-noise ratio is degraded. The noise level in each detector element is still 40, but the signal at each pixel is now only ¼ that of the larger pixel, since the signal must be divided over 4 elements. Each pixel sees 100 signals. The signal-to-noise ratio drops to 100/40, which is 2.5. |

Stay updated, free articles. Join our Telegram channel

Full access? Get Clinical Tree


