Abstract
Objectives
This study aimed to investigate dyssynchronous heart failure in fetuses of mothers with diabetes mellitus (FDM) and fetal controls (FC) using two-dimensional speckle tracking echocardiography (2D-STE) and novel M-mode prototype software (PS).
Methods
In this cohort study 174 fetuses were analyzed, 87 in the FDM-cohort and 87 gestational age-matched fetuses in the FC-cohort. A subgroup of 38 fetuses formed the final case group, with a high median frame rate of approximately 160 frames/s. Using 2D Cardiac Performance Analysis software (TOMTEC, Unterschleissheim, Germany) we measured global longitudinal strain (GLS). TOMTEC PS detected annular displacement by assessing an artificial M-mode on the previously generated tracking. Dyssynchrony (DYS) was calculated as the inter- and intraventricular difference in time to peak GLS or annular displacement.
Results
Greater DYS was observed in all basal myocardial measurement sites and software between FDM-cohort compared to FC-cohort and no significant correlation was found between DYS measurements and gestational age. Intraventricular DYS between the basal segments was statistically significant (all p ≤ 0.036, Wald test of univariate regression models). The PS performed best in DYS measurements identifying right ventricular DYS as potentially predicting FDM (FDM: median, 18.5 (interquartile range [IQR], 13.9–25.0) ms vs. FC: median, 2.7 [IQR, 1.5–3.5] ms; p < 0.001).
Conclusion
Increased intraventricular DYS demonstrated an impact of maternal diabetes mellitus on fetal hearts independent of gestational age. The prototype M-mode method identified cardiac dysfunction with higher accuracy than the conventional analysis. High-quality echocardiographic image acquisition is imperative for clinical application of 2D-STE and related advanced technologies.
Introduction
Diabetes mellitus is a substantial and growing health issue with increasing gestational diabetes prevalence averaging 14% worldwide [ ], 16.3% in Europe [ ], and 15.1% in Germany, as evidenced by data from 2019 to 2021 [ ]. Pedersen et al. [ ] suggested that chronic maternal hyperglycemia causes fetal overgrowth and overstimulates insulin synthesis and release in fetal beta cells, which in turn increases the metabolic rate. This can lead to congenital heart defects, hypertrophic cardiomyopathy [ ], and elevated perinatal morbidity and mortality. Diabetic pregnancies are considered high-risk due to macrosomia, preterm delivery, and a five-fold increase in intrauterine fetal death [ , ]. Later in life, children of mothers with diabetes mellitus exhibit a predisposition toward obesity, diabetes mellitus, and cardiovascular morbidity [ ]. Fetal cardiac impairment occurs even in well-controlled diabetes [ , ] highlighting the urgent need for early monitoring of fetal myocardial function.
Speckle tracking echocardiography (STE) is an ultrasound technique quantifying and visualizing global and regional systolic and diastolic cardiac function and detecting even subtle changes [ ]. The use of STE was previously reported in research and clinical settings [ , ]. Acoustic markers, called speckles, are tracked over a cardiac cycle [ ] to measure local tissue movement based on the geometric shift of each speckle [ ]. Optimal tracking requires adequate frame rate and image quality [ ]. Preliminary research on STE favored measurement of strain as a deformation parameter and mechanical dyssynchrony (DYS) as the absolute time difference between two segmental intra- or interventricular peaks of strain [ ]. The latter needs further confirmation as a potential diagnostic marker for diabetes mellitus [ ]. Reported limitations regarding technological impediments necessitate the exploration with accurate, high-resolution technology [ ].
This is the first study of a tracked M-mode approach by the prototype software (PS) for calculating DYS based on annular displacement, with a comparison to the sole STE software assessment. This study aimed to identify essential factors differentiating fetuses with maternal diabetes mellitus and control fetuses. As the quality of the echocardiographically generated ultrasound loops directly impacts the results [ ], the objective was to compare results of loops representing daily clinical contexts with selected high-quality images.
Materials and methods
Study population
For our exploratory retrospective cohort study, 174 subjects comprising 53% males and 45% females were recruited at the Department of Obstetrics and Gynecology of the University Hospital Münster between March 2013 and December 2022. Informed consent was obtained during routine fetal ultrasounds and echocardiographic examination following the Deutsche Gesellschaft für Ultraschall in der Medizin [ ] guidelines. Outcome data, including gestational age at delivery, birth weight, and 5-min Apgar, were collected at the follow-up visit.
The study involved 87 fetuses of mothers diagnosed with pregestational or gestational diabetes mellitus (FDM) and 87 gestational age-matched fetal controls (FC), subsequently designated as the Collective Group. Gestational diabetes mellitus was defined as a positive response to the 75 g oral glucose tolerance test taken between 24th to 28th gestational wk or in the case of risk factors at the 20th wk. Gestational age, ranging from 19 to 37 wk, was determined by fetal crown-rump length during a first-trimester ultrasound. The study excluded fetuses with malformations, chromosomal abnormalities, intrauterine growth restriction with growth below the 10th percentile, congenital heart anomalies, fetal infections, monochorionic twins, or stillbirth.
The study protocol described above and below was developed consistent with the Declaration of Helsinki and approved by the Institutional Review Board (approval number: 2021-794-f-S).
Image protocol
Five obstetricians specialized in prenatal echocardiography (R.S., M.M., K.O., U.M., J.B.) recorded four-chamber loops using an EPIQ7 ultrasound system with a 9-MHz transducer (C9-2, Philips Medical Systems, Andover, MA, USA). During fetal rest, they adjusted the width, depth, and focus to optimize the frame rate. Standard Digital Imaging and Communications in Medicine files were stored without frame rate loss and were subjected to a retrospective analysis with blinded patient diagnosis. Anonymized loops were analyzed by a single operator using the offline software program 2D Cardiac Performance Analysis (Fetal) (CPA) (TOMTEC Imaging Systems GmbH, Unterschleissheim, Germany). Out of several loops per fetus, those with high frame rate and successful tracking within three attempts were selected.
To determine parameters predicting FDM in a basic research setting imitating optimal conditions of ultrasound image quality, a Quality Group was formed. This group consisted of 19 fetuses from each cohort, in total 67% male and 35% female, representing a sub-group within the larger Collective Group, and thus served for comparison purposes with the routine ultrasound image quality from the Collective Group. The criteria for ranking and selecting these high-quality ultrasound images included a visually verified fully mapped four-chamber view, well-contrasted myocardial walls, and a frame rate of approximately 160 frames/s, as recommended by D’hooge et al. and Haeger et al. [ , ]. The selection of images was constrained by the assumption that high maternal weight negatively impacts ultrasound image quality and software application, and thus primarily affects FDM.
Firstly, one cardiac cycle from each loop was selected by drawing an anatomic M-mode across the atrioventricular valves or the interventricular septum which allowed identification of end-diastole and end-systole by the opening and closing of the atrioventricular valves. Secondly, the operator marked the endocardial border as the region of interest (ROI) from the basal septum to the basal lateral wall in an end-diastolic frame of the single left ventricle (LV) or right ventricle (RV) [ ]. Then, the algorithm tracked the displacement of the myocardial wall throughout the cardiac cycle, and if necessary, manual alignment was performed. CPA identified six equal-sized segments in LV and RV. Segmental strain curves over time were created, and STE parameters and heart rate were calculated ( Fig. 1 ). Tracking data from CPA was exported to Hierarchical Data Format (HDF5) files and served as input for TOMTEC PS, developed as a competitive software alternative. It executes an algorithm in which a linear gray value profile follows a tracked contour frame by frame over one cardiac cycle previously generated in CPA. These profiles produce an artificial M-mode. Corrections were made by tracing the M-mode pattern and subsequently a tracking curve was displayed. The position of the M-mode axis and the course of the curve were adjusted as required along the underlying calculated grayscale M-mode ( Fig. 2 ). By comparing septal and lateral annular tracking curves, DYS, suggesting cardiac disorder, can be detected.


Measurement parameters
The conventional method for computing global longitudinal Lagrangian strain (GLS) for a single LV or RV was to calculate the difference in deforming myocardial length change between end-diastole (L0) and end-systole (L1) divided by the initial end-diastolic length (L0) [ ]. A negative value indicated shortening.
DYS was defined as the absolute time difference between the time to peak of the maximal strains or maximal displacements of two different segments ( Fig. 3 ). We calculated intra- and interventricular DYS for basal, medial, and apical segments using CPA results, whereas PS generated only basal intra- and interventricular DYS.

The systolic DYS index (SDI) was defined as the systolic dispersion within the segmental strain curves, representing volume curves obtained using CPA in relation to the cardiac cycle length [ ]. The SDI thus measures the coherence of the phase positions for all strain curves of a patient and was calculated for the Quality Group using Matlab R2023a (MathWorks, Natick, MA, USA). We excluded the septal and lateral wall apical curves because of the confounding effect of potential apical foreshortening which describes the inclusion of the apex when it is not exactly positioned in the image plane [ ]. The segmental strain curves were recorded over time using a common plot. Furthermore, the displacement of the basal septal or basal lateral wall was plotted over time using PS results for the Quality Group.
Statistical analysis
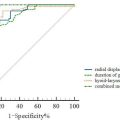
We employed SPSS software (IBM Corporation, New York, NY, USA, version 29) to perform statistical analysis. Continuous variables were reported as median and interquartile range and compared between the FDM-cohort and FC-cohort using the Mann–Whitney U test [ ]. To evaluate the quality of univariate predictors for FDM, we opted for univariate logistic regression analysis. In this analysis, the probability of belonging to FDM was estimated based on the value of a single predictor variable. The corresponding cut-offs for predicting FDM in a clinical setting were determined by maximizing the sum of sensitivity and specificity as defined by Youden’s index [ ]. Two multivariable logistic regression models were fitted, each including all DYS variables calculated by CPA or PS along with gestational age at ultrasound and heartrate as the clinically relevant and fluctuating covariates, to compare the predictive ability of both programs in a clinical setting. A similar model was fitted, including conventional GLS variables and the same clinical covariates. Performance of the multivariate and univariate models was compared using Nagelkerke’s R 2 and area under receiver operating characteristic (ROC) curves (AUC) analyses [ , ]. To test for significance between ROC curves, the highest AUC of each software was employed in the DeLong test [ ]. We examined the diversity in associations between gestational age, fetal outcome variables, and myocardial function parameters using Spearman’s correlation [ ]. Box-and-whisker plots were generated to illustrate DYS at different segmental levels, measurement variability between the two software, and SDI in FDM and FC.
For hypothesis generation, we designed all analyses as exploratory. Consequently, they were not corrected for multiple testing. p- values and confidence intervals were also considered exploratory, not confirmatory, and were calculated two-sided. Within this exploratory setting, p -values ≤ 0.05 were considered statistically noticeable (“significant”). All analyses were performed on complete cases, thus missing values were not imputed.
Results
Study population characteristics
Measurements were feasible in 174 individuals comprising the Collective Group and 38 comprising the Quality Group. We examined study population characteristics and myocardial STE parameters in FDM- and FC-cohort ( Table 1 ). BMI differed significantly between FDM and FC within the Quality Group ( p < 0.001) and the Collective Group ( p < 0.001). Median gestational age at ultrasound was 30.6 (24.1–35.4) wk in FC-cohort versus 30.4 (23.9–35.4) wk in the gestational age-matched FDM-cohort. In contrast, the Quality Group exhibited 30.3 (26.7–35.4) wk in FC versus 33.7 (27.1–36.4) wk in FDM. Among ultrasound images selected for quality median frame rate reached 199 (134–199) frames/s in FC and 147 (117–179) frames/s in FDM, while median frame rate in the Collective Group was lower (FC: 127 (103–199) frames/s vs. FDM: 139 (103–192) frames/s). There was a significant inverse correlation in the Quality Group between visually ranked image quality and BMI ( r = −0.401, p = 0.013). In accordance, echocardiography in FDM yielded significantly inferior image quality compared to FC ( r = −0.557, p < 0.001).
| Collective Group | Quality Group | |||||
|---|---|---|---|---|---|---|
| Parameter | FC (n = 87) | FDM (n = 87) | p-Value | FC (n = 19) | FDM (n = 19) | p-Value |
| Maternal characteristics | ||||||
| BMI at ultrasound (kg/m 2 ) | 23.7 (22.1–27.6) | 30.4 (26.7–34.6) | <0.001 a | 22.9 (21.5–25.1) | 35.9 (32.5–38.3) | <0.001 a |
| WG_US (wk) | 30.6 (24.1–35.4) | 30.4 (23.9–35.4) | 0.849 a | 30.3 (26.7–35.4) | 33.7 (27.1–36.4) | 0.470 a |
| Fetal characteristics | ||||||
| Heart rate (1/s) | 144.7 (137.3–151.4) | 143.7 (135.1–154.2) | 0.684 a | 143.0 (132.4–152.5) | 148.4 (132.0–154.4) | 0.795 a |
| GA at delivery (wk) | 39.43 (38.21–40.3) | 38.6 (37.1–39.3) | 0.011 a | 39.6 (38.0–40.4) | 37.0 (33.5–38.9) | 0.017 a |
| Birth weight (g) | 3275 (2817.5–3665) | 3420 (3000–3800) | 0.402 a | 3355 (2817.5–3717.5) | 3252.5 (2540–3765) | 0.804 a |
| Apgar after 5 min | 10.0 (9.0–10.0) | 10.0 (9.0–10.0) | 0.349 a | 10.0 (9.3–10.0) | 9.5 (9.0–10.0) | 0.384 a |
| Technical characteristics | ||||||
| Frame rate (1/s) | 127.0 (103.0, 199.0) | 139.0 (103.0, 192.0) | 0.849 a | 199.0 (134.0, 199.0) | 147.0 (117.0, 179.0) | 0.154 a |
| Frame number | 55.0 (43.0, 79.0) | 55.0 (44.0, 75.0) | 0.768 a | 78.0 (53.0, 82.0) | 59.0 (48.0, 74.0) | 0.154 a |
| Duration (ms) | 400.0 (378.0, 425.0) | 405.0 (375.0, 425.0) | 0.658 a | 400.0 (378.0, 434.0) | 405.0 (378.0, 432.0) | 0.863 a |
| GLS_LV (%) | −21.6 (18.1, 23.3) | −20.1 (16.6, 23.9) | 0.461 b | −23.5 (17.8, 27.3) | −25.1 (21.0, 30.3) | 0.230 b |
| GLS_RV (%) | −18.2 (14.4, 22.0) | −17.7 (14.9, 21.8) | 0.921 b | −21.0 (19.0, 24.2) | −22.9 (21.0, 27.3) | 0.316 b |
a p- value by Mann–Whitney U test.
b p- value by the Wald test of univariate logistic regression models. Significant values ( p < 0.05) in bold print. Global longitudinal strain (GLS) was defined as difference in deforming myocardial length change between end-diastole (L0) and end-systole (L1) divided by the initial end-diastolic length (L0).
Myocardial parameters
GLS values did not differ significantly between FDM and FC ( Table 1 ). The Collective Group had comparable values in FDM and in FC both in LV ( p = 0.461, OR = 0.977) and in RV ( p = 0.921, OR = 0.997), which decreased significantly with advancing gestational age (GLS_LV: p = 0.002; GLS_RV: p = 0.004). Conflictingly, in the Quality Group GLS turned out to be even higher in FDM than in FC in LV ( p = 0.230, OR = 1.077) and in RV ( p = 0.316, OR = 1.063) and showed no significant trend as gestational age progressed (GLS_LV: p = 0.841; GLS_RV: p = 0.41).
Basal intra- and interventricular DYS were higher in FDM compared to FC in the Quality Group and the intraventricular DYS showed statistical significance in both software ( Table 2 ). Differentiation between FC and FDM was highest within LV basal segments ( Fig. 4 ). A low power for inter- and intraventricular DYS in medial and apical segments was displayed by the odds ratios, ranging from 0.994 to 1.009, and Nagelkerke’s R 2 below 0.1 ( Table S1 ). We did not associate gestational age at ultrasound with DYS, whether measured by CPA or PS, due to lack of statistical power ( Table S2 ). The Collective Group revealed no significant DYS. In PS measurements Nagelkerke’s R 2 indicated a slight correlation of FDM or FC differentiation and intraventricular DYS parameters, but within a weak relationship ( Table S3 ). In contrast, the high-quality images of the Quality Group had a noticeably higher Nagelkerke’s R 2 ( Table 2 ).
Related posts:
 A Narrative Review of Image Processing Techniques Related to Prostate Ultrasound
 Assessing Intensive Care Unit Acquired Weakness: An Observational Study Using Quantitative Ultrasound Shear Wave Elastography of the Rectus Femoris and Vastus Intermedius
 Transcranial MRI-guided Histotripsy Targeting Using MR-thermometry and MR-ARFI
 Ischemia/Reperfusion Injury Enhances Accumulation of Perfluoropropane Droplets
 Sonopermeation With Size-sorted Microbubbles Synergistically Increases Survival and Enhances Tumor Apoptosis With L-DOX by Increasing Vascular Permeability and Perfusion in Neuroblastoma Xenografts
 Application of B+M-Mode Ultrasound in Evaluating Dysphagia in Elderly Stroke Patients
Stay updated, free articles. Join our Telegram channel

Full access? Get Clinical Tree


