Abstract
Objective
The rise in metabolic dysfunction–associated steatotic liver disease prevalence, closely linked with metabolic syndromes and obesity, demands accurate, cost-effective diagnostic methods for early-stage fat quantification in the liver. Here we demonstrate a novel dual-frequency ultrasound method that enables the quantitative measurement of liver fat fraction ex vivo and its correlation with actual fat content.
Methods
A total of 24 Wistar rats were divided into four different groups, where three groups were given a high-fat diet for 2, 4, and 6 wk, and the last group was given a control diet for 6 wk. Livers were imaged with ultrasound ex vivo in a water bath with a dual-frequency ultrasound transducer and experimental imaging protocol implemented on the Verasonics Vantage research ultrasound scanner. Ultrasound data were post-processed to estimate the non-linear bulk elasticity parameter and the liver samples were analyzed with respect to fat fraction and triglycerides.
Results
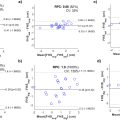
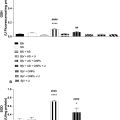
Rats given a high-fat diet had increased mean levels of liver fat compared with the control group. More importantly, correlation between the ultrasound-based estimation of the non-linear bulk elasticity parameter and fat fraction and triglycerides on an individual level was found to be strong (R 2 = 0.81, p = 5.8 × 10 -9 and R 2 = 0.72, p = 3.6 × 10 -7 , respectively).
Conclusion
This study demonstrates the potential of the novel dual-frequency ultrasound method for the quantitative measurement of liver fat fraction in excised rat livers, showing great promise for this method to become clinically relevant in the diagnosis and follow-up of patients with fatty liver disease.
Introduction
The term non-alcoholic fatty liver disease (NAFLD) was coined in 1980 and describes excessive hepatic fat accumulation in the absence of significant alcohol consumption [ ]. In 2023 metabolic dysfunction–associated steatotic liver disease (MASLD) was introduced as a more accurate term referring to fatty liver disease related to systemic metabolic dysregulation. The name change from NAFLD to MASLD comes with a simple set of criteria to enable easy diagnosis in the general medical community, including in primary care [ ]. MASLD is strongly associated with overweight and obesity, and its prevalence has increased significantly during the last decades, affecting 24% of the population globally [ ]. MASLD is now the major cause of chronic liver disease, including non-alcoholic steatohepatitis (NASH), advanced fibrosis, cirrhosis, and hepatocellular carcinoma [ ], and has become the leading indication for liver transplantation in the United States [ ].
Early diagnosis of MASLD is of great benefit to patients in terms of preventing progression, as total regression of liver fat is achievable at early stages of MASLD; for example, in response to weight reduction [ ].
Liver biopsy is considered the reference standard for diagnosis of MASLD; however, liver biopsy is an invasive and expensive procedure with potential risks and is often dis-favored by many providers and patients [ ]. Additionally, liver biopsy is not an option in routine clinical practice for treatment monitoring and patient follow-up. Interpretation of biopsies is also limited by significant inter- and intra-observer variability and sample error. Steatosis staging of relatively small liver biopsies is typically done by a visual estimation of fat content in histological images, resulting in semi-quantitative and crude staging. Extent of steatosis is defined as the percentage involvement by steatotic hepatocytes and is reported as mild (S1: 5%–33%), moderate (S2: 33%–66%), and severe (S3: >66%) [ , ].
Non-invasive techniques such as medical imaging can be both cost effective and less painful for patients. Magnetic resonance imaging–derived proton density fat fraction (MRI-PDFF) has emerged as a non-invasive and accurate tool for the quantitative assessment of liver fat [ ] and it is suitable as a surrogate to liver biopsy for assessing treatment response in clinical trials. MRI is, however, expensive and of limited availability, and thus not suitable for screening and follow-up of large patient groups. Computed tomography has shown correlations with MRI-PDFF for moderate and severe, but not mild, levels of steatosis [ ]; thus, lack of correlation at low-fat concentrations and the use of ionizing radiation makes this modality less attractive. Ultrasound B-mode imaging is a qualitative modality involving operator interpretations but is often clinically useful. The ratio between echogenicity of the renal cortex and liver tissue indicates the presence of steatosis, but this method is not suitable for accurate diagnosis and monitoring of MASLD. Quantitative ultrasound methods have also been explored, and ultrasound shear-wave elastography is a quantitative technique that has been found useful for assessing liver stiffness associated with fibrosis [ ]. However, shear-wave elastography has poor liver fat quantification accuracy [ ]. In recent years, several manufacturers of clinical ultrasound scanners have started to offer implementations of quantitative techniques based on the attenuation of the ultrasound wave, each with a proprietary name; 2D attenuation imaging (ATI) on Aplio i800 and higher from Canon (Otawara, Tochigi, Japan), attenuation coefficient (ATT) on Aloka-Arietta systems from Fujifilm (Minato city, Tokyo, Japan), ultrasound-guided attenuation parameter (UGAP) on LOGIQ E9 and higher from GE Healthcare (Chicago, Illinois, USA) and ultrasound-derived fat fraction (UDFF) on Acuson S3000 or Sequoia platforms from Siemens (Erlangen, Germany) [ ]. These methods mainly correlate attenuation with S0–S3 steatosis classifications [ ] and do not measure an exact liver fat fraction. These techniques are also relatively new and have not yet been adopted within clinical practice, possibly due to lack of standardization [ ]. A simpler point-of-care method that is incorporated in the Fibroscan device from Echosens (Paris, France) is the controlled attenuation parameter. This method is reasonably accurate for diagnosing the presence of steatosis but is limited by high failure rates in obese patients and low accuracy for actual quantification of steatosis levels [ ].
There is also on-going research on other quantitative methods, such as measurement of the speed of sound [ , ] and shear-wave attenuation [ ], which has been shown to correlate with the amount of fat in the liver or in liver-like tissue. Initial tests in relevant patient populations have shown the clinical potential of these methods. Composite models where combinations of sound speed and attenuation are used to estimate fat content have also been suggested, either by using compressional waves [ ] or shear waves [ ]. Another quantitative approach is the calibrated ultrasound method, which showed good performance in the prediction of moderate and severe steatosis in a study comprising 195 patients [ ]. Larger studies are needed to prove the accuracy and clinical potential of these methods.
Over the years our research group has worked with a dual-frequency ultrasound method for tissue characterization [ , ]. This method estimates a material parameter that we refer to as non-linear bulk elasticity (NBE), which is a representation of how the speed of sound of the material is affected by the experienced ambient pressure. NBE is estimated by transmitting and receiving ultrasound pulse complexes consisting of a high-frequency pulse placed on the peak or the trough of a low-frequency pulse, resulting in high-frequency pulses propagating at slightly different velocities depending on the polarity of the low-frequency pulse. This enables estimation of the NBE parameter, which in turn is correlated with the volume percentage of fat in the material, as demonstrated in a phantoms study by Solberg et al. [ ].
The purpose of this study is to demonstrate the dual-frequency method [ ] in ex vivo rat livers from rats with varying degree of steatosis. NBE ultrasound measurements were compared with measured fat fraction and total triglycerides (TG) content in corresponding liver samples to investigate the degree of correlation.
Materials and methods
Animal experiments
Wistar rats were fed a high-fat (HF) diet for 6 wk to induce steatosis in a rat model. Animal experiments were approved by the Norwegian Food Safety Authority (FOTS no. 29250). A total of 24 male Wistar rats, 7 wk of age, were purchased from Janvier Labs (Le Genest Saint Isle, France). The rats were kept in groups of three per cage and provided with water and feed ad libitum . After a 2-wk acclimatization period, with regular chow as feed, the feeding period started. The rats were 65 d old when this period started and had a mean ± standard deviation (SD) body weight of 401 ± 20 g.
The rats were divided into four groups (n = 6). One group was a control group given a purified control diet containing 10% fat with no sucrose from Ssniff Spezialdiäten GmbH (Soest, Germany; serial no. E157452-04) for 6 wk. Three groups were given Ssniff purified DIO-series diet with 60 kJ% fat (lard; serial no. E15742-34) for 2 (HF2w), 4 (HF4w), and 6 wk (HF6w), respectively. A summary of the groups is given in Table 1 .
| Group (short name) | Rats (n) | Feed | Period of feeding (wk) |
|---|---|---|---|
| Control diet, 6 wk (Ctr6w) | 6 | Purified control diet with 10% fat and no sucrose addition | 6 |
| High-fat diet, 2 wk (HF2w) | 6 | Purified DIO-series diet with 60 kJ% fat (lard) | 2 |
| High-fat diet, 4 wk (HF4w) | 6 (1 excluded) | Purified DIO-series diet with 60 kJ% fat (lard) | 4 |
| High-fat diet, 6 wk (HF6w) | 6 | Purified DIO-series diet with 60 kJ% fat (lard) | 6 |
Body weight was measured on a weekly basis. When the feeding period ended the rats were euthanized, blood and tissue were collected, and the livers were imaged with ultrasound in a saline bath ex vivo .
Ultrasound data acquisition
The ultrasound method is thoroughly described in Solberg et al. [ ], and a brief overview of the principles of the method is given here. With the dual-frequency method, two dual-frequency pulse complexes are transmitted along each scan line in the image. The pulse complexes consist of a high-frequency imaging pulse and a low-frequency manipulation pulse, as illustrated in Figure 1 . In the first complex, the high-frequency pulse is positioned on the peak of the low-frequency pulse, and in the second complex the high-frequency pulse is positioned on the trough of the low-frequency pulse. Due to non-linear tissue elasticity, the high-frequency pulse positioned on the low-frequency peak will propagate faster than the high-frequency pulse positioned on the low-frequency trough. This propagation velocity for the high-frequency pulse is approximated by eqn (1) :
where p c is the low-frequency pressure observed by the high-frequency pulse, c 0 is the linear propagation velocity, and β p is what we define as non-linear compressibility, or NBE, which is the product of linear compressibility and the co-efficient of non-linearity. A non-linear propagation delay (NPD) will hence accumulate with depth between the two high-frequency pulses, and this delay is measured as a function of depth and beam position from the received pulse-echo signals. A 2-D map of the NBE is then estimated by fitting a regularized model of the delay development to the measured delay using the optimization procedure described by Solberg et al. [ ].

A custom-made dual-frequency linear array ultrasound probe, “Vora-12-1,” designed by SURF Technology AS (Trondheim, Norway) and manufactured by Vermon SA (Tours, France), was used to acquire the ultrasound data. The design principles for dual-frequency probes are described by Myhre et al. [ ] and the probe was used in combination with the Verasonics Vantage 256 ultrasound system (Kirkland, Washington, USA). The probe transmitted at 14 MHz for the high-frequency pulse using weakly focused beams (f-number = 4) scanned along the array, and 0.7 MHz for the low-frequency pulse using plane waves. The high- and low-frequency parts of the transducer partly overlapped where the size of the high-frequency part was 22.4 × 3 mm, whereas the size of the low-frequency part was 38.4 × 10 mm. During transmission of low-frequency plane waves all elements were active, whereas the active aperture during focused high-frequency transmission was 4.6 × 3 mm.
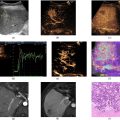
The livers were placed in a container filled with physiological 0.9% NaCl (B. Braun Medical, Vestskogen, Norway) and placed on a stack consisting of a 1.5 cm thick layer of Oasis and 1 cm-thick Aptflex F28 acoustic damping material (Precision Acoustic, Dorchester, UK) for acoustic damping and to avoid specular reflection from the bottom of the container. The container was placed on a stage with z-translation and the ultrasound probe positioned using a mechanical arm, as illustrated in Figure 2 . The container was manually moved in the x–y direction to image the liver in seven different positions, recording image planes in each position. Beamformed IQ data for each position were saved to a computer and further processed offline in MATLAB. For each image plane, a region of interest (ROI) covering the liver tissue was drawn by hand. NBE processing was performed within the selected ROI and the median NBE within the ROI was calculated.

Tissue preparation
Livers were excised immediately after euthanasia. Right median lobes were frozen on dry ice and stored at -80°C and left liver lobes were placed into a 0.9% NaCl water bath for ex vivo ultrasound imaging. After an imaging procedure lasting approximately 5 min, the left lateral liver lobes were placed in 4% buffered formaldehyde for fixation and later embedded in paraffin for sectioning.
Tissue analysis
The total lipid content of the liver samples was extracted by using a modified version of the Bligh and Dyer method [ ]. Briefly, samples of 200 mg frozen liver tissue were dried and weighed. Distilled water, methanol, and chloroform was added, and the samples were homogenized and centrifuged. After separation, the lipid content was quantified in the chloroform phase, resulting in a liver fat fraction given as a percentage for each sample.
Hepatic lipids were also quantified enzymatically on a Hitachi 917 system (Roche Diagnostics GmbH, Mannheim, Germany) using the triacylglycerol (GPO-PAP) and cholesterol kit (CHOD-PAP) from Roche Diagnostics, and the phospholipids FS kit from DiaSys (Diagnostic Systems GmbH, Holzheim, Germany), resulting in the total amount of TG given as μmol/g liver.
Histological analysis
Tissue sections of 4 μm thickness were obtained from three different levels of formalin-fixed paraffin-embedded rat livers, separated by 300 µm. The de-paraffinized and re-hydrated sections were stained with hematoxylin, erythrosine, and saffron (HES) and scanned at 40× amplification using an Olympus (Shinjuko, Tokyo, Japan) VS200 slide scanner.
Blood sample analysis
Serum samples from all animals were analyzed for alanine aminotransferase (ALAT) and aspartate aminotransferase per routine at St. Olavs Hospital’s central laboratory in Trondheim, Norway.
Statistical analysis
A Shapiro-Wilk normality test was performed on liver fat, TG, cholesterol, ALAT, and NBE in each treatment group, and normal distribution was not found in any variables or groups. Hence the non-parametric method, a pairwise Wilcoxon rank sum test, was performed for a “4 choose 2” comparison of treatments separately for each measurement of liver fat fraction, TG, and NBE. Linear regression analysis was performed to assess the relationship between NBE as a predictor and respective TG and total fat fractions as dependent variables. A significance level of 0.05 was used to assess the statistical significance in all hypothesis tests. All analyses were performed using R statistical software (v4.3.3; R Core Team 2024).
Results
Body weight
All rats were weighed once a week, and 23 out of 24 rats had monotonically increasing body weight during the experimental period, as shown in Figure 3 . One rat in the HF4w group had a progressive weight loss of 18% and was therefore euthanized on day 10 and excluded from the study. Severe constipation was revealed upon dissection. As seen from Figure 3 , there was substantial variation within the experimental groups. The mean weight was lowest for the control group; however, the only significant difference found between groups was between the HF4w group and the control group at the 4 and 6 wk time points ( p = 0.02 and p = 0.004, respectively).

Related posts:
 Strain Patterns With Ultrasound for Assessment of Abdominal Aortic Aneurysm Vessel Wall Biomechanics
 Evaluation of Renal Masses Using Contrast-Enhanced Ultrasound with Sonovue and Sonazoid
 A Bioengineered Cathepsin B-sensitive Gas Vesicle Nanosystem That Responds With Increased Gray-level Intensity of Ultrasound Biomicroscopic Images
 Automated Approach for Enhancing Fetal Head Station Assessment in Labor with Transperineal Ultrasound
 Classification of Neoadjuvant Therapy Response in Patients With Colorectal Liver Metastases Using Contrast-Enhanced Ultrasound—With Histological Pathology as the Gold Standard
 Ultrasound and Gold Nanoparticles Improve Tissue Repair for Muscle Injury Caused by Snake Venom
Stay updated, free articles. Join our Telegram channel

Full access? Get Clinical Tree


