Extra-Axial Masses
MENINGIOMA
KEY FACTS
Most common extra-axial adult tumor; most common intracranial tumors (15% to 20%) in adults.
Occurs mainly in middle-aged women (possibly because of increased sensitivity of tumoral arachnoid cap cells to sex hormones) and patients with neurofibromatosis type II (especially multiple meningiomas).
Locations: parasagittal/falcine (50%), sphenoid wing (20%), floor of the anterior cranial fossa (10%), parasellar region (10%), tentorium, and cerebellopontine angle region.
Histological types: typical (90% to 95%), atypical (3% to 5%), and frankly malignant (1%).
Classic “hyperostosis” of underlying bone is present in only 5% of cases; typical meningioma may erode bone.
On MRI, a “dural tail” suggests a mass in extra-axial but is probably related to reactive changes rather than tumor extension.
Histology cannot be predicted, but bright meningiomas on T2 and those with restricted diffusion tend to have more atypical microscopic features. All have very high perfusion (elevated rCBV).
Brain edema is present in 60% of cases.
On MRS, about 10% to 30% have peak at 1.5 ppm corresponding to alanine, which inverts below baseline at TE = 144 ms.
Main differential diagnosis: metastasis, sarcoidosis.
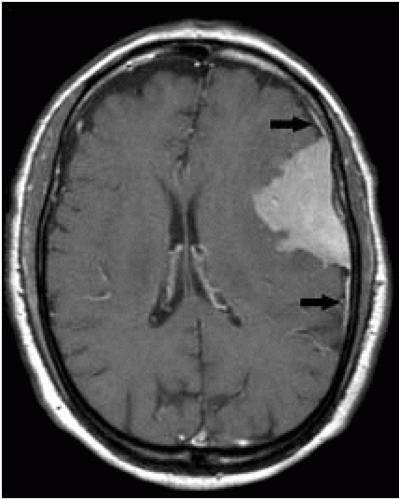 FIGURE 13-1. Axial postcontrast T1 shows the left temporal solidly enhancing meningioma with typical dural “tails” (arrows). |
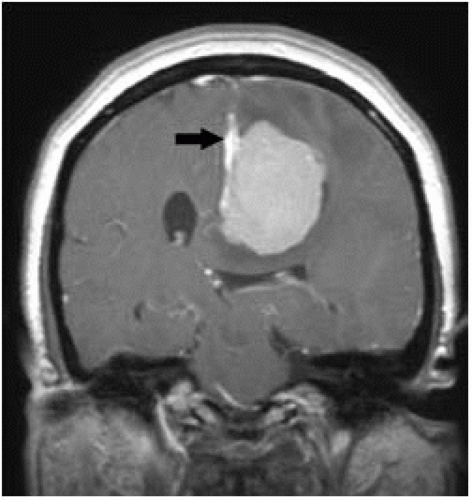 FIGURE 13-2. Coronal postcontrast T1, in a different patient, shows the left parafalcine meningioma with dural “tail” (arrow). |
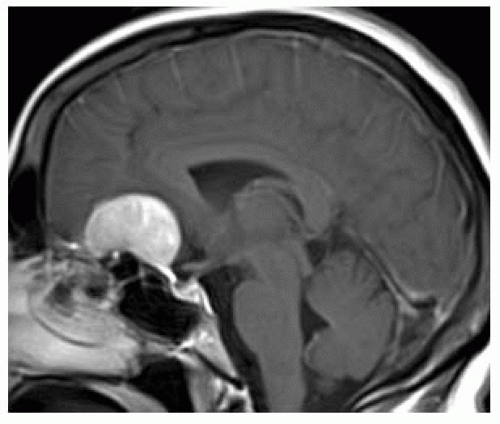 FIGURE 13-3. Midsagittal postcontrast T1, in a different patient, shows the midline frontobasal meningioma with hyperaeration of underlying sphenoid sinus (pneumosinus dilatans). |
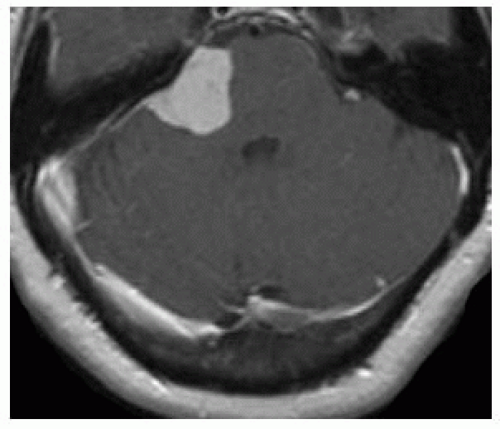 FIGURE 13-4. Axial postcontrast T1, in a different patient, shows enhancing meningioma in the right CPA region. |
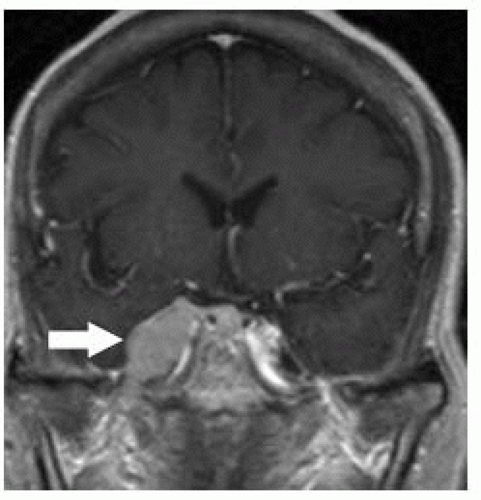 FIGURE 13-5. Coronal postcontrast T1, in a different patient, shows the right cavernous sinus meningioma (arrow) extending inferiorly via V3. |
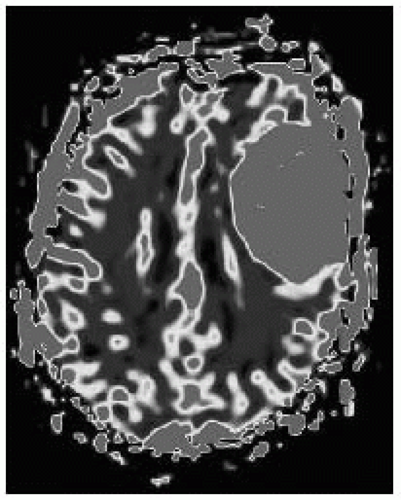 FIGURE 13-6. MR perfusion, rCVB map, in a different patient, shows markedly increased perfusion in tumor. (See color insert) |
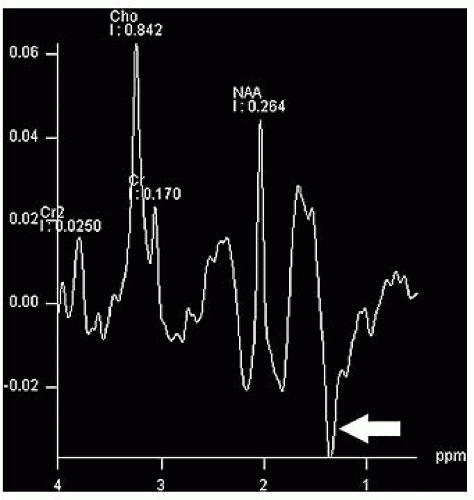 FIGURE 13-7. MRS, TE = 144 ms shows elevated choline (Cho) and alanine (arrow). |
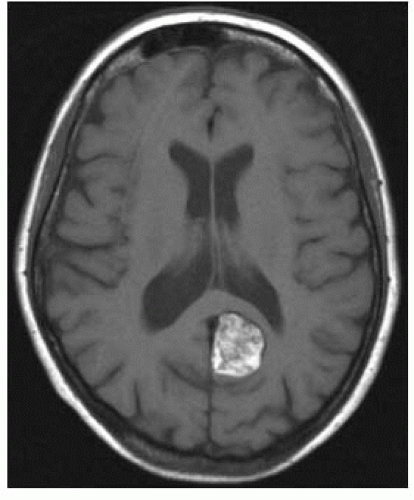 FIGURE 13-8. Axial noncontrast T1, in a different patient, shows bright lipomatous meningioma in the left posterior parafalcine region. |
SUGGESTED READING
Nagar VA, Ye JR, Ng WH, Chan YH, Hui F, Lee CK, et al. Lim diffusion-weighted MR imaging: diagnosing atypical or malignant meningiomas and detecting tumor dedifferentiation. Am J Neuroradiol 2008;29:1147-1152.
Bulakbasi N, Kocaoglu M, Örs F, Tayfun C, Üçöz T. Combination of single-voxel proton MR spectroscopy and apparent diffusion coefficient calculation in the evaluation of common brain tumors. Am J Neuroradiol 2003;24:225-233.
EPIDERMOID
KEY FACTS
Arise from intracranial inclusion of epithelial elements during neural tube closure and are ten times more common than intracranial dermoids.
Do not contain skin appendages.
Tend to present in early adulthood and grow very slowly.
Locations: cerebellopontine angle cistern (50%), sella and parasellar (10% to 15%), fourth ventricle, and prepontine cistern (all located off the midline). Remember that in the posterior fossa in children, they may be associated with Klippel-Feil syndrome and even become infected.
Also occur in diploic space of skull (10%), giving rise to a lytic lesion with scalloped sclerotic borders. Also involve the fontanelles in children.
MRI sequences that distinguish epidermoid from arachnoid cyst are FLAIR and DWI (>signal in epidermoids), CISS/FIESTA (visualization of internal structures), and MRS (presence of lipids).
Main differential diagnosis: arachnoid cyst, black dermoid, cystic tumor, cysticercosis, neuroen-teric cyst.
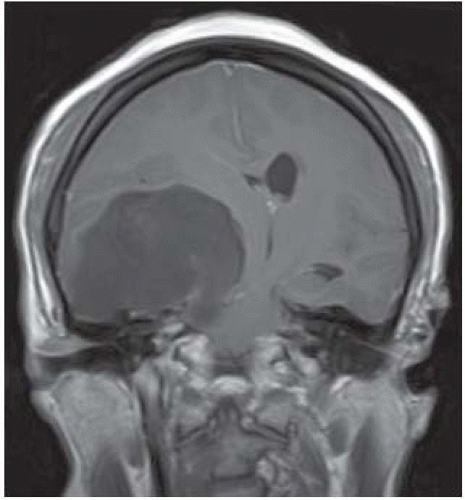 FIGURE 13-9. Coronal T1 shows a large right temporal epidermoid that is of low signal but not equivalent to CSF. |
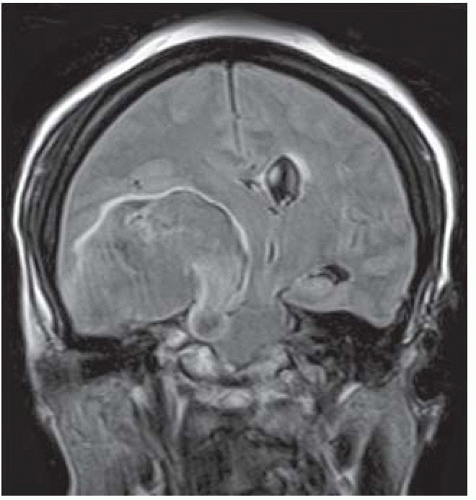 FIGURE 13-10. Corresponding FLAIR shows that the contents of the mass are of higher signal than fluid. |
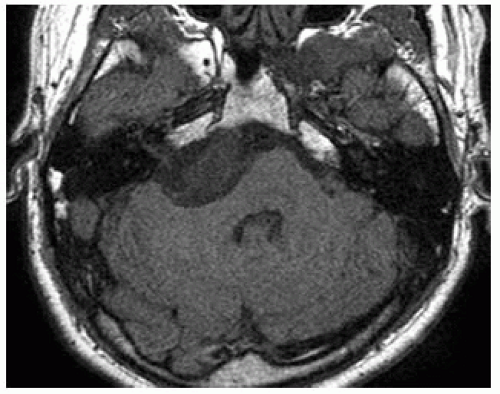 FIGURE 13-11. Axial noncontrast T1, in a different patient, shows slightly bright epidermoid in the right cerebellopontine angle cistern. |
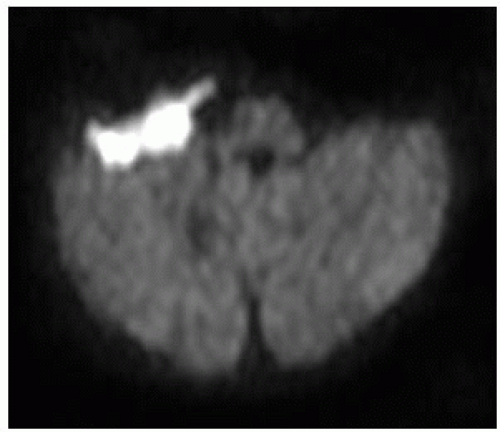 FIGURE 13-12. Corresponding DWI shows the lesion to be very bright. |
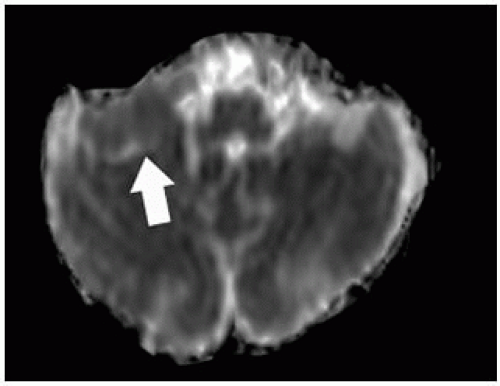 FIGURE 13-13. Corresponding ADC map shows restricted diffusion in the lesion (arrow). |
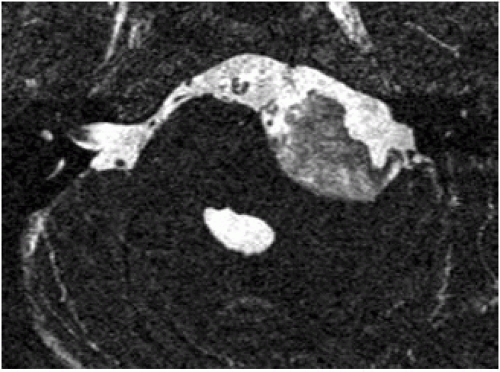 FIGURE 13-14. Axial CISS, in a different patient, shows complex internal features of a left CPA cistern epidermoid. |
SUGGESTED READING
Kallmes DF, Provenzale PM, Cloft HJ, McClendon RE. Typical and atypical MR imaging features of intracranial epidermoid tumors. AJR 1997; 169: 883-887.
Ikushima I, Korogi Y, Hirai T, Sugahara T, Shigematsu Y, Komohara Y, et al. MR of epidermoids with a variety of pulse sequences. Am J Neuroradiol 1997;18(7):1359-1363.
DERMOID
KEY FACTS
Probably arise from intracranial inclusion of ectodermal elements during neural tube closure.
Contain skin appendages (sebaceous and sweat gland, hair follicles).
Rare (<1% of all intracranial tumors), present in early-to-middle adulthood (30 to 50 years) with slight male predominance.
Common sites: lumbar spine (associated with spinal dysraphism), parasellar region, floor of anterior cranial fossa, posterior fossa including fourth ventricle (may be associated with Klippel-Feil syndrome and other dysraphisms of the craniocervical junction), and fontanelles.
Almost all intracranial dermoids are midline in location and have the same imaging characteristics as fat due to the liquid cholesterol that they contain.
They may produce chemical meningitis (with headaches and seizures) if they rupture and spill their contents into CSF spaces.
Main differential diagnosis: lipoma, teratoma, bright epidermoid, craniopharyngioma, hemorrhagic arachnoid cyst.
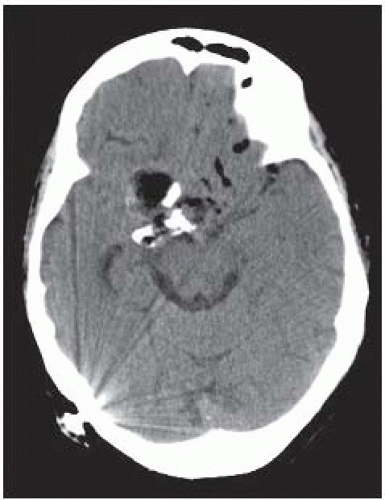 FIGURE 13-15. Axial CT shows complex fatty and calcified mass in the anterior cranial fossa and suprasellar cistern. There are droplets of fat in the sulci of the left frontal lobe. |
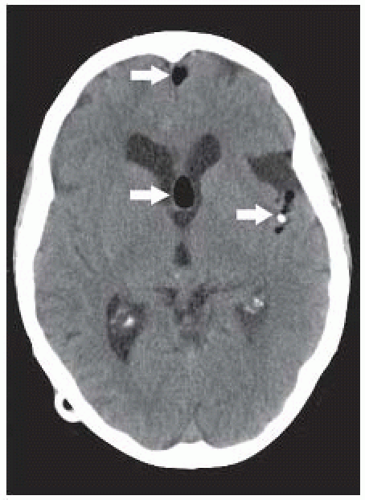 FIGURE 13-16. Axial CT, in the same patient, shows fat (arrows) in sulci and in the ventricles and mild hydrocephalus. |
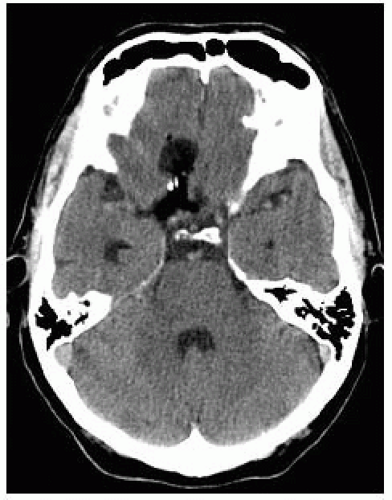 FIGURE 13-17. Axial CT, in a different patient, shows the right frontobasal low-density dermoid. |
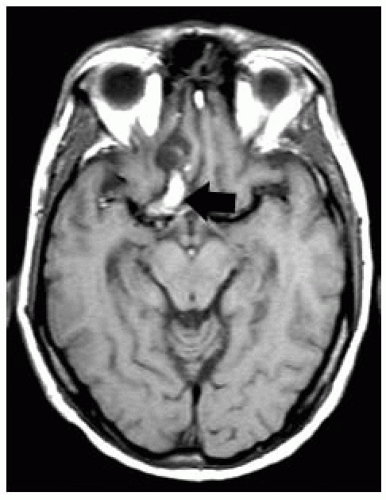 FIGURE 13-18. Axial T1, in the same patient, shows the bright (fatty) dermoid (arrow). |
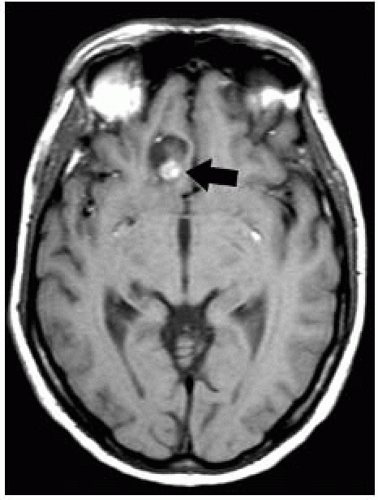 FIGURE 13-19. Axial T1, in the same patient, shows the fatty cephalad portion of the dermoid (arrow). |
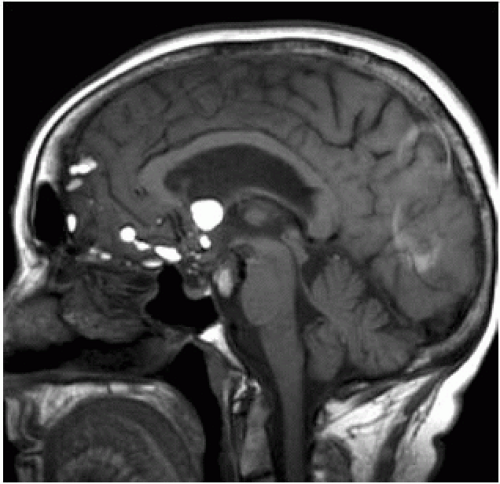 FIGURE 13-20. Midsagittal T1, in a different patient, shows a suprasellar dermoid with fat droplets in frontal sulci. |
SUGGESTED READING
Warakaulle DR, Anslow P. Differential diagnosis of intracranial lesions with high signal on T1 or low signal on T2-weighted MRI. Clin Radiol 2003;58:922-933.
LIPOMA
KEY FACTS
Arise from erroneous differentiation of cells (meninx primitiva), which normally form the subarachnoid space.
Eighty-five percent occur in midline (50% are pericallosal); other locations: quadrigeminal plate, cerebellopontine angle, and suprasellar cisterns. Pericallosal lipomas may be tubulonodular (associated with abnormalities of the corpus callosum) and curvilinear (generally no abnormalities of the corpus callosum). While dermoids that are also T1 bright tend to occur in the midline, lipomas happen in infoldings of the subarachnoid space with no midline predilection.
Associated calcification is common in pericallosal lipomas particularly when associated with callosal dysgenesis. Callosal lipomas can be curvilinear, and with them the corpus callosum tends to be normal or near normal or they can be nodular (mass-like) which are nearly always accompanied by callosal dysgenesis.
Main differential diagnosis: dermoid, teratoma.
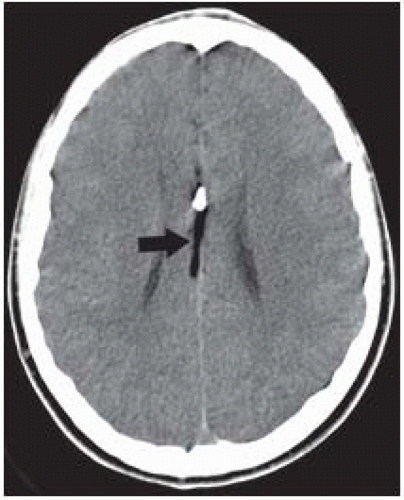 FIGURE 13-21. Axial CT shows a thin midline lipoma (arrow) of low density. A calcification is present anteriorly. |
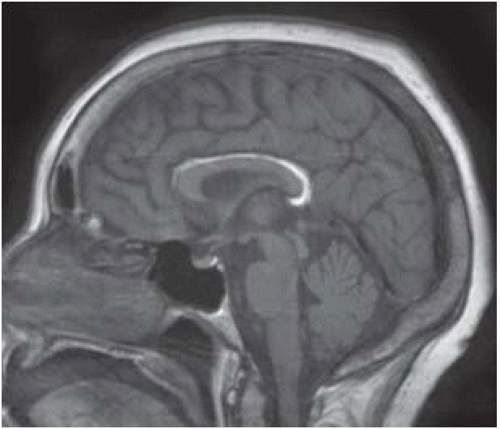 FIGURE 13-22. In the same patient, midsagittal T1 shows the pericallosal location of the lipoma.
Related posts:Stay updated, free articles. Join our Telegram channel
Full access? Get Clinical Tree
 Get Clinical Tree app for offline access

|