Interventional radiologists frequently assume care of patients with high severity of acute and chronic illnesses, many of which can contribute to shock and organ failure in the inpatient setting. The ability to quickly assess the hemodynamic status of a decompensating patient at bedside is therefore a valuable skill for IRs to develop. Assessment of intravascular volume status is fundamental to this—shock and organ failure are commonly precipitated by hypovolemia resulting in decreased circulating blood volume and organ perfusion, but may also develop due to fluid overload resulting in heart failure and organ malperfusion due to venous congestion. The venous excess ultrasound (VExUS) protocol is a rapid point-of-care sonographic exam that scores severity of systemic venous congestion by integrating analysis of multiple venous beds. Here, we review traditional methods of estimating intravascular volume status, technical aspects of the VExUS examination, interpretation of VExUS results, and practical applications for VExUS.
Introduction
Interventional Radiology offers minimally invasive procedures with less physiologic stress, fewer complications, faster recovery times, and lower morbidity and mortality rates when compared to more traditional surgical approaches. As a result, IRs are increasingly called upon to manage patients with high acuity of illness. As Interventional Radiology evolves, it will be increasingly necessary for IRs to better understand the nuances of nonprocedural patient management, particularly in the critical care setting.
Optimizing intravascular volume status is a key goal in critically ill patients. Hypovolemia can lead to hypotension, organ hypoperfusion, and shock, while volume overload can cause organ dysfunction through venous congestion. Venous congestion is most commonly recognized when volume overload overwhelms the Frank-Starling mechanism of the heart, leading to poor ventricular output and resulting venous hypertension in the pulmonary, systemic, and portal venous systems. If venous hypertension is not adequately compensated for, interstitial edema and a decrease in transcapillary arteriovenous pressure gradient can occur, both of which decrease oxygen delivery to end-organs and ultimately cause organ dysfunction.
Accurately assessing intravascular volume status is notoriously difficult—several indirect assessments are traditionally used, including physical exam findings, hemodynamic measurements, laboratory values, and imaging, although all have significant limitations and inconsistencies when used in isolation.
Recently, point-of-care ultrasound imaging methods for volume assessment have risen in popularity by providing cheap, fast, and objective evaluations. Common techniques include measurement of collapsibility of the inferior vena cava (IVC) with respiration, lung ultrasound to detect pulmonary edema, abdominal ultrasound to detect ascites, and focused cardiac ultrasound to qualitatively assess filling of the cardiac chambers. Venous Excess Ultrasound (VExUS) is a novel imaging protocol that focuses on detecting the presence and severity of volume overload that may be causing venous congestion in different organ systems. VExUS combines assessment of the IVC, hepatic, portal, and renal veins and provides a score that indicates the severity of overall systemic venous congestion. Identifying the severity of venous congestion can be particularly useful in tailoring fluid and vasopressor therapy for patients in shock, heart failure, acute kidney injury (AKI), and other conditions precipitated by hypervolemia. Here, we summarize traditional methods of assessing intravascular fluid status, review the VExUS protocol, and discuss the utility of VExUS to the clinical practice of IR.
Intravascular Fluid Status Assessment Basics
Traditional components of assessing a patient’s intravascular volume status include history, physical exam, vital signs, and laboratory values. Notably, there is limited data on their sensitivity and specificity in accurately assessing fluid status.
History
Patient histories should note acute and chronic conditions that may influence intravascular or third space fluid balance. These include fluid losses from GI source (diarrhea, vomiting); peripheral edema and venous congestion from heart failure; liver failure and cirrhosis causing ascites and anasarca; AKI or chronic kidney disease causing general fluid overload; and chronic venous disease, post-thrombotic syndrome, or lymphedema causing extremity edema. A thorough medication history should include medications that can precipitate edema (e.g. NSAIDs and gabapentin/pregabalin) or diuretic medications.
Typical signs and symptoms associated with hypovolemia include lethargy, postural dizziness, vomiting, and diarrhea, while those associated with hypervolemia include shortness of breath, peripheral edema, weight gain, and chest pain. As hypovolemia or hypervolemia becomes severe, patients may develop shock-like symptoms, including cool clammy extremities, cyanosis, agitation, and/or altered mental status. ,
Physical Exam and Vital Signs
The physical exam can be used to approximate interstitial and plasma fluid volumes. Skin, mucous membranes, and edema/anasarca can serve as a proxy for interstitial volume, while jugular venous distension and hepatojugular reflux can be a proxy for plasma volume. , Key vitals include weight, heart rate, static and orthostatic blood pressure, respiratory rate, and urine output. Hypovolemia classically manifests with dry skin and mucus membranes, delayed capillary refill, and initial tachycardia with subsequent hypotension. Hypervolemia, if chronic, can manifest with peripheral edema, anasarca, and dyspnea. In the acute setting, however, venous congestion may precipitate heart failure, leading to pulmonary edema and hypotension associated with cardiogenic shock.
Labs
A full review of laboratory values associated with hyper- and hypo-volemia is beyond the scope of this article. Importantly, inadequate oxygen delivery from hypovolemia and venous congestion from hypervolemia can both cause organ dysfunction. Laboratory values that are associated with specific organ function, such as creatinine, transaminases/bilirubin, troponin, and BNP should be monitored. Additionally, biomarkers of overall organ perfusion such as lactate and mixed venous oxygen saturation are useful to track the severity of organ dysfunction that may be caused by hyper- or hypo-volemia. Finally, serum sodium concentration is an indicator of total body water relative to total body sodium – if the hyponatremia is occurring due to relative increase in total body water rather than decrease in total body solutes (i.e., hypervolemic or euvolemic hyponatremia rather than hypovolemic hyponatremia), the serum sodium concentration can be used to track the patient’s hypervolemia.
Imaging
To date, point-of-care imaging methods of assessing volume status have focused primarily on detecting hypovolemia. The most popular of these methods is sonographic evaluation of IVC diameter variation through the respiratory cycle. This method relies on the principle that central venous pressure (CVP) is a reliable proxy for overall intravascular volume status – a high CVP indicates a “full” right atrium, which would then likely result in a plump IVC. In a hypovolemic patient, the IVC would theoretically be smaller in diameter. Additionally, the decrease in intrathoracic pressure on normal spontaneous inspiration leads to collapse of the IVC – in a hypovolemic patient, this collapse will be exaggerated.
There is currently a lack of consensus on technique for sonographic IVC evaluation. The authors prefer imaging from the subxiphoid long-axis view, typically with a low-frequency convex probe (2-5.5 MHz) or a phased array transducer (2-8 MHz). B mode is used to identify the IVC, while M mode is used with a sweep velocity of 25-50 mm/s over at least three respiratory cycles to measure axial diameter under respirophasic variation. The IVC can be evaluated via several locations including the confluence of hepatic veins or 1.5 cm within the IVC and right atrium junction. However, no data yet exists to conclude superiority in one technique or location over another. An IVC diameter greater than 2 cm with no respirophasic variation indicates fluid overload, while respirophasic diameter variation > 50% and diameter less than 1.5 cm indicates hypovolemia.
Other point-of-care ultrasound (POCUS) techniques to assess volume status include focused cardiac ultrasound, where dilated or underfilled/collapsing chambers can be seen to imply hyper- or hypovolemia, abdominal ultrasound to detect ascites, and lung ultrasound to detect pulmonary edema.
VExUS Examination
Background
To overcome the limitations and inaccuracies of existing venous ultrasound techniques and CVP measurements to assess volume status and venous congestion, the Venous Excess Ultrasound (VExUS) protocol was developed by Beaubien-Souligny et al. in 2020. VExUS is a multi-point POCUS evaluation of the venous system that quantifies the severity of systemic venous congestion based on doppler waveform analysis. This was validated in the original study by showing that a higher VExUS score (indicating more severe systemic venous congestion) in patients who had just undergone cardiac surgery was associated with a higher risk of developing AKI. Subsequent research has confirmed an association between VExUS scores and invasive hemodynamic measurements, with higher scores correlating with elevated CVP and cardiac filling pressures.
Equipment and Positioning
An ultrasound machine with pulsed-wave Doppler capability is required. This is available on most cart-based systems but may be lacking in newer hand-held ultrasounds. The curvilinear (3-8 MHz), phased array (2-5 MHz), and linear (7-15 MHz) probes may be used. Choice of probe depends on the available imaging window and depth of vein being imaged. The phased array (sector) probe has a small footprint and low frequencies and is excellent for visualizing deeper hepatic and portal veins through intercostal windows but does not provide high-end resolution. The linear probe provides the best resolution for more superficial targets but has poor penetration and a larger footprint. The curvilinear probe is used in most examinations and has a good mix of penetration and resolution but also has a larger footprint relative to the phased array probe.
Patients are positioned supine with legs bent and abdomen relaxed to image the IVC, hepatic, and portal veins, and may be turned partially decubitus in either direction to allow for improved imaging depending on habitus. The renal veins are typically imaged while prone or in lateral decubitus positioning depending on patient comfort.
Scanning Protocol
- 1.
IVC: The probe is placed in the subxiphoid position and a long axis view of the intrahepatic portion of the IVC within 2 cm of the hepatic vein confluence is obtained. The liver should be superficial, and the right atrium should be on the right-hand side of the screen with probe indicator directed cranially. If the IVC is not well visualized, the probe may be moved laterally to the patient’s right to image the IVC through the hepatic parenchyma. The IVC diameter should be measured at its peak during the respiratory cycle—this is typically done in M-mode. The nadir of the IVC diameter is also measured in M-mode to assess IVC collapsibility.
- 2.
Hepatic vein: With the probe placed over the right upper quadrant in either transverse or longitudinal orientation relative to the liver, the hepatic veins should be visualized close to their confluence with the IVC. Typically, the right and middle hepatic veins are easier to visualize than the left hepatic vein. Color and pulsed-wave Doppler should confirm blood traveling away from the probe and into the IVC. The pulsed-wave Doppler gate should be placed on the hepatic vein that is best visualized near the confluence with the IVC to assess the pattern of flow through the vein. The morphology of the flow velocity waveforms during systole (S wave) and diastole (D wave) are noted.
- 3.
Portal vein: The probe is placed at the right mid-axillary line and the right portal vein is identified arising from the main portal vein and coursing into the right hepatic lobe. Color and pulsed-wave Doppler should confirm flow towards the probe (hepatopetal flow). Notably, patients with cirrhosis or portal vein thrombosis/stenosis may have absent or reversed flow in the portal vein (hepatofugal flow). Pulsed-wave Doppler imaging is performed with gate placed on the right portal vein, with special attention paid to the pulsatile variation in the waveform.
- 4.
Renal vein: Imaging is typically obtained with the patient in the prone position and probe placed at the posterior axillary line. Using color doppler, the main renal artery and vein are traced to the corticomedullary junction, where the interlobar vessels are identified. Pulsed-wave Doppler gate is placed on any visualized interlobar vessel – since the arteries and veins run very closely together at this level, arterial and venous waveforms may be seen simultaneously. Note is made of the venous waveform during systole and diastole.
Interpretation
Interpretation of the VExUS examination begins with the IVC – if the maximum IVC diameter is less than 2 cm, the examination is considered negative (Grade 0), indicating absence of systemic venous congestion. If IVC maximum diameter is greater than 2 cm, the hepatic, portal, and renal venous pulsed-wave Doppler waveforms are analyzed and classified as normal, mildly abnormal, or severely abnormal. These results are then combined to assign a score using a validated grading system, which indicates the severity of systemic venous congestion (Grades 1-3). ,
Evaluation of each organ system venous waveform is as follows:
- 1.
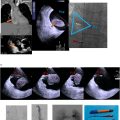
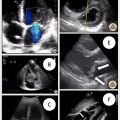
Hepatic vein ( Fig. 1 ): A normal waveform consists of a systolic (S) wave traveling away from the probe and a smaller, diastolic (D) wave also traveling away from the probe. When the S wave maintains normal flow direction but has a smaller amplitude than the D wave, this is a mild abnormality, while reversal of the S wave indicates severe abnormality.

Related posts:
 Intravascular Ultrasound: A Review of Radial and Side Firing IVUS
 Transvenous biopsy of abdominal-pelvic lesions with no safe percutaneous access: How we do it
 Central Venous Recanalization and Right Atrial Thrombectomy Using IVUS
 Transcaval endoleak embolization using intravascular ultrasound: A step-by-step guide
 Focused Cardiac Ultrasound for Rapid Hemodynamic Assessment: A Primer for Vascular and Interventional Radiologists
 Uterine Fibroid Embolization

Stay updated, free articles. Join our Telegram channel

Full access? Get Clinical Tree


