Abstract
This chapter includes the physiology, radiopharmaceuticals, and techniques used for nuclear medicine imaging of the kidneys, ureters, bladder, and adrenal glands. Indications for the examinations are presented, as well as normal and abnormal image interpretation for most clinical problems.
Keywords
radiopharmaceuticals, functional renography, renal cortical imaging, diuretic renography, obstructive uropathy, renal artery stenosis, acute tubular necrosis, adrenal imaging
Chapter Outline
Clinical Applications of Renal Imaging
Angiotensin-Converting Enzyme Inhibitor (Captopril) Renography
Acute Pyelonephritis and Cortical Scar
Radionuclide evaluation of the genitourinary system includes quantitative estimates of renal perfusion and function. With the widespread use of magnetic resonance imaging (MRI), computed tomography (CT), angiography, and Doppler ultrasound, the evaluation of renal anatomy by nuclear techniques has diminished, and the role of nuclear renal imaging has become more confined to functional analysis. Indications for radionuclide scanning include assessment of renal blood flow and differential or quantitative functional assessment of both native and transplanted kidneys, as well as the unavailability of or contraindications to MRI or CT (including sensitivity to contrast materials). Nuclear techniques have also proved valuable in evaluating ureteral or renal pelvic obstruction, vesicoureteral reflux, and to a lesser extent, suspected renovascular hypertension, with pharmacologic interventions used when indicated. Imaging of genitourinary cancers with positron emission tomography (PET) scanning is discussed in Chapter 11 . Osseous metastases from prostate cancer are discussed in Chapter 8 .
Physiology
The excretory function of the kidneys consists of two primary mechanisms: passive filtration through the glomeruli and active secretion by the tubules. These processes are tempered by the varying reabsorption of certain substances by the tubules. Twenty percent of renal plasma flow is cleared by glomerular filtration and 80% by tubular secretion. The glomerulus acts as a semipermeable membrane, allowing only those compounds of a relatively small molecular size to pass through. Larger materials, such as proteins, do not pass through the glomerulus but may reach the urine by tubular secretion.
Radiopharmaceuticals
Radiopharmaceuticals commonly used for evaluating renal function and anatomy fall into three main categories:
- •
Those excreted by tubular secretion
- •
Those excreted by glomerular filtration
- •
Those bound in the renal tubules for a sufficiently long time to permit cortical anatomic imaging.
Glomerular Filtration Agents
Technetium-99m ( 99m Tc) diethylenetriamine pentaacetic acid (DTPA) is the only imaging radiopharmaceutical used for the evaluation of glomerular filtration function. As the DTPA complex is cleared by the renal glomeruli, serial images may be obtained that demonstrate sequential visualization of the kidneys and collecting systems, ureters, and bladder. Measurement of its excretion can also provide an accurate estimate of the glomerular filtration rate (GFR). The normal GFR is 125 mL/min. Because a small amount (≈ 5% to 10%) of injected DTPA is bound to plasma proteins, it tends to underestimate the GFR slightly. For routine clinical applications, however, this is generally not significant. About 20% of 99m Tc-DTPA is extracted from the blood with each pass through the kidney (extraction fraction), so that about 90% of DTPA is filtered by simple exchange or diffusion into the urine within 4 hours. This makes it an inexpensive agent for renal imaging. Because the nephrogram phase of the examination is brief, however, it is not an ideal agent for demonstrating intraparenchymal renal lesions. In addition, it may not be the agent of choice in patients with obstruction or impaired renal function in whom tubular agents with higher extraction efficiencies allow for increased excretion and better renal visualization. For 99m Tc-DTPA, the normally administered activity for adults is about 10 mCi (370 MBq) or less.
Tubular Secretion Agents
Technetium-99m–labeled agent mercaptoacetyltriglycine (mertiatide or MAG3) is protein bound and is cleared predominantly by the proximal tubules (95%) with minimal filtration (less than 5%). With an extraction fraction of 40% to 50% (more than twice that of 99m Tc-DTPA), it provides more satisfactory images than does 99m Tc-DTPA, especially in patients with obstruction or impaired renal function. The clearance of MAG3 by the kidneys, when used with a correction factor, can be used to measure effective renal plasma flow (ERPF). For 99m Tc-MAG3, the typical administered activity for adults is about 10 mCi (370 MBq) or less. In pediatric patients, doses should be individually calculated for each patient.
Renal Cortical Agents
The two radiopharmaceuticals used for visualization of the renal parenchyma are 99m Tc-dimercaptosuccinic acid (DMSA) and, to a lesser extent, 99m Tc-glucoheptonate. Both of these agents bind sufficiently to the renal tubules to permit renal cortical imaging.
Technetium-99m DMSA is an excellent cortical imaging agent, with about 40% of the injected dose concentrated in the renal cortex at 6 hours and the remainder being slowly excreted. DMSA is of particular value when high-resolution images of the renal cortex are needed, and when there is no need to identify abnormalities in the ureters or bladder because these structures are not effectively imaged. DMSA localizes by binding to the sulfhydryl groups in the proximal renal tubules. Only 10% of the radiopharmaceutical is excreted in the urine during the first several hours. The radiopharmaceutical activity normally used is 1 to 5 mCi (37 to 185 MBq). The radiation dose to the kidneys with DMSA is high because there is a long, effective half-life of the radiopharmaceutical in the kidneys. Another disadvantage of 99m Tc-DMSA is its short shelf life after preparation. In addition, because of its slow clearance rate, delayed images 1 to 3 hours after injection are frequently necessary in patients with poor renal function to allow for improved kidney-to-background ratios.
Technetium-99m glucoheptonate is a radiolabeled carbohydrate cleared by the kidneys both by glomerular filtration and by the renal tubules. Thus early images permit the assessment of renal perfusion, as well as evaluation of the renal collecting systems and ureters. Early images demonstrate the renal cortex and the collecting system, although the renal cortex remains well visualized 2 to 4 hours after administration. Ten to fifteen percent of the injected dose remains bound to the renal tubules, and 40% is cleared through the urine at 1 hour. Thus 1- to 2-hour images permit excellent visualization of the renal cortex. Technetium-99m glucoheptonate is stable and may be used for up to 5 hours after preparation. The usual adult administered activity is 8 mCi (296 MBq).
Radionuclide Renal Evaluation
Evaluation of the kidneys with radiopharmaceuticals may be performed by using a variety of methods, each providing a slightly different approach to the assessment of renal function or anatomy. These methods include the following:
- •
Functional imaging (visual assessment of perfusion and function)
- •
Renography (time-activity curves representative of function)
- •
Quantification of renal function (GFR and ERPF determinations)
- •
Anatomic imaging (visual assessment of the renal cortex).
Functional Renal Imaging
Radionuclide imaging with 99m Tc-labeled agents provides anatomic, functional, and collecting system patency information. Imaging may be adequately performed in most patients by using either 99m Tc-MAG3 or 99m Tc-DTPA.
For convenience of interpretation and reporting, functional imaging of the kidneys may be divided into three phases: blood flow, parenchymal uptake and excretion, and collecting system patency. Normally, both kidneys can easily be imaged on a standard or large field-of-view gamma camera with a parallel-hole collimator. Image information is usually collected in digital dynamic mode or on an interfaced computer and reformatted in temporal sequences that reflect both initial renal perfusion and subsequent function.
Renal Perfusion Phase
Evaluation of renal blood flow and function of native kidneys is performed from the posterior projection, whereas the evaluation of transplant blood flow and function is performed from the anterior projection. Normally, a small bolus of high-activity (10 mCi [370 MBq]) 99m Tc-labeled radiopharmaceutical ( 99m Tc-DTPA or 99m Tc-MAG3) is injected intravenously, preferably into a large antecubital vein. Imaging renal perfusion is usually begun as the bolus is visualized in the proximal abdominal aorta, with subsequent serial images made every 1 to 5 seconds, depending on the instrumentation available and the preferences of the interpreter. A typical renal blood flow study is seen in Fig. 9.1 . The activity reaches the kidneys about 1 second after the bolus in the abdominal aorta passes the renal arteries. Time-activity curves reflecting renal perfusion during the first minute may be generated by drawing regions of interest over the aorta and each kidney. Each of the renal curves may then be compared with the time-activity curve of the abdominal aorta to assess relative renal perfusion. Occasionally, the spleen overlies the left kidney, giving a false impression of asymmetrically increased left renal perfusion or of a “phantom kidney” in patients with prior left nephrectomy. With the exception of renal transplant evaluation, the renal perfusion phase is thought by some to contribute the least to functional assessment and may be omitted as appropriate, allowing smaller administered activity to be used and reducing patient radiation dose.

Renal Parenchymal Function Phase
Renal parenchymal function imaging consists of dynamic or sequential static acquisition of 3- to 5-minute 99m Tc-DTPA or 99m Tc-MAG3 ( Fig. 9.2 ) images over 20 to 30 minutes. Image evaluation includes attention to renal anatomy and position and adequacy of function gauged by parenchymal uptake and initial clearance, including relative renal symmetry. These are assessed both visually and by inspection of time-activity (renogram) curves generated from regions of interest placed over the cortex of each kidney, as discussed below. With 99m Tc-MAG3, the maximal parenchymal activity is seen at 3 to 5 minutes, with activity usually appearing in the collecting system and bladder by about 4 to 8 minutes.

Collecting System Phase
Overlapping with the excretion phase of the study, assessment of collecting system patency is an integral part of overall urinary functional assessment. Some laboratories routinely administer the diuretic furosemide (Lasix) to facilitate transit of activity from the renal pelvis and ureters to the bladder and to exclude any significant mechanical obstruction. Postvoid or postambulation images to enhance collecting system drainage may also be obtained as needed.
Renography
A renogram is simply a time-activity curve that provides a graphic representation of the uptake and excretion of a radiopharmaceutical by the kidneys. The classic renogram curve is obtained using agents that are eliminated by tubular secretion (e.g., 99m Tc-MAG3). Information is displayed from the time of injection to about 20 to 30 minutes after injection. Renogram curves are generated by placing a region of interest around the whole kidney, or sometimes just around the renal cortex, excluding collecting system activity. Background subtraction regions of interest are selected just inferior to each kidney ( Fig. 9.3 ). An aortic region of interest may be used to assess the discreteness and adequacy of the injected bolus, as well as relative renal perfusion.

The normal computer-generated renogram curve using a tubular radiopharmaceutical consists of three phases ( Fig. 9.4 ). Initial renal perfusion, or the vascular transit phase, lasts about 30 to 60 seconds and represents the initial arrival of the radiopharmaceutical in each kidney. Reconstruction of the first 30 to 60 seconds of the curve by scaling the graphical axes differently from the parenchymal phase allows more accurate assessment of the renal perfusion phase. Generally, renal peak activity during the perfusion phase equals or exceeds that of the aorta and should be reasonably symmetric between the two kidneys. The second phase is the cortical or tubular concentration phase of initial parenchymal transit. This phase occurs during minutes 1 through 5 and contains the peak of the curve. The initial uptake slope closely correlates with ERPF values. The third phase is the clearance or excretion phase, which represents the down slope of the curve and is produced by excretion of the radiopharmaceutical from the kidney and clearance from the collecting system.

Patients should be well hydrated when renography is performed because in the presence of dehydration an abnormal renogram curve demonstrating delayed peak activity, delayed parenchymal clearance, and/or an elevation of the excretion slope may occur.
Overall, the renogram curves for each kidney should be reasonably symmetric, although slight asymmetries are not unusual. The shapes of curves should also be inspected individually for alterations in the normal configuration. Semiquantitative indices derived from the curves may be helpful in this respect. Data commonly derived from 99m Tc-MAG3 renograms and normal values are shown in Box 9.1
- •
Time to peak activity (Tmax). Normal is by 5 minutes after injection.
- •
Relative renal uptake ratios at 2 to 3 minutes. This is an index of relative renal function between the two kidneys. Activity in each kidney should be equal, ideally 50%. A value of 40% or less in one kidney should be considered abnormal. If cortical regions of interest are used and are not of equal size, the ratio can be inaccurate.
- •
Half-time excretion (T
 ) is the time for half of the peak activity to be cleared from the kidney. Normal is by 15 minutes after injection.
- •
Differential cortical retention at 15 minutes. The percentage of retained activity about 15 minutes after injection in each kidney should be relatively equal. Differences of 20% or more should be considered abnormal.
- •
The 20 minute-to-peak count ratio (20 min/maximum count ratio). This is the activity measured in each kidney at 20 minutes and expressed as a percentage of peak curve activity and is often measured for whole kidney and cortical regions of interest. As renal function deteriorates, delayed transit of the radiopharmaceutical in the kidney results in an abnormal renogram curve, which can be quantitated by using this index. In the absence of pelvic calyceal retention, or if only a cortical region of interest is used, a normal 20-minute maximal cortical ratio for 99m Tc-MAG3 averages 0.19 (standard deviation 0.07 and 0.04 for the right and left kidneys). If the patient is not dehydrated, a ratio more than 0.35 (35%) is likely due to abnormal renal function.
Quantitation of Renal Function
Quantitative assessment of renal function using radionuclide techniques is an important part of nuclear nephrology and is routinely performed in some clinical settings. Because up to half of renal function, including GFR, may be lost before serum creatinine levels become abnormal, direct measurement of GFR and ERPF using radiopharmaceuticals plays an important role in the assessment of renal function.
The classic measures of renal function involve the ability of the kidneys to clear certain substances from the plasma. These so-called clearances are expressed as volume of plasma cleared of a particular substance per minute (mL/min) as the plasma passes through the kidneys. The significance of the clearance depends on the substance used. The clearance of insulin, which is entirely filtered, defines the GFR, and the clearance of para-aminohippurate (PAH), which is both filtered and secreted by the tubules, defines renal plasma flow. The radiopharmaceutical analogs for calculation of these clearances are the totally filtered radiopharmaceutical 99m Tc-DTPA for insulin clearance and GFR estimation, and 99m Tc-MAG3, which is primarily secreted by the tubules, for PAH clearance and ERPF. The latter index is termed effective because the radiopharmaceuticals used closely estimate, but do not equal, the PAH clearance.
Two dominant radionuclide methods of determining GFR and ERPF are used: (1) plasma sample-based clearances, which are more tedious but more accurate, and (2) camera-based clearances, which do not require sampling of plasma or urine.
Plasma Sample-Based Clearances
These measurements are generally obtained by determining the plasma levels of the injected radiopharmaceutical at a specified time, although some techniques require urine collection as well. For tubular agents such as 99m Tc-MAG3, ERPF can be estimated by a single, timed blood sample obtained about 45 minutes after injection. Because the glomerular agent 99m Tc-DTPA is cleared more slowly than are tubular agents, plasma samples are obtained 60 and 180 minutes after injection. The amount of activity remaining in the blood at these times is a measurement of activity not yet cleared by the renal mechanism and therefore is indirectly a measure of activity already cleared. These techniques require meticulous attention to detail and personnel expertly trained in in vitro techniques. When performed correctly, GFR and ERPF measurements are theoretically more accurate than are those based on camera measurements.
Camera-Based Clearances
State-of-the-art gamma cameras and computers have allowed the development of methods for estimating GFR and ERPF without collecting blood or urine samples. Commonly, calculations are made by using counts acquired from the syringe containing the radiopharmaceutical before injection and subsequent counts over the kidneys after injection. Commercially available software for camera-based clearances simplifies corrections for patient and acquisition variables and provides reasonably accurate computer-derived clearance values. Although camera-based clearances are not as accurate as are those based on plasma samples, they are highly reproducible and sufficiently reliable to be used in clinical practice.
A renal functional measurement expressed simply as MAG3 clearance, without a need for corrections to estimate ERPF, is available using both single plasma sample-based and camera-based techniques. MAG3 clearance may be used to follow the course of renal disease and has proved useful in individual laboratories in which its own range of normal values can be determined. Both MAG3 clearance and GFR determination are as useful and accurate measurements of renal function as is creatinine clearance.
Anatomic (Cortical) Imaging
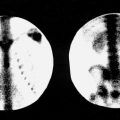
Renal cortical imaging is usually performed for the evaluation of space-occupying lesions, functioning pseudotumors such as cortical columns of Bertin ( Fig. 9.5 ), or edema or scarring associated with acute or chronic pyelonephritis, especially in children. These images of the renal cortex are generally taken by using 99m Tc-DMSA or glucoheptonate and by using a pinhole or high-resolution collimator, or single-photon emission computed tomography (SPECT).

Clinical Applications of Renal Imaging
Diffuse Renal Disease
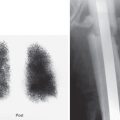
In the evaluation of diffuse renal diseases producing acute or chronic impairment of renal function, such as acute pyelonephritis or chronic glomerulonephritis, radionuclide techniques are often sensitive but not disease specific. Most often, there is simply demonstration of unilaterally or bilaterally poor vascular perfusion and poor radiopharmaceutical excretion ( Fig. 9.6 ). The renogram provides quantitative estimates of the function of each kidney, information that is not easily obtained by other methods. Generally, poor renal function results in flattening of the renogram curve as concentration and excretion of the radiopharmaceutical become increasingly impaired.

In patients with acute tubular necrosis (ATN), there may be normal or only modestly reduced renal perfusion and preserved parenchymal accumulation but bilaterally poor excretion of 99m Tc-MAG3 ( Fig. 9.7 ). This frequently presents as bilateral persistent nephrograms with rising renogram curves. Because this pattern may be mimicked by dehydration, ensuring adequate patient hydration is essential when ATN is suspected. Reasonably good visualization of the kidneys indicates a favorable prognostic outcome, whereas poor visualization correlates with a prolonged or absent recovery.


Related posts:

Stay updated, free articles. Join our Telegram channel

Full access? Get Clinical Tree


