Abstract
Objective
Our study aims to quantitatively determine the concavity of the glenoid articular surface in patients with hypermobile shoulders compared to those without.
Method
We examined medical records of shoulder CTs from 2017 to 2022, selecting 50 patients with clinical signs of joint hypermobility for our case group and 54 for our control group. Two blinded readers independently assessed the glenoid morphology, calculating the glenoid concavity angle (GCA) and evaluating the articular surface shape as concave, flat, or convex. They also recorded the presence and severity of glenoid dysplasia. We compared these assessments between groups.
Results
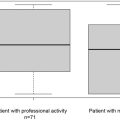
The mean GCA was significantly lower in the hypermobile group (2.3 ± 3.7° and 2.3 ± 3.8°) versus controls (6.6 ± 3.3° and 5.3 ± 3.8°) ( P < 0.05). Interobserver reproducibility was high (ICC=0.76). A stark difference in glenoid morphology was noted between groups ( P < 0.001), with a majority of hypermobile patients having a flat or convex glenoid. GCAs decreased with increasing shoulder laxity and dysplasia. GCA showed 77–81 % sensitivity and 55–82 % specificity for detecting shoulder hyperlaxity with a 4° cutoff.
Conclusion
There is a significant association between GCA and shoulder hyperlaxity, demonstrating diagnostic efficacy and substantial interobserver agreement.
Clinical Relevance
GCA values lower than 4° warrant further clinical investigation for shoulder hyperlaxity and associated conditions, which is crucial for patient treatment planning.
Key points
- •
Shoulder hyperlaxity is underdiagnosed with potential implications in patient care.
- •
The glenoid concavity is significantly smaller in hypermobile shoulders.
- •
The glenoid concavity angle has a good diagnostic performance for hyperlaxity.
- •
Low glenoid concavity angles (< 4°) should warrant a search for shoulder hyperlaxity.
1
Introduction
Hyperlaxity or hypermobility is a common condition defined by an increased joint range of motion and distractibility a condition termed benign joint hypermobility syndrome (BJHS) [ ]. The clinical diagnosis of BJHS is based on the Beighton score, but shoulder hypermobility is not always associated with this syndrome [ ]. Patients with hypermobile shoulders tend to have an increased risk of sport-related injury and have an increased frequency of labroligamentous lesions associated with increased humeral head translation and recurrent subluxation/luxation [ ]. There is also an increase in recurrence rates after glenohumeral instability repair in these patients [ ]. Shoulder hypermobility has been linked to various conditions such as unidirectional or multidirectional instability, glenoid dysplasia, and rotator cuff impingement being an important factor in the surgical decision-making process [ , , ]. Shoulder hypermobility may also influence imaging acquisition protocols (e.g., abduction and external rotation – ABER sequences, arthrography, etc.) and the interpretation of shoulder MRI and CT arthrography studies.
The clinical diagnosis of shoulder hypermobility is based on various well-documented clinical tests such as the sulcus sign, drawer test, shoulder external rotation over 85°, and hyperabduction tests [ , ]. However, when the clinical scenario is not suggestive or physicians are not sufficiently aware of the importance of this condition, shoulder hyperlaxity may be overlooked as there are no clear diagnostic criteria in conventional imaging studies. When arthrography is performed in the ABER position, imaging signs assessing capsular redundancy and laxity have been described and shown to be correlated with patients with multidirectional glenohumeral instability [ ]. However, information on capsular morphology and other imaging findings in the presence of shoulder hypermobility is scarce. Quantitative imaging criteria could improve the identification and grading of glenohumeral hypermobility with potential surgical implications in addition to preventing interpretation and lesion identification errors when clinical hyperlaxity signs are unknown to the radiologist.
Glenohumeral hypermobility may influence the morphology of the glenoid as a reduced tension generated by capsular structures could lead to changes in the compression force of the humeral head to the glenoid [ , ]. This could explain differences in the morphology and version of the glenoid bone. We hypothesize there is a difference in the glenoid articular surface concavity in patients with and without shoulder hypermobility diagnosed clinically. This information could be useful for the diagnosis of hypermobility-associated injuries in patients without a prior diagnosis of shoulder hypermobility with potential clinical and acquisition protocol implications.
2
Materials and methods
2.1
Population
This study followed the STrengthening of the Reporting of OBservational studies in Epidemiology (STROBE) guidelines. From January 2017 to June 2021, shoulder CT and CT-arthrography study reports of 4269 patients acquired in our institution were reviewed retrospectively. These patients had been referred for the evaluation of shoulder pain. CT study reports were searched for the terms “hyperlaxity”, and “hypermobility” and derived words. Then based on this pre-search, the patient’s medical records were reviewed for clinical signs of shoulder hyperlaxity. After this process, 50 patients with well-documented clinical signs of shoulder hyperlaxity evaluated by an orthopedic surgeon or by an examination performed by a radiologist from our center were selected and composed the hyperlax group. Glenohumeral hyperlaxity was defined by the presence of both of the following criteria: the presence of a sulcus sign (e.g., subacromial skin depression when downward traction is applied to the elbow of the patient with the arm relaxed to the side of the patient) and passive shoulder abduction range over 90° (e.g., evaluated with the elbow flexed and arm at the side of the patient) [ , ].
The medical records of patients with a normally appearing shoulder CT-arthrography were reviewed to confirm the absence of shoulder instability, hyperlaxity, and morphologic humeral changes. All of the included patients had a clear statements in their medical records stating a negative clinical exam regarding hypermobility and instability.
Following this procedure, a control group of 54 patients was formed. Thus, the final study population was composed of 104 patients. CT-arthrography was available for 86 patients and 18 had only conventional CT images available.
Patients with major glenohumeral degenerative joint disease, prior shoulder surgery, or fractures affecting the glenoid articular surface morphology were excluded. Patients with missing or incomplete medical records were not included.
In our institution, retrospective studies with anonymized data analysis do not require ethics committee approval (institutional review board waived).
2.2
Image acquisition technique
CT was performed on 320-detector row CT scanners (Aquilion ONE and Aquilion Precision Canon Medical Systems, Otawara, Japan). Intra-articular contrast injection (Iodixanol, Visipaque 270 mg, GE Healthcare) was performed by a radiologist under fluoroscopic guidance. A rotator interval anterior approach was used and 8–12 ml of undiluted contrast medium was injected. Images were acquired with either a helical or volume mode with the patient supine and the shoulder in neutral position using the following parameters: FOV 180 mm, 520 × 520–1024 × 1024 matrix, 120 or 135 kVp depending on the patient’s body habitus, 200–250 mA (150–187,5mAs effective), slice thickness 0.25–0.5 mm and tube rotation time 0.75 s. Iterative reconstruction with a bone kernel was systematically used. CT was performed within 30 min after intra-articular contrast injection.
Anteroposterior shoulder radiographs were available for all patients.
2.3
Data analysis and post-processing
CT images from all patients were randomly displayed and independently analyzed by two radiologists with three and six years of clinical experience with musculoskeletal imaging blind to the presence of shoulder hyperlaxity on a picture archive and communication system workstation (PACS Carestream v11.4, Carestream Health, USA).
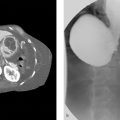
Glenoid morphology was evaluated on an oblique axial image, orthogonal to the vertical axis of the glenoid, showing the largest diameter of the glenoid. Sagittal and coronal oblique reformats (thickness 0.5 mm) parallel to the glenoid plane were used to confirm the level of the glenoid’s largest diameter. The morphology of the glenoid articular surface was subjectively evaluated and classified as concave, flat, or convex. In concave glenoid the center of the glene was deeper than the articular rims, it was at their level in flat glenoid articular surfaces and above in concave glenoid ( Fig. 1 ).

The glenoid concavity, related to circumference and depth, was evaluated by measuring the angle between a line drawn between the anterior and posterior articular rims and another drawn between the anterior articular rim and the center of the glenoid, termed the glenoid concavity angle (GCA) [ ] ( Fig. 2 ). We utilized the largest diameter of the glenoid for this measurement, given that it typically corresponds to the area of maximum glenoid concavity. For the positioning of markers, we opted for the bony articular rims. This choice was motivated by their ease of identification in CT scans and their relatively lower morphologic variation compared to cartilage and labral tissue. However, in case of bone changes in the anterior or posterior articular rim such as osteophytes, these were not taken in consideration when placing the landmarks.

The morphology of the posterior glenoid rim was also evaluated at the level of the greatest diameter of the glenoid and was graded according to Harper et al.: no dysplasia (symmetric morphology between the anterior and posterior glenoid articular rims and labrum); mild (mild truncation of the posterior glenoid rim with a normal appearance of the labrum); moderate or severe (moderate or severe truncation of the posterior glenoid rim with a posterior tilt of the glenoid surface and a thickened posterior labrum) ( Fig. 3 ) [ ].

The critical shoulder angle (CSA) was also assessed as it is an indicator of the deltoid force vector on the glenoid articular surface [ ]. The CSA is measured between the superior and inferior bone margin of the glenoid and the most inferolateral border of the acromion on anteroposterior shoulder radiographs.
2.4
Statistics
Statistical analysis was performed with the Jamovi software (version 2.3, 2022). Quantitative variables were presented as mean ± standard deviation (range). The Student’s t -test was used to assess the variation of the GCA between patients with and without joint hyperlaxity. The ANOVA test was used to assess the association of the GCA with joint laxity and glenoid dysplasia. A P value of 0.05 was considered as the threshold of statistical significance. GCA interobserver variability was evaluated using the Shrout and Fleiss intraclass correlation coefficient (ICC) while kappa values were calculated to assess the interobserver variability for the diagnosis of glenoid dysplasia. Kappa and ICC values of 0 – 0.20 were considered to represent a slight agreement, 0.21 – 0.40 fair agreement, 0.41 – 0.60 moderate agreement, 0.61 – 0.80 substantial agreement, and 0.81 – 1 excellent agreement (33). Receiver operating characteristics curves (ROC) were generated, using the tools MedCalc® Statistical Software version 22.030 (MedCalc Software Ltd, Ostend, Belgium; https://www.medcalc.org ; 2024), to evaluate the diagnostic performance of GCA values for the diagnosis of shoulder hyperlaxity. The cutoff values were selected using the smallest squared distance from the perfect classifier using the following equation: (1-Se)²+(1-Sp)².
3
Results
3.1
Population
The demographic characteristics of the study population in the hyperlax and control groups are presented in Table 1 . The mean age was significantly higher in the control group ( P < 0.0001). There was no significant difference in the sex ratio between the two groups ( P = 0.70) There was no significant variation between CSA values between patients with and without shoulder hyperlaxity ( P = 0.41). Mean CSA values were 32.8 ± 3.5 (19.9;37.5)° and 32.4 ± 3.2 (25.6;38.1)° in these groups, respectively. Glenoid dysplasia was identified in 32 (22 in the hyperlaxity group and 10 in the control group) by reader 1, and 32 (21 in the hyperlaxity group and 11 in the control group) by reader 2. The interobserver variability for the diagnosis of glenoid dysplasia was considered moderate (kappa = 0.41). Table 2 shows the distribution of all evaluated parameters in the study population.
Related posts:
 Efficacity of CT-guided intra-articular cervical facet steroid injection for cervical radiculopathy
 Uterine Fibroid Embolization
 Anesthetic Care for Interventional Neuroradiological Procedures
 Migrated Superior Vena Cava Stent Repositioned Using a Balloon and Loop Snare Combination
 Part 1 Preprocedural Cases
 25 Islet Cell Transplantation
Stay updated, free articles. Join our Telegram channel

Full access? Get Clinical Tree


