Abstract
Objective
Blood flow imaging and perfusion assessment of the hepatic portal vein are critical for the diagnosis of several liver diseases, including cirrhosis, primary and metastatic liver tumors. However, perfusion imaging of the portal vein is challenging due to the unique dual blood supply system of the liver.
Methods
We developed a novel method for specific perfusion imaging of the portal vein and downstream vessels, which was validated on healthy mice (n = 4). The right lobe of the liver in healthy mice was sequentially imaged using ultrafast plane-wave Doppler imaging and vascular labeling. In each experiment, mice were first injected with phase-change nanodroplets (PCNDs), followed immediately by ultrafast Doppler imaging to determine the imaging section and locate portal vein branches. Through an interactive process, portal vein branches were selected by mouse click for data acquisition of vessel-labeling ultrasound (VLUS) based on PCNDs. Subsequent arrival time calculations and super-resolution ultrasound (SRUS) imaging were performed offline. To demonstrate the specificity of the proposed method for vascular imaging, one mouse was injected with Sonovue microbubbles for plane-wave ultrasound data acquisition and microbubble-based VLUS data acquisition. All imaging experiments were conducted on the Verasonics (Kirkland, WA, USA) Vantage 256 ultrasound system using an L22-8v linear array transducer with a center frequency of 15.625 MHz. The multi-angle coherent compounding plane-wave acquisition frame rate was 500 Hz.
Results
Imaging results from healthy mice (n = 4) demonstrated that VLUS was able to label different branches of the hepatic portal vein and specifically image downstream vessels. Analysis of the in vivo results at different spatial scales showed that the brightness of the downstream perfusion area was significantly enhanced after labeling started, while there was no significant difference in image brightness before the labeling started and after it ended. By analyzing the acoustic field distribution at the focal point, the full width at half maximum in the x 1 and z 1 directions were 98.56 μm and 526.68 μm, respectively. Along the propagation path of the focused beam (outside the labeling area), no significant activation of the PCNDs was observed ( p < 0.0001). Combined with SRUS technology, the resolution of the VLUS portal vein imaging results was further enhanced. The time-intensity curves of the downstream regions of interest indicated that VLUS provided a step input signal to the downstream vessels. Based on the arrival time of the step point in the time-intensity curves, the arrival time distribution map of the downstream vessels relative to the labeling point could be calculated.
Conclusion
We propose a novel method for hepatic portal vein perfusion imaging based on VLUS. In vivo experiments, simulation results and statistical analysis demonstrate that this method is able to accurately label portal vein vessels with millimeter-level precision, enabling specific high-resolution imaging and precise, non-invasive measurement of the downstream perfusion area. By combining VLUS with SRUS technology, the resolution of the portal vein imaging results can be further enhanced.
Introduction
Blood flow imaging and perfusion assessment of the hepatic portal vein are critical for the diagnosis of liver-related diseases. Although the underlying pathogenic mechanisms of several diseases such as cirrhosis and primary and metastatic liver tumors vary, they result in decreased portal venous blood flow and increased hepatic artery blood flow, causing changes in global or regional hepatic perfusion [ ].
However, there is a problem with the current dynamic contrast-enhanced imaging technologies used for liver perfusion assessment; that is, hepatic artery perfusion images interfere with portal vein perfusion analysis, thus reducing its diagnostic value [ ]. This is mainly due to the unique dual blood supply system of the liver. Therefore, during dynamic contrast-enhanced imaging, the time-intensity curves (TICs) obtained from liver tissue reflect the superposition of portal vein and hepatic artery blood flow information. The common clinical model of the liver comprises three different phases of enhancement: the arterial phase, the portal phase and the delayed phase. However, they overlap with each other on the timeline and cannot be evaluated as relatively separate phases. This is a key challenge in portal vein perfusion imaging. Therefore, a specific method that can separate the hepatic artery and portal vein blood flow components is urgently needed for liver perfusion image analysis and diagnosis of various liver diseases.
The primary goal of perfusion imaging of the liver is to enable resolution of arterial and portal venous blood flow components on a global and regional basis, thereby improving the sensitivity and specificity of identifying liver diseases [ ]. Currently, the main imaging methods used for hepatic perfusion imaging include isotopic imaging, ultrasound (US), computed tomography (CT) and magnetic resonance imaging [ ]. Among them, CT is considered the gold standard for portal venous perfusion imaging. CT perfusion (CTP) imaging separates portal vein and hepatic artery blood flow components through three methods (the model-free maximum slope method, compartment model-based method and distributed parameter model-based method) and then calculates various perfusion parameters in liver tissue [ , ]. In addition, US is increasingly used for hepatic perfusion imaging due to its non-invasive, lack of radiation and high spatiotemporal resolution advantages. In early US examinations, the Doppler Perfusion Index was used to evaluate changes in the global perfusion of the liver [ ]. However, perfusion assessment of local areas of the liver remains challenging because this technique can only measure blood flow in large vessels. In order to solve this problem, Lueck et al. introduced factor analysis to extract the portal vein and hepatic artery perfusion components of local areas of the liver from the contrast-enhanced ultrasound (CEUS) imaging modality [ ].
The digital separation methods of liver phases, represented by CTP and factor analysis of CEUS, require intravenous injection of a contrast agent first, dynamic collection of imaging results and then using specific methods to indirectly extract the perfusion component of the portal vein. Although these methods have made some progress in extracting portal venous perfusion components, due to the dual blood supply system of the liver, the problem of overlapping arterial, portal and delayed phases still cannot be solved, which limits accurate extraction of the portal venous perfusion component by digital separation methods of liver phases and analysis of portal venous perfusion still suffers hepatic arterial perfusion interference.
Compared with methods such as CTP and factor analysis of CEUS, another type of liver phase separation, CT during arterial portography (CTAP), is able to more directly extract the perfusion component of the portal vein. CTAP specifically enhances the portal vein by infusing iodinated contrast material into the superior mesenteric or splenic artery. This method effectively avoids the impact of hepatic artery perfusion, and at the same time, improves the imaging contrast of the portal vein and intrahepatic blood vessels, which has important clinical value for accurately assessing the relationship between tumors and intrahepatic blood vessels [ ]. Therefore, CTAP is considered the most sensitive imaging modality for detecting focal hepatic lesions [ ]. However, CTAP involves a catheter insertion procedure, unavoidable ionizing radiation at the site and the potential for nephrotoxic complications caused by iodinated contrast material, so it is not suitable for screening. In recent years, researchers have tried to apply some new arterial spin labeling (ASL) technology developments in the field of magnetic resonance imaging to hepatic perfusion imaging in an attempt to non-invasively label and distinguish the blood flow components of the portal vein and hepatic artery so as to directly obtain blood flow components of the portal vein [ ]. However, ASL technology has low spatial and temporal resolution and poor imaging quality. Based on the above analysis, CTAP and ASL are limited by safety or low spatial and temporal resolution and still have obvious limitations in clinical diagnosis.
Progress has been made in perfusion imaging and measurement using droplets. Zajac [ ] was the first to propose using phase-change droplets to measure the hepatic perfusion index (HPI). Zajac applied indicator dilution analysis to the activated droplets to calculate flow rates in phantoms and compared them with values measured by an external flowmeter. Zhang et al. [ , ] demonstrated super-resolution ultrasound (SRUS) imaging based on nanodroplets in tube phantoms, introducing methods known as acoustic wave sparsely activated localization microscopy (AWSALM) [ ] and fast acoustic wave sparsely activated localization microscopy (fast-AWSALM) [ ]. Toulemonde et al. [ ] proposed a non-invasive flow visualization method using phase-change nanodroplets (PCNDs) and high frame rate US imaging, which was demonstrated in tube phantoms. Leow et al. [ ] investigated a novel approach using controllable microbubble destruction and high frame rate US to visualize flow in large vessels and quantify mixing. Recently, Zhang et al. [ ] and An et al. [ , ] proposed single-vessel US imaging techniques called arterial labeling ultrasound subtraction angiography and ultrasound digital subtraction angiography, respectively, based on PCNDs or microbubbles (MBs). These techniques enable specific vascular labeling and visualization of downstream perfusion areas. By combining with PCNDs or MBs, they used focused acoustic beams to label single vessels, generating bright signals (activated droplets) or dark signals (microbubble destruction) downstream, thereby specifically visualizing the downstream perfusion area of the labeled vessels non-invasively and with high spatiotemporal resolution. The concept of single-vessel labeling imaging has been validated in rabbit muscle, rabbit kidney and breast tumors in nude mice. Riemer et al. [ ] also used AWSALM to achieve selective vascular imaging in rabbit kidneys and first developed it into a 3-D matrix imaging approach [ ]. In this article, we collectively refer to such techniques capable of specific single-vessel imaging as vessel-labeling ultrasound (VLUS) imaging technology.
VLUS is able to interactively guide focused acoustic waves and non-invasively label a specific single blood vessel through deep coordination between a customized US pulse sequence and PCND or MB US contrast agents. Thus, real-time high-resolution US imaging of the downstream perfusion area can be achieved. In addition, by introducing SRUS imaging technology, VLUS is able to break through the acoustic diffraction limit and depict the microvascular structure of the downstream perfusion area with ultra-high resolution. Based on the above characteristics, this technology has the potential to directly separate portal vein blood flow components from liver tissue perfusion and is therefore highly suitable for hepatic perfusion imaging.
In this study, we attempted to combine ultrafast US, SRUS and VLUS to image and label mouse liver blood vessels, and for the first time explore the application potential of SRUS and VLUS in portal venous perfusion imaging.
Materials and methods
US imaging and pulse sequence design
A Vantage 256 ultrasound system (Verasonics Inc, Kirkland, WA, USA) was used for US imaging in this study. The capacitive micromachined ultrasonic transducer L22-8V (Kolo Medical Inc, San Jose, CA, USA) with a center frequency of 15.625 MHz was used to image the livers of BALB/c mice. During imaging, only 128 elements in the center of the L22-8V ultrasonic transducer were enabled. As illustrated in Figure 1 b, both vessel-labeling and imaging were achieved by using a customized periodic sequence termed “focused labeling pulse-plane wave pulse” [ ]. Specifically, the focused labeling pulse is simultaneously enabled by 128 elements to continuously transmit five focused waves with a mechanical index of 1.6. The repetition frequency of the focused labeling pulse is 25 kHz and the interval between the focused labeling pulse and plane-wave pulse is 200 μs. Moreover, plane waves with seven inclination angles between -18° and 18° were transmitted at a pulse repetition frequency of 5 kHz to coherently obtain compounded B-mode images at a frame rate of 500 Hz. For each angle, a single-cycle plane-wave pulse was transmitted by 128 elements with a mechanical index of 0.2. The acoustic pressure induced by a US transducer was measured using a fiber-optic hydrophone (0.2 mm needle hydrophone, Precision Acoustics Ltd, Dorchester, UK).

PCND preparation
PCND synthesis was adapted from the previously described ouzo method [ ]. Briefly, 1,2-distearoyl- sn -glycero-3-phosphocholine (CAS: 816-94-4, Avanti Corp, Birmingham, AL, USA), 1,2-distearoyl- sn -glycero-3-phosphoethanolamine- N -[methoxy (polyethylene glycol)-2000] (Avanti Corp.) and pluronic F68 were dissolved in ethanol solution at a molar ratio of 9:1:0.08. Then, perfluorobutane (C 4 F 10 , boiling point -2°C) was dissolved in the above solution until it was fully saturated. Next, a 7:2:1 volume ratio of water, propylene glycol and glycerol was prepared as an aqueous solution. Subsequently, the above perfluorobutane lipid-ethanol solution was pipetted into the aqueous solution to nucleate the PCNDs at room temperature (20°C). Finally, the PCND solution was centrifuged, decanted and resuspended in phosphate-buffered saline, and stored at 4°C.
In vivo protocol and VLUS
VLUS experiments were performed in the livers of BALB/c mice (n = 4). First, the BALB/c mice were anesthetized using a combination of isoflurane (1.5–2%) and then placed in the left lateral decubitus position. The right sides of the mice were completely shaved for subsequent US imaging of the liver. Subsequently, the forelimbs, hindlimbs and tails of the mice were fixed with tape, and 100 pL PCNDs at a concentration of 2 × 10 9 mL -1 were injected through the tail vein. The VLUS imaging process is illustrated in Figure 1 a. After injecting the PCNDs, ultrafast Doppler technology was initially used to find a suitable imaging section to identify the blood vessels to be labeled. A total of 500 frames of multi-angle compound plane-wave data were rapidly acquired at a frame rate of 500 Hz, and ultrafast Doppler results were obtained on site using the autocorrelation technique described by Kasai et al. [ ]. The ultrafast Doppler results were overlaid on real-time B-mode imaging results. Then, the focus of the acoustic wave was guided to the designated labeling point through mouse interaction, and the customized US sequence was continuously used to activate PCNDs and acquire plane-wave data, as illustrated in Figure 1 b. During each acquisition, the coherent compound plane-wave acquisition frame rate was 500 frames, with 2000 frames per acquisition, resulting in an acquisition duration of 4 s. After eliminating frames that were highly affected by respiratory motion, the remaining frames were filtered by singular value decomposition (SVD) to remove background tissue. We performed standard deviation projection on the SVD results and superimposed the projection results onto the B-mode images. Meanwhile, we selected a specific region of interest (ROI) based on the projection results of SVD to calculate the arrival time distribution map. Specifically, we selected the image frames before the first breath in the SVD filtering results and set an appropriate pixel intensity threshold to calculate the arrival time of the MBs formed after activation of the PCNDs at the labeled point at different locations within the blood vessel downstream. After the PCND-based VLUS experiment, 100 pL of Sonovue MBs at a concentration of 2 × 10 8 mL -1 were injected through the tail vein to conduct the microbubble-based VLUS experiment on mouse #01, with the experimental procedure similar to that illustrated in Figure 1 a. For a detailed workflow, please refer to Supplementary Figure 1 and Supplementary Video 1 .
Super-resolution US imaging
In order to further improve the resolution of the VLUS imaging results, a non-localization super-resolution strategy, ultrasound diffraction attenuation microscopy (UDAM) [ ], was used in this study. By performing offline post-processing on the selected image sequence ROIs in the VLUS process illustrated in Figure 1 a, we obtained the SRUS image and then superimposed it onto the original B-mode image in a specific manner. Here, UDAM reconstruction was based on the SRRF algorithm provided by the popular ImageJ plug-in NanoJ-SRRF [ ]. Specifically, during the UDAM reconstruction process, we set the ring radius, radial magnification and ring axes to 1.0, 10 and 2, respectively, and kept the other parameters at their default values for calculating the radiality transformation.
Results
PCND-based VLUS
The VLUS and SRUS imaging results of a typical section of the right lobe of the BALB/c mouse #01 liver are shown in Figure 2 . In this section, the hepatic portal vein and hepatic vein branches can be observed simultaneously. Figure 2 a shows the results of ultrafast Doppler imaging, which can help with quick visualization and localization of the blood vessels of interest and determination of the labeled points. As shown in Figure 2 (b–d), VLUS specifically enhanced the labeled vascular branches of the hepatic portal vein. Different labeled blood vessel branches were coded into different colors and superimposed onto the original B-mode image. Figure 2 (c, d) shows the labeling results of the downstream blood vessel branches of the labeled blood vessel in Figure 2 b. Figure 2 e shows the standard deviation projection image based on CEUS. Compared with the VLUS imaging results, all blood vessels containing microbubbles in the CEUS imaging area were enhanced. In order to further improve the resolution of VLUS imaging results, we combined UDAM-based SRUS technology with VLUS and obtained the SR-VLUS results shown in Figure 2 (f–h). Figure 2 (i–k) shows that microvessels 90 pm apart can be easily resolved in the SR image.

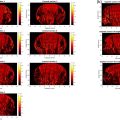
To validate the reproducibility of the portal vein perfusion imaging results, we also performed VLUS imaging of the portal vein in three additional mice. Each row in Figure 3 corresponds to one mouse. Figure 3 (a, f, k) shows the ultrafast Doppler results for each mouse, which were used to determine the imaging sections and labeling points, consistent with the description in the previous description. Figure 3 (b–d, g–i, l–n) shows the VLUS imaging results of the portal vein branches for each mouse, with white arrowheads indicating the labeling points. Figure 3 (c, d, h, i, m, n) shows the VLUS imaging results of the downstream branches of the labeled vessels in Figure 3 (b, g, l), respectively. Different labeling points reveal the downstream perfusion patterns of different portal vein branches, demonstrating that VLUS provides the ability to specifically label different portal vein branches and observe the downstream perfusion areas individually and in detail. Figure 3 (e, j, o) shows the VLUS imaging results of the hepatic veins. The imaging results of the hepatic veins exhibited different perfusion patterns compared with the portal veins.

Related posts:
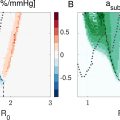 Ambient Pressure Sensitivity of Subharmonic Vibrating Single Microbubbles
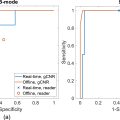 Comparative Assessment of Real-Time and Offline Short-Lag Spatial Coherence Imaging of Ultrasound Breast Masses
 Chinese Association of Ultrasound in Medicine and Engineering, Superficial Organs and Peripheral Vessels Committee Expert Consensus on Selected Common Clinical Issues in Parathyroid Ultrasound (2024 Edition)
 Two-dimensional Speckle Tracking Echocardiography and Fetal Cardiac Performance During Fetoscopic Repair of Myelomeningocele
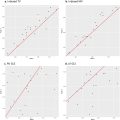
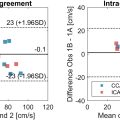 Ultrasound-based Velocity Vector Imaging in the Carotid Bifurcation: Repeatability and an In VivoComparison With 4-D Flow MRI
 The Potential for Blood–Brain Barrier Disruption During Transcranial Ultrasound Super-Resolution Imaging
Stay updated, free articles. Join our Telegram channel

Full access? Get Clinical Tree


