Abstract
Objective
Blood flow quantification using high frame-rate (HFR), contrast-enhanced ultrasound followed by particle image velocimetry (PIV), termed echoPIV, allows the study of blood flow phenomena in diseased arteries before and after treatment. However, acoustic shadows caused by atherosclerotic plaques may lead to incomplete flow quantification. As a global increase in transmit pressure to compensate for the attenuation would lead to contrast agent destruction in unattenuated areas, this article proposes a method to locally enhance the signal amplitude, thereby improving flow quantification accuracy.
Methods
The acoustic pressure was locally increased by adjusting the transmit apodization of the transducer elements using a proportional integral controller coupled to an acoustic model based on the Rayleigh integral. These iterative adjustments were performed prior to the HFR recording. This iterative scheme for active attenuation correction (ISAAC) was applied in vitro on phantoms with different levels of attenuation. A PIV analysis was then performed on each of the recorded HFR datasets.
Results
Without ISAAC, using a driving voltage of 11.2V, the mean errors in velocity estimates were below 20% for attenuation values up to 6.4 dB. Using ISAAC, the errors were reduced to less than 10% for attenuation values up to 8.5 dB and to less than 20% for attenuation up to 10.6 dB.
Conclusion
The proposed iterative scheme for attenuation correction was shown to compensate effectively for acoustic signal loss in acoustic shadows. ISAAC led to an improved accuracy in echoPIV-derived flow velocities.
Introduction
Atherosclerosis [ , ] is the root cause of peripheral artery disease (PAD) and subsequent stenotic lesions. The resulting decrease in blood flow [ , ] may lead to incapacitating symptoms. Treatment guidelines mostly advocate minimally invasive treatment via stent placement; however, stent patency remains a point of concern. Stent patency and the likelihood of restenosis are linked to disturbed blood flow [ ], affected by stent placement and geometry [ ]. Therefore, accurate blood flow characterization is likely to become instrumental pre- and post-operatively [ ].
In vivo , the gold standard for blood flow imaging is phase-contrast MRI (PC-MRI), which provides time-resolved 3-D flow, albeit with a low spatiotemporal resolution. In daily clinical practice, however, the most commonly used modality for flow imaging is Doppler ultrasound, which provides a more real-time and cost-effective flow quantification. However, Doppler only provides 1-D flow estimates over time and suffers from an inherent angle dependency [ ].
High frame-rate (HFR) ultrasound particle image velocimetry (echoPIV) has been developed to address key limitations of the aforementioned techniques and has been validated against PC-MRI [ ] and laser PIV [ ]. This technique consists of tracking the ultrasound speckle through local cross-correlation [ ] and the blood-to-tissue contrast is increased by intravenously injecting ultrasound contrast agents [ , ]. Its feasibility has been demonstrated both in vitro [ , ] and in vivo [ ].
Its application to PAD, however, brings a specific challenge: The high acoustic attenuation of calcified plaques creates a shadow in the image. When the lumen lies in the shadow, this can hinder accurate blood flow quantification. This issue arises in 16% to56% of in vivo measurements [ ]. Resolving this shadow artifact by allowing imaging behind the plaque would be a major step toward widespread applicability of echoPIV.
Post-processing approaches have been proposed to correct for shadow artifacts [ ]. However, post-processing strategies are inherently limited by the information contained in the acquired data and cannot increase the signal-to-noise ratio (SNR), which is the prime source of inaccuracy in PIV. A more apt approach would be a correction during acquisition. Most straightforwardly, one could estimate attenuation and then compensate for it in transmit. However, the low SNR behind the plaque also hinders direct attenuation estimation.
We therefore propose a scheme that iteratively adapts the acoustic pressure to compensate for attenuation, to improve flow quantification in acoustic shadow regions. Microbubble destruction due to increased acoustic pressure [ , , ] is prevented by avoiding pressure increases in the unattenuated regions. This is achieved by using a linear acoustic model and an iterative controller to automatically adapt the transmit apodization of the individual elements of a linear transducer array.
Materials and methods
Experimental setup
Figure 1 a shows the setup modeling a flow circuit with acoustic shadows. A gear pump (MGD1000P, RS Components Ltd., Corby, UK) was used to set the flow of degassed water to 4.3 ml/s (on average), monitored with a Coriolis flow meter (CORI-FLOW, Bronkhorst, Veenendaal, The Netherlands). A 1 m-long rigid tube of 6.8 mm inner diameter was used to develop the flow. Thereafter, a vessel phantom was placed in a water-filled Perspex container with an imaging window made of stretch wrap on the side. Imaging was performed using a Vantage 256 system (Verasonics, Kirkland, WA, USA) and the L12-3v probe (Verasonics, set center frequency of 7.3 MHz). SonoVue microbubbles (Bracco Suisse S.A., Geneva, CH) were used as ultrasound contrast agents.

Phantom design
Figure 1 b features an ultrasound image of a typical example of the used flow phantoms (inner diameter 6.8 mm, length 11.4 cm). A stereolithography printer (Form 3+, Formlabs, MA, USA) and Flexible 80a resin (SoS 1760–1800 m/s, attenuation 8.5 dB/mm, at 7.3 MHz [ ]) were used to print the phantoms (no ultraviolet post-curing). To model atherosclerotic plaques, an acoustic shadow was created using a ridge around the 0.5 mm-thick phantom wall. Measurements were performed on nine phantoms with ridge thicknesses, d ridge , between 0.25 and 2.25 mm, step size of 0.25 mm.
ISAAC: Iterative scheme for active attenuation correction
An iterative algorithm was developed to correct for plaque attenuation. All symbols used in the paper are summarized in Table 1 . Local adjustments to the pressure were achieved by changing the transmit apodization a e for each transducer element e. A i at the end of iteration i is a vector composed of the individual a e , which can be set between 0.2 and 1 on the Verasonics system. The iterations were stopped manually, after which a final adjustment to A led to A IS AAC , which was used for the HFR measurements.
| Symbol | Definition and variants |
|---|---|
| a | Apodization value ( a e : for element e) |
| A | Array of apodization values ( A IS AAC : obtained by ISAAC, A pc : used for partial compensation, A 0 : a e = 0.2 ∀ e ∈ [ 1 , N ] ) |
| d | Distance or thickness [m] ( d ridge : ridge thickness, d eq distance from element e to point q ) |
| e | Element index |
| E | Error ( E P : proportional part of error, E I : integral part of error) |
| F | A matrix describing the system of equations relating apodization A to pressure P |
| γ | Scalar value relating a e to p ¯ e , and p q to p ∼ q |
| i | Iteration |
| I | Image intensity ( I L : profile, I L , σ : smoothed profile, I sp : set point) |
| K | Constant ( K I : Integral constant, K P : proportional constant) |
| N | Number of transducer elements |
| ω | Regularization weight |
| p | Pressure [Pa or none] ( p ∼ : acoustic pressure at a query point, p ∼ e pressure amplitude of signal from element e, p q : normalized pressure (dimensionless) at query point q |
| P | A vector of pressure amplitudes at different query points ( P req : requested pressure, P 0 : pressure obtained using P = FA 0 , P 1 : pressure obtained using P = FA with a e = 1 ∀ e ∈ [ 1 , N ] ) |
| ψ | Percentage as used for partial compensation |
| q | Query point |
| Q | Total number of query points |
| S | Standard waveform transmitted by each element |
| σ | Standard deviation (SD) |
| t | Time [s] ( t eq : travel time over distance d eq , t max : duration of s ) |
| τ | Time [s] ( τ p : between t = 0 and the peak of the simulated waveform, τ q : travel time between z = 0 and z = z q ) |
| Δ t eq | Sampling time ( Δ t e q = τ q − t e q + τ p ) |
| U ¯ | Averaged horizontal flow velocity [m s -1 ] profile along diameter of tube ( U ¯ B R : behind ridge, U ¯ U P : upstream) |
| Δ U ¯ | Relative difference profile [%] ( 〈 Δ U ¯ 〉 : average of Δ U ¯ ) |
| X | Lateral position [mm] ( x e : element e, x q : query point q ) |
| Y | Function to be minimized in order to find an array A |
| z | Depth [mm] (axial distance to transducer surface, z q : from query point q ) |
Hardware time-gain compensation was set to its maximum, except for closest to the transducer. An in-house delay-and-sum (DAS) [ , ] implementation was used for image reconstructions. In the reconstruction, no time-gain compensation was applied and a viewing angle [ ] of 90 degrees was used. During ISAAC, the interframe time depends on the time it takes to update the transmit information in the Verasonics system after each iteration. The interframe time was therefore measured using MATLAB’s tic and toc methods.
ISAAC is available as an open-source package on https://github.com/Jelle-Plomp/ISAAC and consists of the following three parts:
Part 1: Obtaining an image profile
ISAAC was initialized by acquiring an image using the apodization A 0 , where a e = 0.2 ∀ e ∈[1, N ], with N = 128, the number of transducer elements. A rectangular region of interest (ROI) was selected in the vessel lumen (blue outline in Fig. 1 b). At each iteration, the pixel-wise intensity in the ROI was averaged column-wise to obtain the line profile I L . As the speckle pattern is not of interest, I L was smoothed to obtain I L , σ using a Gaussian filter (standard deviation [SD] 1 mm, approximately equal to twice the speckle size [ ]). The median value in the highest 10% of values in I L , σ of the first iteration was empirically selected as a measure for the signal outside the shadow and thus used as the set point value I sp .
Part 2: Linear acoustic model
A linear acoustic model was used to homogenize the image intensity by adapting A i . We assumed spherical emission (with 1/ r amplitude decay, where r is the traversed distance) of the acoustic signal s ( t ) by each of the elements, where the amplitude is modulated by a e . The transmit waveform simulated by the Verasonics system ( Fig. 1 c) was used as s ( t ) for t ∈ [ 0 , t m a x ] , where t m a x = 0.724 μ s is the duration of s . Outside of this interval, s ( t ) = 0.
The pressure in a medium could be obtained using an angular spectrum approach [ ], integrating the contributions from each element over space and time, and subsequently taking the envelope. However, this would be computationally too expensive. Therefore, inspired by DAS, we calculated the pressure at a query point q ( x q , z q ) at a single moment in time τ q , by linear summation of the contributions (each with their own phase). Figure 1 d (left) shows the model geometry for a single point q . At time τ q , the peak positive pressure of the plane wavefront arrives at q , corresponding to the distance z q between q and the transducer surface. The phase of the wave from element e at point q at time τ q is determined by the travel time t eq over the distance d eq from e to q . The signals were thus sampled at Δ t e q = τ q − t e q + τ p , where τ p is the time between t = 0 and the peak of the simulated waveform. A single cycle waveform was used, with the default on-time of 0.67. The on-time is the fraction of a half-cycle during which the tri-state pulse is non-zero, represented by the B parameter of the transmit waveform struct (TW.B) in the Verasonics code. The standard value set to minimize the generation of harmonics by the system is 0.67. This results in a nearly linear relation between a e and the amplitude p ¯ e of s for element e (see Appendix C ). We thus assumed p ¯ e = γ a e , where γ is an unknown constant relating pressure to apodization. The acoustic pressure p ~ q at q is then ( eqn [1] ):
For simplicity, we continue with a normalized pressure, p q = p ~ q / γ ( eqn [2] ):
Figure 1 d describes the sampling of s for a single q and illustrates the sum in eqn [2] .
For the entire line of queried points (a total of Q points), this generalizes into the system of equations ( eqn [3] ):
The matrix F (see also Fig. 1 e) was defined using the mid-line of the ROI as the query points. The system describes how the (relative) pressure at the query points is mathematically related to the apodization A. See Appendix A for more details on the validity of this model.
Part 3: Obtaining the required pressure and apodization
A proportional integral controller (see Fig. 1 b) adjusted the apodization based on the relative error E between the obtained and requested image intensity I L , σ and I sp . The proportional error E p was summed with the integral error E I and pressure profile P 0 (from eqn [3] using A 0 ) to obtain the requested transmit pressure P req . To prevent large error accumulation, the integral error E I was first clipped such that P req – E p remained approximately between P 0 and P 1 (obtained from eqn [3] ) using a e = 1 ∀ e ∈ [ 1 , N ] .
The ‘Minimize’ step in Fig. 1 b used a non-linear least-squares method (MATLAB’s lsqcurvefit ) to find A such that the function Y below was minimized. Minimization was used because F is not necessarily invertible ( eqn [4] ):
with Smooth a Gaussian filter. Apart from minimizing FA – P req (from eqn [3] ), Y includes a regularizer term to prevent large differences between neighboring apodizations a e . Regularization weight ω = 1000 was chosen empirically (see Appendix B ). Lower and upper bounds of 0.2 and 1 were imposed on A to match the Verasonics system requirements. The obtained A was set as A i , after which a new iteration commenced. After stopping the iterations, the apodization was fixed. Intensity fluctuations between iterations are not necessarily problematic as long as the error E is sufficiently small with the final apodization. The iterations were manually stopped once the operator expected no further convergence, based on a dashboard as in Supplementary Videos 1 and 2 . The dashboard shows P req , A and I L , as well as the progress of the mean changes in A, E p and maximum of the clipped E I (mean and maximum over the 128 elements).
A schematic of the implementation of ISAAC in the Verasonics system is presented in Figure 2 .

Partial compensation
ISAAC aims to homogenize I L , σ . However, as attenuation happens both on the forward and return paths, a homogeneous I L , σ means that the acoustic pressure in the shadow region is higher than in the non-shadow region, which could lead to bubble destruction. To assess how much compensation is sufficient to achieve reliable blood flow quantification, HFR measurements were also performed using the following set of apodization profiles A pc ( ψ ) ( eqn [5] ):
These profiles correspond to partial compensations for signal loss in the ultrasound image.
HFR acquisition, pre-processing, reconstruction and PIV
All HFR recordings consisted of 1000 frames taken at 5000 fps, using unfocused plane waves. The other settings were the same as during ISAAC.
Data analysis was performed in MATLAB (R2023b). First, clutter filtering using singular value decomposition was applied on the raw HFR data [ ] using all 1000 frames as one ensemble, rejecting the first 20 singular values. Next, reconstruction was performed using the in-house DAS algorithm and echoPIV was performed on the resulting IQ data (without log compression). The echoPIV code was adapted from Voorneveld et al. [ ]. Six iterations were used for PIV analysis, with kernel sizes of 64 × 64, 32 × 32 and 16 × 16 pixels, each applied twice for consecutive iterations. Each frame was compared with the fourth next frame, ensuring sufficient displacement between frames. An average of two correlation maps was used for each vector. No temporal smoothing was applied. To illustrate this, the first PIV frame would be constructed based on the average cross-correlation between kernels taken from frame 1 and 5, and 2 and 6, continuing from frame 3 onwards for the second PIV frame. Before averaging the results, two PIV frames were removed at each of the nine transitions between image data buffers (occurring after every 100th image acquisition). This was because at these transitions, the time to the next acquisition was slightly larger (by an unknown amount) than the set frame rate, thereby preventing the recovery of velocity estimates between these frames. The average velocities were obtained based on the remaining 479 vector fields.
Evaluation
Measurements were performed on all nine phantoms. To additionally show the influence of the driving voltage, measurements were performed at 11.2V and 30.4V. The efficacy of the compensation strategy was evaluated by comparing the averaged echoPIV-derived velocity profiles in the region behind the ridge U ¯ B R and the control upstream U ¯ U P , for different d ridge . The flow profiles at the different locations were assumed to be identical due to the constant tube diameter. In the results, the estimated parabolic flow profiles based on the data of the flow rate sensor are also shown for comparison. However, due to the error margin of this estimate, as well as potential flow disturbances at the connection between the entry tube and the phantom, the upstream velocity profile was chosen as the reference velocity profile. The tube was positioned parallel to the transducer and thus the x -axis (see Fig. 1 b). U ¯ B R and U ¯ U P were computed by averaging the u component of the vectors (flow in the x -direction) over time and over 4 mm in the x -direction. The profiles U ¯ B R were aligned with U ¯ U P using cross-correlation to correct for a perceived shift in z position caused by SoS differences. The relative difference Δ U ¯ was calculated as eqn (6) :
Related posts:
 Ambient Pressure Sensitivity of Subharmonic Vibrating Single Microbubbles
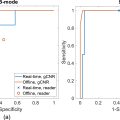 Comparative Assessment of Real-Time and Offline Short-Lag Spatial Coherence Imaging of Ultrasound Breast Masses
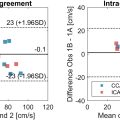 Ultrasound-based Velocity Vector Imaging in the Carotid Bifurcation: Repeatability and an In VivoComparison With 4-D Flow MRI
 Hepatic Portal Venous Perfusion Imaging Using Vessel-Labeling Super-Resolution Ultrasound
 The Potential for Blood–Brain Barrier Disruption During Transcranial Ultrasound Super-Resolution Imaging
 Delivering Gd-Labeled IgG Antibodies Into the Mouse Brain Following Focused Ultrasound Treatment
Stay updated, free articles. Join our Telegram channel

Full access? Get Clinical Tree


