Imaging is essential in the evaluation and management of acute pulmonary embolism. Advances in multi-energy CT including dual-energy CT and photon-counting CT have allowed faster scans with lower radiation dose and optimal quality. Artificial intelligence has a potential role in triaging potentially positive examinations and could serve as a second reader.
Key points
- •
Imaging is essential in the evaluation and management of acute pulmonary embolism.
- •
Advances in multi-energy CT including dual-energy CT and photon-counting CT have allowed faster scans with lower radiation dose and optimal image quality.
- •
Artificial intelligence has a potential role in triaging potentially positive examinations and could serve as a second reader.
Introduction
The annual incidence of acute pulmonary embolism (PE) is one in 1000 person worldwide. PE accounts for 100,000 deaths annually in the United States. Although the true mortality rate from undiagnosed PE is low, the diagnosis itself can be debilitating as recovery from acute PE encompasses complications like bleeding secondary to anticoagulation treatment, recurrent venous thromboembolism, chronic thromboembolic pulmonary hypertension, and prolonged psychological stress. Post-pulmonary-embolism syndrome refers to the functional and exercise limitations 1 year after a diagnosis of PE and occurred in about 50% of patients in one cohort. , A timely and expert diagnosis of PE is therefore important.
PE usually occurs when a clot enters the pulmonary circulation, most commonly arising from deep calf veins. Imaging is crucial for appropriate diagnosis and management of acute PE. CT pulmonary angiography (CTPA) is the most common modality used in the evaluation of suspected acute PE with a reported sensitivity and specificity of 96% to 100% and 89% to 98%, respectively.
Acute PE can be a challenging clinical diagnosis to make due to nonspecific presenting signs and symptoms, and about two-thirds of patients may be asymptomatic. A number of clinical scoring systems like the Wells criteria, the Geneva score, and the Pulmonary Embolism Rule-out Criteria are used in combination with values like age adjusted D-dimer to determine the clinical risk of PE ( Table 1 ).
| Wells Score | Geneva Score | PERC Score | |||
|---|---|---|---|---|---|
| Criteria | Points | Criteria | Revised Pts | Simplified Pts | Criteria |
| PE most likely diagnosis | 3.0 | Age >65 y | 1.0 | 1.0 | Age ≥50 y |
| Signs and symptoms of DVT | 3.0 | Previous DVT or PE | 3.0 | 1.0 | HR ≥100 bpm |
| HR >100 bpm | 1.5 | Surgery/fracture within 1 mo | 2.0 | 1.0 | SPO 2 <95% while patient is breathing room air |
| Immobilization for >3 days/surgery in the previous 4 wk | 1.5 | ||||
| Active cancer | 2.0 | 1.0 | Swelling in one leg | ||
| Previous DVT or PE | 1.5 | Pain in one lower limb | 3.0 | 1.0 | Hemoptysis |
| Hemoptysis | 1.0 | Hemoptysis | 2.0 | 1.0 | Surgery/trauma in the last 4 wk |
| Active cancer | 1.0 | HR between 75 and 94 BPM | 3.0 | 1.0 | |
| Heart rate ≥95 BPM | 5.0 | 2.0 | Previous DVT or PE | ||
| Pain on lower limb deep-vein palpitation and edema in one leg | 4.0 | 1.0 | Hormone use | ||
The recent technological advancements like dual-energy CT and emerging technology like photon-counting CT (PCCT) show promising results in improving the image quality of CTPA even with lower radiation dose. Artificial intelligence (AI) with robust deep learning algorithms has shown encouraging results as a potential second reader and as a triage tool for identifying potentially positive CTPA. The authors discuss the role of imaging including newer technologies and the potential roles for AI in acute PE.
Imaging techniques
Chest Radiography
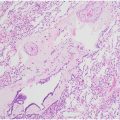
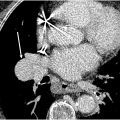
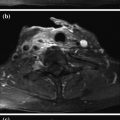
Chest radiography has limited utility in the diagnosis of PE but is useful in excluding other causes of acute chest pain and dyspnea such as pulmonary edema, pneumonia, or pneumothorax. Rarely encountered indirect signs that may indicate acute PE include the Fleischer sign (an enlarged main pulmonary artery secondary to the embolus and acute pulmonary hypertension), Palla’s sign (an enlarged right descending pulmonary artery before a vascular occlusion in acute PE), and the Westermark sign (acute cut-off of the pulmonary artery with regional hypo perfusion). PE can lead to pulmonary infarction, manifesting as a subpleural wedge shaped opacity with apex directed toward the hilum (Hampton hump; Fig. 1 A–C ), but this sign has a low sensitivity (22%) and intermediate specificity (82%). Other nonspecific findings include atelectasis, pleural effusion, elevated hemidiaphragm, and vascular redistribution with sensitivity of 10% to 36% and specificity of 70% to 85%.

CT Pulmonary Angiography
CTPA is the diagnostic imaging test of choice for the evaluation of patients with suspected acute PE as it is widely available, fast, minimally invasive, and cost-effective.
CTPA has undergone remarkable advancements over years. The transition from single to multi-detector CT (MDCT) technology significantly allowed improvement in spatial and temporal resolution, acquisition speed, and overall diagnostic accuracy. A meta-analysis of state-of-the-art MDCT, including 16 studies with 4,392 participants, showed pooled sensitivity and specificity estimates of 94% and 98%, respectively.
Further advancements in scanning technology have continued to refine the role of CTPA in acute PE diagnosis. The introduction of dual-source scanners has been particularly notable, enabling high helical pitch scanning and spectral scanning. High-pitch scanning offers the potential to reduce both contrast and radiation doses while maintaining sufficient image quality for accurate diagnosis. For example, a recent study showed that high-pitch CTPA using a contrast dose as small as 20 mL, compared to the standard 50 mL, resulted in diagnostic images for detecting acute PE and significantly reduced radiation exposure in patients without obesity.
Additionally, a study comparing high-pitch CT scans to standard pitch protocols found that the former significantly improved quality of the scan, from decrease in motion artifacts thereby, allowing optimal evaluation of cardiac structures. The mean effective dose was also significantly lower for high-pitch scans, while maintaining comparable image quality in terms of pulmonary vessel attenuation, signal-to-noise ratio, and contrast-to-noise ratio (CNR).
The pulmonary arteries need to be adequately opacified so that the thrombus is distinguished from intraluminal contrast material. A theoretic minimum of 93 Hounsfield (HU) intraluminal density is required for the detection of acute PE and of 211 HU to detect chronic embolus. Optimal timing for intravenous contrast bolus can be determined using bolus tracking, timing bolus, and empirical techniques. A saline injection of the same volume is administered after contrast to reduce the dense streak artifacts from undiluted contrast in the superior vena cava (SVC). The exact contrast material volume, concentration, and injection rate depend on the scanner characteristics.
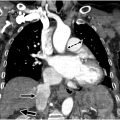
Signs of acute PE on CT are based on if the PE is acute or chronic and occlusive or nonocclusive. Total non-opacification of the vessel occurs from occlusion. A “polo mint” sign ( Fig. 2 ) implies a central well-defined filling defect surrounded by contrast when oriented perpendicular to the long axis of the vessel. The “railway “sign ( Fig. 3 ) refers to the linear filling defect in the vessel when the orientation of the vessel is parallel to its long axis. A saddle embolus occurs when the thrombus branches across the main pulmonary artery bifurcation and into the main branch vessels ( Fig. 4 ). A nonocclusive filling defect can also present as an eccentric clot, but typically, the vessel is enlarged, and the filling defect makes an acute angle with the wall ( Fig. 5 ), unlike in chronic embolus where the involved vessel is attenuated, and the filling defect is concave and aligns at an obtuse angle.


Detection of acute embolus in the subsegmental vessels, which affects the fourth division and further distal pulmonary arterial branches, became possible with the advent of multidetector row CTPA. The detection rate of subsegmental has increased with multidetector CT and ranges from 3% to 12%, but the significance of their detection in a low-risk patient without deep venous thrombosis is controversial.
On CTPA, a pulmonary infarct appears as a peripheral wedge-shaped focus of non-enhancing consolidation intermixed with ground-glass opacity (GGO). A “reverse-halo” or “atoll” (see Fig. 1 ) appearance consisting of central GGO surrounded by a complete or incomplete rim of consolidation is an occasional finding. The central GGO usually represents coagulative necrosis. Although there are quantitative scoring systems to assess clot burden and obstruction index in the pulmonary vessels, use in clinical workflow is not routine. ,
Several risk stratification parameters can be derived from CTPA such as right ventricular strain and lung perfusion. Imaging features of right ventricular strain include an increased right-to-left ventricle ratio (>1.1) in the axial plane, contiguous reflux of contrast into the inferior vena cava (IVC) and hepatic veins and flattening of interventricular septum ( Fig. 6 A–B ). Several studies have correlated the right ventricle- left ventricle (RV-LV) ratio with 30 day mortality. In acute PE, an RV diameter of 53 mm or more and a CT obstruction index greater than 70% are associated with increased 30 day mortality in one retrospective single-center study. A 4 chamber RV-LV ratio greater than 0.9 was associated with poor clinical outcome and increased risk of death within 30 days in combination with elevated high-sensitivity cardiac troponin-I in a retrospective study. However, another study showed that RV/LV greater than 1 did not predict severe outcomes (odds ratio [OR] = 0.73, P =0). Main PA diameter and interventricular septal bowing have an association with short-term adverse outcomes in patients with acute PE. ,

Artifacts on CT Pulmonary Angiography
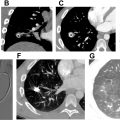
Motion artifacts from cardiac pulsation or patient movement and streak artifacts from undiluted contrast in the SVC can degrade image quality of CTPA. Suboptimal contrast enhancement can occur in CTPA examinations from underlying physiology like decreased cardiac output. The radiologist should be aware of these appearances and be able to distinguish artifacts from true contrast enhancement to avoid erroneous interpretation, especially in critically ill patients. Some of these artifacts are also described as “smoke-like” artifacts ( Fig. 7 A–C and 8 A–C ) in vessels secondary to mixing of unpacified blood with contrast and more frequent in the modern scanners secondary to increased temporal resolution and shorter scan time. Transient interruption of flow to contrast can occur if there is mixing of unopacified blood from the IVC with contrast coming from the SVC exacerbated by the Valsalva maneuver and culminating in poor opacification of the pulmonary vasculature.


A true thrombus appears as a well-defined filling defect with sharp and convex margins. The mean attenuation of acute PE was at 33HU+-15 HU, in one study and, 90% of the emboli had an attenuation less than 100 HU. Improper display of the window settings, particularly narrow window width (WW) and high window level (WL), can lead to accentuation of the heterogeneous attenuation of the “smoke-like” appearance. Window settings (WL-40/WW-400) based on the double-half method are a standard practice that should be adequate for identification of PE and reducing this artifact.
Scanning very early can create artifacts at the leading edge of the contrast bolus and form an intravascular contrast level in pulmonary artery branches but typically, a straight interface with the dependent contrast medium allows identification as artifact. Regional alterations of pulmonary blood flow secondary to resistance in chronic parenchymal lung disease occur due to vasoconstriction from hypoxia (see Figs. 7 and 8 ). Narrowing of the vessel upstream in pulmonary venous stenosis or downstream due to narrowing of pulmonary artery in conditions like fibrosing mediastinitis creates slow flow mimicking emboli. Flow from venous collateral due to decreased cardiac output or bronchial artery collaterals (see Fig. 8 ) in bronchiectasis can also create filling defects, but the proximity to the bronchial collaterals should be a clue. The latter can be distinguished by acquiring the scan in the systemic arterial phase with saline flushes.
Flow artifacts can be managed by obtaining a delayed acquisition in a venous phase or by using the bolus triggering method with region of interest (ROI) on the descending aorta at 1 to 3 minutes or single-phase split bolus technique. The earlier acquisitions lead to improvement in contrast enhancement of the pulmonary vasculature and at the same time allow aortic pathologies to be excluded.
Technical Advances on CTPA, Multi-energy CT, and Photon-counting CT
A significant advancement in CTPA entails introduction of MECT, initially enabled by dual-source scanners. This technology is supported by innovations, such as rapid kVp switching, dual-spin CT, split-beam CT, dual-layer CT, and PCCT. MECT can provide low virtual monoenergetic (VMI) and iodine-based material decomposition images. Low VMI enhances the apparent CT numbers of iodine, thereby improving the CNR compared to low kVp imaging ( Fig. 9 ) alone, potentially offering superior evaluation of vascular structures and enhanced detection of PE. ,

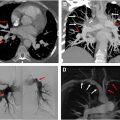
Iodine-based material decomposition imaging has been adopted as a surrogate method for assessing perfusion. , MECT perfusion approximates perfusion at a single time point, unlike dynamic CT or MR perfusion, and depends on acquisition timing and hemodynamics. Pulmonary blood volume (PBV) images are derived by calculating the mean enhancement of the pulmonary parenchyma relative to a reference vessel (usually the pulmonary trunk) and correcting this ratio with a calibration factor. PBV imaging has been effective in identifying perfusion defects related to pulmonary emboli ( Fig. 10 A, B ), with reported per segment sensitivity and specificity of 83% and 99%, respectively, when compared to perfusion scintigraphy. Another study indicated that iodine imaging showed a sensitivity and specificity of 77% and 98%, respectively, compared to single-photon emission computed tomography (SPECT)/CT. Combining MECT iodine imaging with CT angiography has demonstrated the highest diagnostic performance for PE in animal models. Additionally, MECT offers prognostic value in patients with PE by identifying those at higher risk for major adverse events. The volume fraction of hypoperfused lung measured by MECT PBV was found to have good correlation with markers of right heart strain and moderate correlation with the Mastora score and right-to-left ventricle diameter ratio in a 4 chamber view.