Imaging of Soft Tissue Masses


Imaging of Soft Tissue Masses


The radiologic evaluation of soft tissue masses has changed dramatically within the last three decades. Prior to the advent of computer-assisted imaging, assessment of a clinically suspicious soft tissue mass was usually limited to radiographs. Although radiographs were sensitive to the identification of adipose tissue and soft tissue mineralization, they provided little other diagnostic information. When lesions were small, radiologists of those dark days were happy just to confirm the presence of a mass, much less give a confident diagnosis. The emergence of computed tomography (CT) improved that situation dramatically. Masses could be delineated with great confidence and generally well-staged with excellent depiction of anatomic detail. Diagnosis, however, remained problematic, with images sufficiently characteristic to suggest the correct histology in only a minority of cases, typically lipomas and hemangiomas (1).

The introduction of magnetic resonance (MR) imaging was met with great enthusiasm because of the markedly improved soft tissue contrast and multiplanar image acquisition capabilities. The imaging of soft tissue masses was now on a par with that of other imagingintense radiologic subspecialties, showing exquisite depiction of anatomic detail. This ability to accurately characterize masses anatomically spurred new interest in the evaluation of soft tissue tumors. Attempts were made to develop rules, analogous to those for bone tumors, for differentiating benign from malignant processes based on lesion morphology and signal intensity; however, with few exceptions, these proved unreliable (2, 3, 4, 5, 6, 7).

What has emerged is an approach to evaluation that is a combination of science and gestalt: a few well-tested general principles, as well as a number of lesions with a characteristic imaging appearance. Despite the initial fervor for the superiority of MR imaging in assessing soft tissue tumors, it remains relatively limited in its ability to characterize them precisely, with a correct histological diagnosis reached solely on the basis of imaging studies in only approximately one-quarter to one-third of cases (5, 6, 7). More recently, the superiority of MR imaging in the staging of musculoskeletal tumors has also come into question. In a multi-institutional study of 133 patients with primary soft tissue malignancies, the Radiology Diagnostic Oncology Group found no statistically significant difference between CT and MR imaging in determining tumor involvement of muscle, bone, joint, or neurovascular structures (8).

Despite these limitations, most radiologists are comfortable with the use of MR in the evaluation of soft tissue lesions. We strongly believe MR is the modality of choice. When used in conjunction with a systematic approach, the majority of masses can be diagnosed correctly. Accordingly, this chapter presents a systematic approach to the evaluation of soft tissue tumors, highlighting the use of MR imaging in diagnosing and in differentiating benign from malignant soft tissue lesions. In addition, an approach is provided for establishing a differential diagnosis for those lesions with a nonspecific imaging appearance, as well as indications for contrast-enhanced imaging.


We also briefly review the use of other imaging modalities in the evaluation of soft tissue tumors, emphasizing their applications and limitations. Finally, information required for staging is presented, as well as a review of the imaging appearance of patients following treatment.


IMAGING EVALUATION

The initial evaluation of a patient with a soft tissue mass begins with a thorough clinical history and radiologic evaluation.


Clinical History


The clinical history is an important factor in establishing an accurate diagnosis. In many circumstances, it provides key information that allows a specific diagnosis when imaging is nonspecific. Is there a history of a previous lesion or underlying malignancy? Has there been previous surgery or radiation? It is essential to know how the patient presented: Is the lesion painful or did the patient note a painless mass? A painful mass always requires inclusion of an inflammatory process in the differential diagnosis. Is there a history of notable trauma or anticoagulants? Has the lesion remained stable over a long period of time, varied in size, or is it growing? A history of continued growth is always suspicious for malignancy. Unlike bone tumors, however, a slowly growing soft tissue mass is not invariably indicative of a benign process. Variation in lesion size with time or activity is exceedingly unusual for a malignancy and suggests a process such as a ganglion or hemangioma.

Is there more than one lesion? Soft tissue tumors are typically solitary; therefore, the identification of multiple lesions markedly limits the differential diagnosis. Multiple lipomas are seen in 5% to 15% of patients presenting with a soft tissue mass (9, 10, 11). The diagnosis in these cases can be made confidently on the basis of MR signal intensity. Aggressive fibromatosis is multifocal in 10% to 15% of patients (12, 13). A second soft tissue mass in a patient with a previously confirmed desmoid tumor should be regarded as a second desmoid tumor until proven otherwise (14). Patients with neurofibromatosis have multiple lesions, and although the diagnosis is often known or suspected, such is not always the case (Fig. 3.1). The diagnosis may be suggested on the basis of imaging findings by the identification of multiple lesions in a major nerve distribution.

Angiomatous lesions are quite common, and they are multiple in as many as 20% of patients (15). In such cases, superficial and deep lesions may coexist. Multiple lesions may also be seen with metastatic disease. Although the soft tissue comprises about 40% of total body weight, it is relatively resistant to metastasis, and soft tissue metastases are quite rare. The skin and the subcutaneous tissue are a frequent site of extraosseous involvement in patients with multiple myeloma, typically seen as multiple subcutaneous nodules (16). Although extraosseous manifestations are found in less than 5% of patients with multiple myeloma, they are associated with a more aggressive clinical course (16). Metastatic melanoma may display a similar pattern of multiple nodular subcutaneous metastases (17). These are seen in more than 30% of patients with melanoma metastatic disease, usually in patients with Clark level IV or V disease (depth
on tumor invasion into the deep dermis or through the dermis into the subcutaneous fat), and may be the only radiologic manifestation of metastases (17). Finally, multiple myxomas may be seen in association with fibrous dysplasia of bone (Mazabraud syndrome) (18). These myxomas are usually intramuscular and the association is most frequent with polyostotic disease (18, 19).


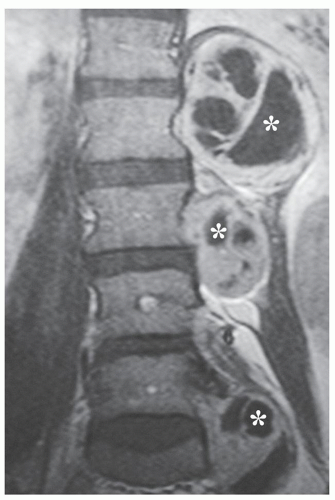
FIGURE 3.1 Neurofibromatosis: Woman, 36 years of age, presenting with multiple soft tissue masses. Coronal contrastenhanced T1-weighted (TR/TE; 500/15) spin-echo MR image shows multiple left paraspinal masses with cystic change (asterisks).


Radiographic Evaluation


Despite dramatic technological advances in our ability to image soft tissue tumors, the radiologic evaluation of a suspected soft tissue mass must begin with the radiograph. Although often unrewarding, it is impossible to predetermine those cases in which radiographs will be critical for diagnosis. Radiographs may be diagnostic of a palpable lesion caused by an underlying skeletal deformity (such as exuberant callus related to prior trauma) or exostosis, which may masquerade as a soft tissue mass. Radiographs may also reveal soft tissue calcifications, which can be suggestive and, at times, very characteristic of a specific diagnosis. For example, they may reveal the phleboliths within a hemangioma (Fig. 3.2), the juxta-articular osteocartilaginous masses of synovial chondromatosis, the peripherally more mature ossification of myositis ossificans, or the characteristic bone changes of other processes with associated soft tissue involvement. When not characteristic of a specific process, soft tissue calcification can suggest certain diagnoses. For example, nonspecific dystrophic calcifications within a slowly growing lower extremity mass in an adolescent or young adult should suggest a synovial sarcoma as the diagnosis of exclusion (Fig. 3.3).

In addition, radiographs are the best initial method of assessing coexistent osseous involvement, such as remodeling, periosteal reaction, or overt osseous invasion and destruction (20). However, unlike bone tumors, the biologic activity of a soft tissue mass cannot be reliably assessed by its growth rate. A slowly growing soft tissue mass that remodels adjacent bone (causing a scalloped area with well-defined sclerotic margins) may still be highly malignant on histologic examination.

Gartner et al (20) reviewed the radiographic features 454 patients with soft tissue tumors referred to an orthopedic oncology service over an 8 year period, noting positive findings in 281 (62%). While this was most frequently identification of the suspected mass in 141 (31%), calcification was found in 76 (17%), osseous involvement in 62 (14%), and intralesional fat in 32 (7%).


Magnetic Resonance Imaging

MR imaging is the preferred modality for evaluating soft tissue lesions (2, 3, 4, 21, 22, 23, 24, 25, 26, 27, 28). It provides superior soft tissue contrast, allows multiplanar image acquisition, obviates the need for iodinated contrast agents or for ionizing radiation, and is devoid of streak artifact commonly encountered with CT imaging (2, 21, 22, 23). When clinical findings are equivocal, MR imaging evaluation can confirm the presence of a soft tissue lesion or reassuringly identify a suspected “bump” or “mass” as normal tissue (Fig. 3.4) (29).


Technique


Lesions should be imaged in at least two orthogonal planes, using T1-weighted and T2-weighted spin-echo MR pulse sequences in at least one of these. We find spin-echo imaging the most useful in establishing a specific diagnosis. It is the most reproducible technique and the one most often referenced in the tumor-imaging literature. It is the most familiar imaging technique for tumor evaluation and the standard by which other imaging techniques must be judged (30). The main disadvantage of spin-echo imaging remains the relatively long acquisition times, particularly for multi-echo T2-weighted sequences (30). Radiologists are most familiar with conventional axial anatomy, and we obtain axial T1- and T2-weighted spin-echo images in almost all cases. The choice of additional imaging plane or planes varies with the involved body part, the lesion location, and its relationship to crucial structures. In general, the additional plane is sagittal with anterior or posterior masses, and coronal with medial or lateral lesions. Oblique
planes may also be a useful adjunct. In these additional planes, it is valuable to use a combination of conventional T1- and T2-weighted spin-echo images, turbo (fast) spinecho images, gradient images, and short-tau inversion recovery (STIR) images, as the case requires.


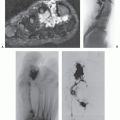
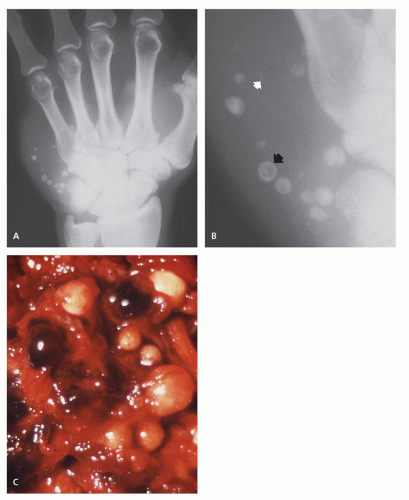
FIGURE 3.2 Phleboliths: Hemangioma in the hypothenar eminence of hand of a 52-year-old man. A: Radiograph shows hypothenar mass with multiple calcifications. B: Columnated radiograph shows multiple, small, smooth, rounded calcifications (black arrow), more opaque peripherally, characteristic of phleboliths. Note small, nonspecific calcifications (white arrow). C: Corresponding intraoperative photograph shows multiple phleboliths within interstices of hemangioma.

Fast scanning techniques may be helpful in the evaluation of soft tissue masses. They allow for shorter imaging times, decreased motion artifact, and increased patient tolerance, as well as patient throughput (30, 31). They may add additional information and be helpful in specific instances, although fast scanning techniques have not replaced standard spin-echo imaging. Gradient-echo imaging may be a useful supplement in demonstrating hemosiderin because of its greater magnetic susceptibility. Also, in general, susceptibility artifacts related to metallic material, hemosiderin, and air are accentuated on gradient-echo images (32) (Fig. 3.5). Gradient-echo images may also be better in some instances to demonstrate the lesion-to-fat interfaces and to depict small surrounding vessels (33). STIR imaging can be an adjunct in selective cases. STIR imaging produces fat suppression and enhances the identification of abnormal tissue
with increased water content, and, as such, is useful in confirming subtle areas of soft tissue abnormality (34). This technique increases lesion conspicuity (34, 35) but typically has lower signal-to-noise than does spin-echo imaging and is also more susceptible to degradation by motion (30, 34). Lesions are generally well seen on standard imaging, and, in our opinion, STIR imaging tends to reduce the variations in signal intensities identified on conventional spin-echo MR imaging, signal intensities which are most helpful in tissue characterization.


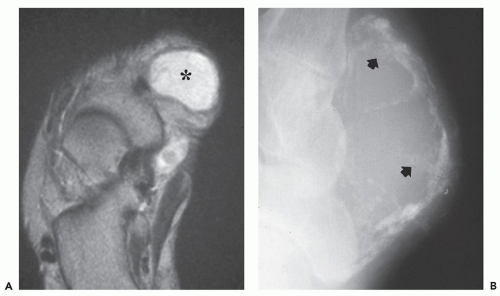
FIGURE 3.3 Synovial sarcoma: Mass in the foot of a 17-year-old girl presenting with slowly growing painless mass. A: Axial conventional T2-weighted (TR/TE; 1800/80) spin-echo MR image shows well-defined, nonspecific, soft tissue mass (asterisk). B: Corresponding radiograph shows peripheral and central calcification. The peripheral mineralization (arrows) does not show the ossification required to suggest myositis ossificans. Equally important, the history of a growing mass should also exclude this diagnosis. This radiographic appearance (calcified soft tissue mass), in context of slowly growing juxta-articular mass in a young adult, strongly suggests the appropriate diagnosis.


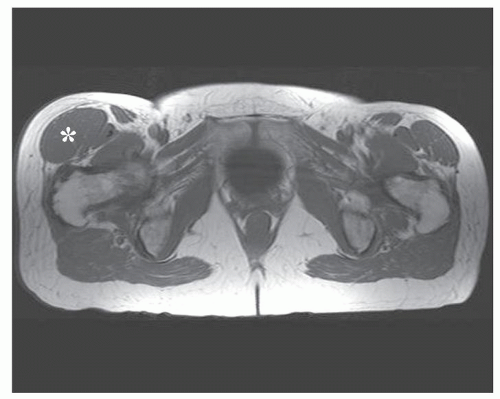
FIGURE 3.4 Hypertrophied muscle: Mass-like soft tissue asymmetry in the right thigh suggesting a mass in a 76-yearold woman. Axial T1-weighted (TR/TE; 640/15) spin-echo MR image shows the marked hypertrophy of the right tensor fascia lata muscle (asterisk), an uncommon clinical variant.

Fat suppression on T2-weighted images is useful in increasing lesion-to-background signal intensity differences for high signal intensity lesions within the marrow or fatty soft tissue (36). As with STIR techniques, fat-suppressed T2-weighted imaging decreases variations in tumor signal intensities, and we do not use this in place of T2-weighted images. Fat-suppression imaging is also useful in decreasing or eliminating the MR signal from fat, allowing increased conspicuity of contrast enhancement. We find that fat-suppressed T1-weighted images are especially useful in identifying lesions containing paramagnetic substances (such as methemoglobin).

Field of view is dictated by the size and location of the lesion. In general, a small field of view is preferred to provide the greatest anatomic detail. The field of view, however, must be large enough to evaluate the lesion and allow appropriate staging (Fig. 3.6). When an extremity is being evaluated, it is not usually necessary to obtain the contralateral extremity for comparison, unless no lesion is detected on initial sequences (Fig. 3.7). It can be useful
to place a marker over the area of clinical concern, to ensure that it is appropriately imaged. This becomes important in evaluating lesions such as subcutaneous lipoma or lipomatosis, in which the lesion may not be appreciated as being distinct from the adjacent adipose tissue. When small superficial lesions are being evaluated, care should be taken to ensure that the marker or patient position does not compress the mass.


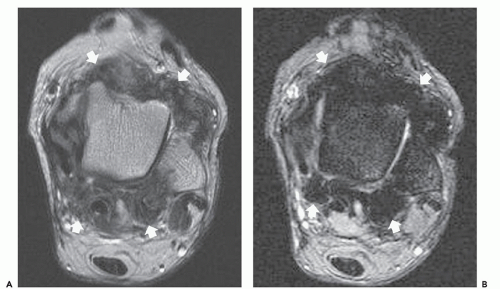
FIGURE 3.5 Hemosiderin identification with gradient-echo imaging: Pigmented villonodular synovitis (PVNS) in the ankle of a 23-year-old woman. A: Axial fast spin-echo T2-weighted (TR/TE; 4570/80) MR image shows a mass surrounding the ankle (arrows) with intermediate-to-decreased signal intensity. B: Corresponding axial gradient-echo (TR/TE; 785/20) MR image shows marked decreased signal from the mass (arrows) caused by the greater magnetic susceptibility of the hemosiderin-laden tissue, characteristic of PVNS.


Contrast Enhancement

Although there is general agreement on the value of MR in the detection, diagnosis, and staging of soft tissue tumors and tumor-like lesions, the use of intravenous contrast in their evaluation remains somewhat controversial. In general, MR contrast agents enhance the signal intensity on T1-weighted spin-echo MR images of many tumors, in some cases enhancing the demarcation between tumor and muscle and tumor and edema, as well as providing information on tumor vascularity (37, 38). In actuality, differentiation between tumor and muscle is usually quite well-delineated without enhanced imaging on fluid-sensitive images, and the accurate distinction between tumor and edema is probably of little practical value. Edema, which is infrequent without superimposed trauma or hemorrhage, is considered to be part of the reactive zone around the neoplasm and, as such, is removed en bloc with the tumor (39).


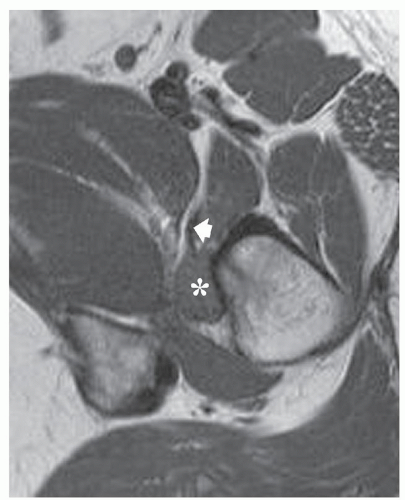
FIGURE 3.6 Field of view: Giant cell tumor of tendon sheath arising from the iliopsoas tendon in a 50-year-old woman presenting with hip pain. Columnated T1-weighted (TR/TE; 683/17) spin-echo MR image obtained with a 20-cm field of view shows the mass (asterisk) to be intimately associated with the iliopsoas tendon (arrow). This relationship was essential in suggesting the appropriate diagnosis preoperatively.

Other investigators have evaluated whether the rate of enhancement of soft tissue masses with gadolinium may help differentiate benign from malignant lesions (32, 36, 37, 38, 40, 41, 42). Enhancement reflects tissue vascularity and tissue perfusion, and, in general, malignant lesions show a greater enhancement, as well as a greater rate of enhancement. Van Rijswijk et al. (43) prospectively evaluated the use of static and dynamic gadopentetate dimeglumine-enhanced MR imaging compared to that of nonenhanced MR imaging for differentiating benign from malignant soft tissue lesions in order to evaluate which MR imaging parameters are most predictive of malignancy. In a study of 140 patients, they found that diagnostic accuracy was significantly improved for combined nonenhanced and contrast-enhanced MR imaging as compared to nonenhanced MR imaging alone. They also noted that dynamic contrast-enhanced MR imaging parameters were significantly superior to nonenhanced MR imaging parameters in predicting malignancy. Although dynamic contrast-enhanced imaging is promising, the overlap between benign and malignant lesions is sufficiently great that it is of limited practical value in any specific case (32, 44); consequently, we do not use it routinely.


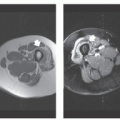
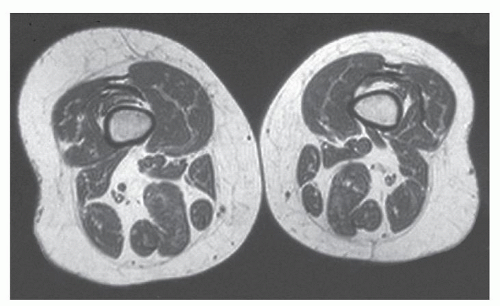
FIGURE 3.7 Contralateral extremity: Mild lipomatosis of the right lower extremity in a 54-year-old woman who presented with “fullness” around knee. Axial T1-weighted (TR/TE; 700/16) spin-echo MR image of both distal thighs shows increased adipose tissue on right as compared to contralateral side. Images of both distal thighs were obtained after no cause for clinical findings was found on axial images of right knee.

Information on tumor enhancement is not without a price. The use of intravenous contrast increases the length and cost of the examination. Although contrast-enhanced MR imaging may provide some additional information, it does not increase lesion conspicuity or replace the diagnostic value of T2-weighted imaging (41). Moreover, although the incidence of untoward reaction as a result of contrast administration is small, it is real. Severe reactions include hypotension, laryngospasm, bronchospasm, anaphylactoid reaction, and anaphylactic shock (45, 46, 47, 48, 49), as well as a full spectrum of less serious reactions. Jordan and Mintz (50) described a fatal reaction to gadopentetate dimeglumine that was presumed to be caused by an anaphylactic reaction with associated bronchospasm. Consequently, gadoliniumenhanced imaging should be reserved for those cases in which the results influence patient management.

Most recently, the association of nephrogenic systemic fibrosis (NSF) with the use of gadolinium-based contrast agents has focused greater attention on its routine administration (51, 52, 53). NSF was first reported in 2000 as a scleroderma-like fibrotic skin disorder in patients with renal insufficiency (52, 54). In a large 10-year study of 8,997 patients receiving gadolinium-based contrast, 15 (0.17%) developed NSF, all of whom had renal failure with glomerular filtration rates of less than 30 mL/min (51). In a study at four U.S. university tertiary care centers, involving over 216,000 patients, NSF was found to be more than 15-times more common with gadodiamide (Omniscan) than gadopentetate dimeglumine (Magnevist) (52). The development of NSF has also been associated with high cumulative doses of gadolinium-based contrast, leading to the recommendation that half-strength contrast be given to patients with glomerular filtration rates of less than 60 mL/min (51, 55, 56, 57). Costelloe et al. (57) compared matched-paired half-dose and full-dose gadolinium examinations in 29 patients, and found that experienced readers could not accurately distinguish a difference between the paired examinations in the majority of cases. A perceived enhancement difference was
noted in 41% of examinations; however, the majority of these were designated as mild.

There are several circumstances in which gadoliniumenhanced imaging is useful. We find it particularly valuable in the evaluation of possible hematomas. In such cases, contrast-enhanced imaging may reveal a small tumor nodule that may not be apparent within hemorrhage on conventional MR imaging (Fig. 3.8) (58, 59). Caution is required, however, in that the fibrovascular tissue within organizing hematomas may show enhancement (60). Gadolinium-enhanced imaging is also used to differentiate solid from cystic (or necrotic) lesions or to identify cystic or necrotic areas within solid tumors, with these necrotic or cystic areas showing no enhancement (37). This distinction may be difficult or impossible to detect on conventional T2-weighted images when both tumor and fluid show high signal intensity, welldefined margins, and homogeneous signal intensity, and it is especially important to guide biopsy. Care is needed, however, because myxoid lesions, such as intramuscular myxoma or myxoid liposarcoma, and hyaline cartilage lesions, such as synovial chondromatosis, may demonstrate little or mild enhancement and may mimic cysts or lesions with cystic components (Fig. 3.9). In general, ultrasound is fast and inexpensive, and an ideal method for differentiating solid from cystic lesions when the lesion is in an anatomic location accessible to sonographic evaluation.


Imaging Diagnosis


Despite the superiority of MR imaging in delineating soft tissue tumors, it remains somewhat limited in its ability to characterize them precisely, with many lesions demonstrating prolonged T1- and T2-relaxation times. Initially, investigators noted that the majority of lesions were nonspecific, with a correct histologic diagnosis reached on the basis of imaging studies alone in only approximately 25% to 35% of cases (5, 6, 7). More recently, Gielen et al. (61) correctly diagnosed 50% (227 of 455) of histologically confirmed cases using imaging and available clinical information, likely reflecting the greater collective experience with tumor imaging and the importance of clinical data. The cases in which a specific diagnosis may be made or strongly suspected using an analysis of the MR imaging features is increasing (62, 63, 64). Imaging diagnosis is usually made on the basis of lesion signal intensity, pattern of growth, location, and associated “signs” and findings. The lesions with characteristic MR imaging features are listed in Table 3.1.

MR imaging may reveal a nonspecific appearance. In such cases, it is often not possible to establish a meaningful differential diagnosis or to determine reliably whether a lesion is benign or malignant. In such situations, it is useful to formulate a suitably ordered differential diagnosis on the basis of knowledge of tumor prevalence, patient age, and lesion anatomic location. This differential diagnosis can be further refined by considering clinical history and radiologic features, such as pattern of growth, signal intensity, and localization (subcutaneous, intramuscular, intermuscular, etc.). Table 3.2 lists the most common lesions in each compartment. The most common malignant and benign lesions, by tumor location and patient age, are reviewed in Chapter 2. The use of this prevalence data is demonstrated by the diagnostic examples at the end of this chapter.


Benign versus Malignant


Although there is general agreement on the diagnostic value of MR in many cases, the issue of whether MR can reliably distinguish benign from malignant is much less clear. One study suggested that MR can differentiate benign from malignant masses in greater than 90% of

cases based on the morphology of the lesion (6). Criteria used for predicting benign lesions included smooth, well-defined margins, small size, and homogeneous signal intensity, especially on T2-weighted images. Other studies, however, note that malignant lesions may appear as smoothly marginated, homogeneous masses, and MR cannot reliably distinguish benign from malignant processes (2, 3, 4, 5, 7, 37). This discrepancy likely reflects differences within the studied populations, as well as the criteria utilized for their assessment.


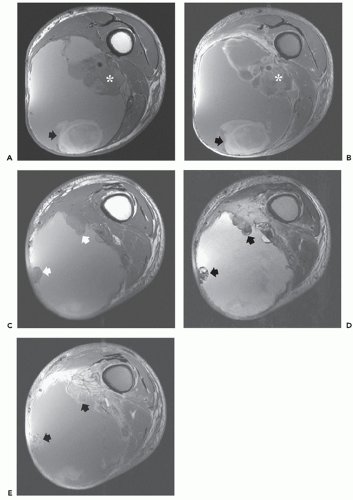
FIGURE 3.8 Hemorrhagic tumor evaluation: Hemorrhagic mass in the leg of a 57-year-old man presenting with a rapidly enlarging thigh mass. Axial T1-weighted (TR/TE; 608/16) (A) and fat-suppressed enhanced T1-weighted (TR/TE; 635/16) (B) spin-echo MR images show a large hemorrhagic mass in the thigh. Note focus of subacute blood posteriorly (arrows) with enhancing viable tumor (asterisk) around superficial femoral artery. Axial T1-weighted (TR/TE; 608/16) (C) and conventional T2-weighted (TR/TE; 2150/80) (D) spin-echo MR images more distally show peripheral nodules (arrows) with intermediate-to-decreased signal intensity. E: Fat-suppressed T1-weighted (TR/TE; 635/16) spin-echo MR image following contrast administration shows enhancement of the nodules (arrows), indicating viable tumor. Biopsy showed highgrade undifferentiated pleomorphic sarcoma.


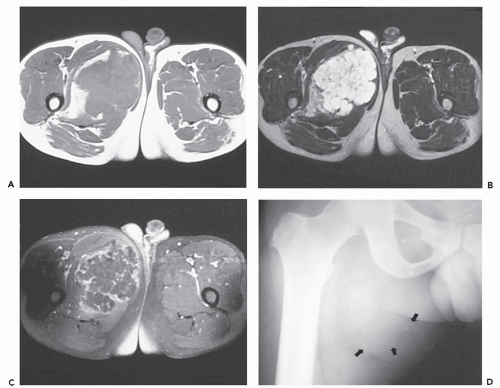
FIGURE 3.9 Cyst mimic: Extra-articular synovial chondromatosis in the thigh of a 35-year-old man, mimicking loculated fluid. A: Axial T1-weighted (TR/TE; 763/18) spin-echo MR image shows large lobulated mass, with signal intensity similar to that of skeletal muscle, in adductor compartment. B: Corresponding conventional T2-weighted (2912/80, TR/TE) spin-echo MR image shows lesion to have signal intensity greater than that of fat. C: Fat-suppressed axial T1-weighted (475/18, TR/TE) spin-echo MR image following contrast administration shows peripheral and septal enhancement, suggesting loculated fluid. D: Radiograph shows nonspecific calcifications (arrows) within mass.

When the MR images of a lesion are not sufficiently characteristic to suggest a specific diagnosis, a conservative approach is warranted. Malignancies, by virtue of their very nature and potential for autonomous growth, are generally larger and more likely to outgrow their vascular supply with subsequent infarction, necrosis, and heterogeneous signal intensity on T2-weighted spin-echo MR images. Consequently, the larger the mass and the greater its heterogeneity, the greater is the concern for malignancy. Only 5% of benign soft tissue tumors exceed 5 cm in diameter (65, 66). In addition, most malignancies are deep lesions, whereas only about 1% of all benign soft tissue tumors are deep (65, 66). Although these figures are based on surgical, not imaging series, these trends are likely still valid for radiologists. Also, an increasing percentage of malignant lesions are found with increasing age. Location is also important in predicting benign or malignant lesions (67, 68). In the Armed Forces
In the Armed Forces Institute of Pathology (AFIP) series, for example, while 70% of retroperitoneal lesions (for all age groups) were malignant, the malignancy rate for hand and wrist lesions was only 15% (Table 3.3) (67, 68).


TABLE 3.1 Specific diagnoses that may be made or suspected on the basis of MR imaging


Vascular lesions


Aneurysm and pseudoaneurysm


Arteriovenous hemangioma (arteriovenous malformation)


Glomus tumor


Hemangioma


Hemangiomatosis (angiomatosis)


Lymphangioma


Lymphangiomatosis


Bone- and cartilage-forming lesions


Extraskeletal chondroma


Myositis ossificans


Panniculitis ossificans


Synovial chondromatosis


Fibrous lesions


Elastofibroma


Fibroma of tendon sheath


Fibromatosis coli


Musculoaponeurotic fibromatosis


Superficial fibromatosis


Lipomatous lesions


Lipoma


Lipoma arborescens


Lipoma of tendon sheath


Lipomatosis


Lipomatosis of nerve


Lipoblastoma


Lipoblastomatosis


Liposarcoma


Periosteal lipoma


Synovial lipoma


Tumor-like lesions


Abscess


Calcific myonecrosis


Cystic adventitial disease


Epidermal inclusion cyst


Fat necrosis


Ganglion


Granuloma annulare


Hematoma


Hydroxyapatite crystal disease


Intramuscular myxoma


Myonecrosis


Popliteal (synovial) cyst


Tophus


Tumoral calcinosis


Peripheral nerve lesions


Morton neuroma


Neurofibroma


Schwannoma


Traumatic (stump) neuroma


Synovial lesions


Giant cell tumor of tendon sheath


Nodular synovitis


Pigmented villonodular synovitis


Synovial chondromatosis


Synovial sarcoma


When sarcomas are superficial, they generally have a less aggressive biologic behavior than do deep lesions (69). As a rule, most malignancies grow as deep spaceoccupying lesions, enlarging in a centripetal fashion (69), pushing, rather than infiltrating, adjacent structures (although clearly there are exceptions to this general rule). As they enlarge, a pseudocapsule of fibrous connective tissue is formed around them due to compression and layering of normal tissue, associated inflammatory reaction, and vascularization (Fig. 3.10) (69). They generally respect fascial borders and remain within anatomic compartments until late in their course (69). It is this pattern of growth that gives most sarcomas relatively welldefined margins (Fig. 3.11), in contradistinction to the general concepts of margin definition used in the evaluation of osseous tumors.

Although well-defined margins surrounding sarcomas are common, a rind of increased signal intensity may be seen surrounding tumors on fluid-sensitive sequences. This rind is often termed peritumoral edema or reactive change and is composed of inflammatory cell infiltration, vascular congestion, muscle atrophy, as well as edema (70, 71). These areas may also contain tumor cells, either singly or in clusters, and are identified in as many as 67% of patients with high-grade sarcomas (70). Malignant cells are usually located within 1 cm of the tumor margin, but can be found at a distance of up to 4 cm (Fig. 3.12). Although our experience with carcinoma metastatic to soft tissue is limited, we have generally found these lesions to be more infiltrative, with ill-defined margins, often violating fascial planes and anatomic compartments. This pattern of growth is quite
different from that seen in most primary soft tissue tumors (Fig. 3.13).


TABLE 3.2 Most common lesions by compartment


Anatomic location


Intermuscular


Extraskeletal myxoid chondrosarcoma


Fibromatosis


Ganglion


Leiomyosarcoma


Nodular fasciitis


Neurogenic tumors


Synovial cyst


Intra-articular


Lipoma arborescens


Nodular synovitis


Pigmented villonodular synovitis


Synovial chondromatosis


Intramuscular


Angiomatous lesions


Lipoma


MFH (malignant fibrous histiocytoma)


Myxoma


Sarcoma (not specific)


Undifferentiated pleomorphic sarcoma


Juxta-articular


Ganglion


Giant cell tumor of tendon sheath


Myxoma


Synovial cyst


Synovial hemangioma


Synovial sarcoma


Tumoral calcinosis


Subcutaneous


Angiomatous lesions


Benign fibrous histiocytoma


DFSP (dermatofibrosarcoma protuberans)


Epidermal inclusion cyst


Fat necrosis


Granuloma annulare


Leiomyosarcoma


Lipoma


Lymphoma


Myxofibrosarcoma


Myxoma


Nodular fasciitis


Skin appendage tumor


Tendinous/musculoaponeurotic


Clear cell sarcoma


Giant cell tumor of tendon sheath (nodular tenosynovitis)


Fibroma of tendon sheath


Fibromatosis


Increased signal intensity in the skeletal muscle surrounding a musculoskeletal mass on T2-weighted spin-echo MR images or other fluid-sensitive sequences (i.e., STIR) is also suggested as a reliable indicator of malignancy (71, 72). These results are based on studies in which both bone and soft tissue lesions were evaluated. Although this increased signal intensity may be seen with malignancy, in our experience this finding is quite nonspecific. In fact, prominent high signal intensity surrounding a soft tissue mass more commonly suggests an inflammatory process, abscess, myositis ossificans, local trauma, hemorrhage, biopsy, or radiation therapy rather than a primary soft tissue neoplasm (Fig. 3.14).

Gadolinium imaging is also proposed as useful in differentiating benign from malignant soft tissue lesions, with malignant lesions showing a greater enhancement, as well as a greater rate of enhancement (38, 41, 44, 46). Enhancement reflects tissue vascularity and tissue perfusion, and, in general, the rate of enhancement of malignant lesions is greater than that seen in benign lesions. However, the overlap between benign and malignant is so great, in our opinion, it is of little practical value in any specific case (44). When a lesion has a nonspecific MR appearance, one is ill-advised to suggest that a lesion is benign or malignant based solely on its MR imaging characteristics and rate or degree of enhancement.

De Schepper et al. (73) performed a multivariate statistical analysis of 10 imaging parameters, individually and in combination. These researchers found that malignancy was predicted with the highest sensitivity when lesions had a high signal intensity on T2-weighted images, were larger than 33 mm in diameter, and had heterogeneous signal intensity on T1-weighted images. The signs that had the greatest specificity for malignancy included tumor necrosis, bone or neurovascular involvement, and mean diameter of more than 66 mm (Fig. 3.15). In a recent study of 548 patients by Gielen and colleagues (61) in which imaging and clinical data were available, an accuracy of 85% was reported in differentiating between benign and malignant lesions.


Spectroscopy


TABLE 3.3 Benign and malignant tumor distribution by location and age


Age


Number


Malignant Benign


% Malignant % Benign


Hand and wrist


Upper extremity


Prox. limb


Foot and ankle


Lower extremity


Hip and buttocks


Head and neck


Trunk


Retro.


0-5


1,330


274


20.6


11 (10%)a


31 (25%)


16 (17%)


11 (13%)


53 (23%)


22 (24%)


60 (20%)


50 (20%)


20 (51%)


1,056


79.4


97 (90%)


94 (75%)


80 (83%)


76 (87%)


180 (77%)


70 (76%)


237 (80%)


203 (80%)


19 (49%)


6-15


1,942


578


29.8


43 (15%)


92 (34%)


39 (35%)


53 (25%)


128 (37%)


38 (41%)


65 (22%)


91 (32%)


29 (60%)


1,364


20.2


235 (85%)


182 (66%)


73 (65%)


161 (75%)


216 (63%)


55 (59%)


228 (78%)


195 (68%)


19 (40%)


16-25


3,702


1,103


29.8


86 (17%)


138 (27%)


74 (30%)


90 (31%)


338 (39%)


83 (40%)


89 (24%)


161 (26%)


44 (38%)


2,599


70.2


420 (83%)


376 (73%)


172 (70%)


205 (69%)


484 (61%)


122 (60%)


287 (76%)


462 (74%)


71 (62%)


26-35


4,409


1,283


29.1


83 (14%)


133 (23%)


75 (28%)


106 (29%)


357 (42%)


119 (39%)


97 (19%)


245 (46%)


68 (46%)


3,126


70.9


493 (86%)


442 (77%)


196 (72%)


263 (71%)


534 (58%)


185 (61%)


401 (81%)


533 (54%)


79 (54%)


36-45


3,880


1,215


31.3


63 (12%)


103 (22%)


94 (34%)


83 (29%)


351 (43%)


125 (47%)


97 (21%)


188 (31%)


111 (56%)


2,665


68.7


450 (88%)


368 (78%)


184 (66%)


199 (71%)


461 (57%)


143 (53%)


358 (79%)


415 (69%)


87 (44%)


46-55


3,420


1,304


38.1


40 (10%)


106 (30%)


98 (38%)


65 (27%)


383 (52%)


128 (53%)


86 (20%)


194 (39%)


204 (73%)


2,116


61.9


343 (90%)


243 (70%)


162 (62%)


174 (73%)


358 (48%)


115 (47%)


345 (80%)


300 (61%)


76 (27%)


56-65


3,754


1,741


46.4


44 (13%)


186 (50%)


90 (35%)


90 (36%)


537 (62%)


155 (60%)


104 (24%)


228 (39%)


307 (76%)


2,013


53.6


287 (87%)


189 (50%)


166 (65%)


159 (64%)


325 (38%)


102 (40%)


322 (76%)


364 (61%)


99 (24%)


66-75


2,831


1,604


56.7


45 (21%)


165 (55%)


90 (48%)


70 (43%)


481 (73%)


152 (67%)


138 (40%)


200 (48%)


263 (86%)


1,227


43.3


174 (79%)


135 (45%)


97 (52%)


93 (57%)


179 (27%)


75 (33%)


210 (60%)


220 (52%)


44 (14%)


76


1,586


1,082


68.2


34 (33%)


139 (76%)


43 (48%)


64 (72%)


345 (81%)


91 (75%)


102 (50%)


111 (59%)


153 (85%)


504


31.8


68 (67%)


45 (24%)


47 (52%)


25 (28%)


80 (19%)


31 (25%)


104 (50%)


76 (41%)


28 (15%)


Total


26,854


10,184


37.9


449 (15%)*


1,093 (35%)


619 (34%)


632 (32%)


2,973 (51%)


913 (50%)


838 (25%)


1,468 (35%)


1,199 (70%)


16,670


62.1


2,567 (85%)*


2,974 (65%)


1,177 (66%)


1,355 (68%)


2,817 (49%)


898 (50%)


2,492 (75%)


2,768 (65%)


522 (30%)


% of all lesions


11.2


11.8


6.7


7.4


21.5


6.7


12.5


15.8


6.4


a 11 (10%) 97 (90%) Indicates 11 malignant and 97 benign hand and wrist lesions for ages 0-5 years and that 10% of the lesions are malignant and 90% are benign.


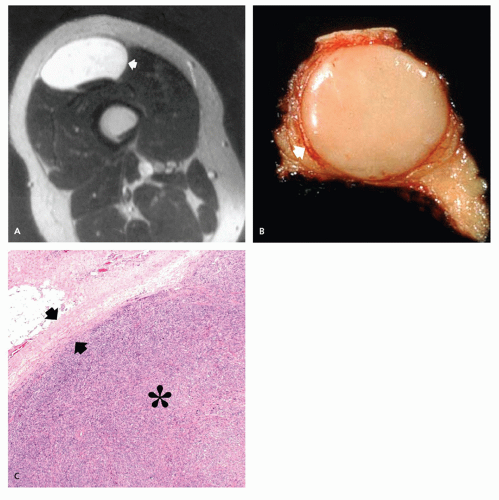
FIGURE 3.10 Pseudocapsule: Myxoid liposarcoma in the thigh of a 26-year-old man. A: Axial T2-weighted (TR/TE; 2000/80) spin-echo MR image shows a homogeneous well-defined mass with an internal cyst-like appearance (arrow). B: Gross photograph from a different patient with a high-grade sarcoma shows the thin pseudocapsule (arrow) at the periphery of the mass. C: High-power photomicrograph shows the pseudocapsule (arrows) at the margin of the sarcoma (asterisk).

MR spectroscopy is a noninvasive metabolic imaging technique that has shown value in the identification of malignant tumor markers (74). Phosphorus-31 (P-31) nuclear MR spectroscopy detects phosphorus-containing metabolites in intact living tissue (75). Shinkwin et al. (75) evaluated 18 patients with soft tissue masses and found that soft tissue tumors had a significantly higher proportion of phosphate in the low energy portion of the P-31 spectrum, with a concomitant decrease in phosphocreatine as compared with that in normal muscle, and a greater relative amount of phosphomonoesters, inorganic phosphate, and phosphodiesters. The great variability in tumor size, necrosis, and muscle contamination makes spectroscopy of limited value in separating benign from malignant lesions. Sostman et al. (76) found that P-31 spectroscopy could be useful in evaluating tumor necrosis; consequently, it could be useful in establishing the prognosis of patients with soft tissue sarcomas.

1H MR spectroscopy is used routinely in neuroradiology, but only recently was applied to musculoskeletal imaging (77, 78, 79, 80, 81). In neuroradiology, proton spectroscopic peaks provide insight into brain chemistry; with N-acetyl aspartate (NAA) being a marker for normal neurons, creatine a marker for energy utilization, and
choline a marker for membrane turnover (82). Musculoskeletal imaging has focused on choline concentration, which has been shown to be elevated in malignant tumors (77, 83).


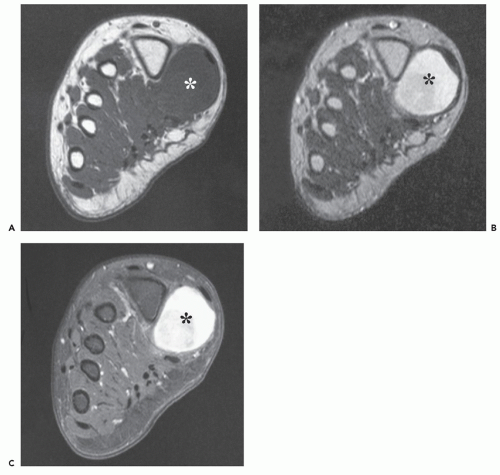
FIGURE 3.11 Well-defined high-grade malignancy with pseudocapsule: Synovial sarcoma in the foot of a 10-year-old girl. Coronal T1-weighted (TR/TE; 450/12) (A) and T2-weighted (TR/TE; 2000/80) (B) spin-echo MR images shows a well-defined mass (asterisk) within the flexor halluces brevis muscle. C: Fat-suppressed axial T1-weighted (TR/TE; 850/12) spin-echo MR image following contrast administration shows intense diffuse enhancement (asterisk).

Wang and colleagues (84) reported the use of 1H MR spectroscopy in the evaluation of 36 musculoskeletal tumors. They noted that they could differentiate accurately between benign and malignant tumors by detection of choline. They reported a sensitivity of 95%, specificity of 89%, and an accuracy of 89%. More recent studies have yielded lesser results, noting choline peaks in benign and inflammatory lesions (74, 78, 81). In a comprehensive review of proton MR spectroscopy, Subhawong and colleagues (74) reported a pooled analysis of previously published studies, noting a strong association between the presence of a choline peak and malignancy, with a sensitivity and specificity of 88% and 68%, respectively (Fig. 3.16). The positive predictive value for malignancy in the presence of a discrete choline peak was 73% and the negative predictive value was 86%. Hsieh et al. (81), in an initial study of the effect of chemotherapy on malignant musculoskeletal tumors in three patients, noted that a decline of choline following treatment correlated with tumor response, decreased tumor size, and decreased contrast enhancement.

Although spectroscopy is promising, it is technically demanding and there are a number of factors that limit its clinical utility (74). In contrast to the brain,
musculoskeletal lesions are much more heterogeneous, with greater variation in local field homogeneity (74). In addition, the great variability of coils used to optimize musculoskeletal imaging complicates comparison of quantified results (74).

Only gold members can continue reading. Log In or Register to continue

Stay updated, free articles. Join our Telegram channel

Jun 19, 2016 | Posted by in NUCLEAR MEDICINE | Comments Off on Imaging of Soft Tissue Masses

Full access? Get Clinical Tree

Get Clinical Tree app for offline access