Abstract
Objective
Isocitrate dehydrogenase (IDH) is the most important molecular marker of glioma and is highly correlated to the diagnosis, treatment, and prognosis of patients. We proposed a real-time diagnosis method for IDH status differentiation based on automatic analysis of intraoperative contrast-enhanced ultrasound (CEUS) video.
Methods
Inspired by the Time Intensity Curve (TIC) analysis of CEUS utilized in clinical practice, this paper proposed an automatic CEUS video analysis method called ATAN (Automatic TIC Analysis Network). Based on tumor identification, ATAN automatically selected ROIs (region of interest) inside and outside glioma. ATAN ensures the integrity of dynamic features of perfusion changes at critical locations, resulting in optimal diagnostic performance. The transfer learning mechanism was also introduced by using two auxiliary CEUS datasets to solve the small sample problem of intraoperative glioma data.
Results
Through pretraining on 258 patients on two auxiliary cohorts, ATAN produced the IDH diagnosis with accuracy and AUC of 0.9 and 0.91 respectively on the main cohort of 60 glioma patients (mean age, 50 years ± 14, 28 men) Compared with other existing IDH status differentiation methods, ATAN is a real-time IDH diagnosis method without the need of tumor samples.
Conclusion
ATAN is an effective automatic analysis model of CEUS, with the help of this model, real-time intraoperative diagnosis of IDH with high accuracy can be achieved. Compared with other state-of-the-art deep learning methods, the accuracy of the ATAN model is 15% higher on average.
Introduction
Glioma, derived from glial or precursor cells, is usually considered to be the most common central nervous system (CNS) malignancies [ ]. The fifth edition of the World Health Organization Classification of Tumors of the Central Nervous System (WHO CNS5) [ ] affirms the significance of molecular biomarkers in the diagnosis of glioma [ , ].
Being a key regulatory gene in the occurrence and development of glioma, IDH also impacts tumor metabolism. Gliomas with IDH mutations generally exhibit a more favorable prognosis compared to tumors with wild type IDH, highlighting the impact of distinct IDH mutation status on surgical planning. The prediction of IDH mutation status is also instructive for the extent of tumor resection. Therefore, the detection of IDH mutation status can help determine the nature of the tumor and facilitate targeted therapy [ ]. Traditional IDH testing methods rely on tumor samples, which have obvious defects due to the randomness of single-point sampling, tumor heterogeneity, high cost, and inevitably invasive surgery [ ]. In recent years, advances in medical imaging and ultrasound have made real-time genetic diagnosis a possibility [ ].
Radiomics-based genetic diagnosis using preoperative MRI and CT has already shown promise in revealing the relationship between imaging features and genetic characteristics [ ]. Intraoperative genetic diagnosis is an even more promising area, as it can provide more effective real-time information for surgical navigation. While several techniques for intraoperative gene diagnosis of gliomas exist, such as intraoperative magnetic resonance imaging and Raman spectroscopy [ ], contrast-enhanced ultrasound (CEUS) has shown great potential due to its real-time performance and ability to display rich tumor perfusion and morphological information [ ].
Currently, the most common method for analyzing CEUS videos involves extracting and analyzing time-intensity curve (TIC) features. This analysis method for the TIC sequences has been applied to the liver and other diseases [ , ]. However, this approach has limitations, including inability to dynamically capture ROIs in real time and the extraction of insufficient information from TIC sequences [ , ]. In this paper, we propose an automatic TIC analysis network (ATAN) that addresses these challenges. The technical goal of the ATAN is to solve the following two difficulties: first, automatic acquisition subsequent ROIs with critical perfusion features inside and outside the tumor based only on the ROIs of the first frame; second, ROI sequences rather than the entire video are fed into the network for automatic TIC analysis, thereby discarding large amounts of redundant information in the video to reduce computational costs while improving diagnostic performance.
Materials and methods
Materials
This study was approved by the ethics committee of Huashan Hospital (No.: 2021-838), and the informed consent was obtained from all patients. We retrospectively analyzed glioma cases undergoing surgical resection at Huashan Hospital, Fudan University. A total of 318 cases from three different datasets were used in this study. 60 glioma cases with complete molecular features and histology information were included as main cohort ( Table 1 ). In order to solve the problem of small sample size, we introduced an auxiliary cohort to pretrain the model, including CEUS videos from 150 liver tumor cases and 108 breast tumor cases ( Table 2 ). Among them, breast datasets are categorized as 44 benign cases (mean age, 43 years ± 11, 44 women) and 64 malignant cases (mean age, 51 years ± 12, 64 women), and liver datasets are categorized as 100 HCC (Hepatocellular Carcinoma) cases (mean age, 52 years ± 12, 85 men) and 50 ICC (Intrahepatic Cholangiocarcinoma) cases (mean age, 56 years ± 11, 31 men).
| Cohort | Main Cohort | ||
|---|---|---|---|
| Type | Glioma | ||
| Classification | IDH MUT | IDH WT | |
| Number of patients | 24 | 36 | |
| Diagnosis | GBM | 0 | 28 |
| O | 8 | 2 | |
| A | 16 | 6 | |
| WHO grade | 2 | 16 | 1 |
| 3 | 4 | 7 | |
| 4 | 4 | 28 | |
| Location | Frontal lobe | 17 | 11 |
| Temporal lobe | 4 | 14 | |
| Parietal lobe | 1 | 4 | |
| Occipital lobe | 0 | 1 | |
| Midline | 2 | 6 | |
| Total cases | 60 | ||
| Cohort | Main Cohort | Auxiliary Cohort | |||||
|---|---|---|---|---|---|---|---|
| Type | Glioma | Liver | Breast | ||||
| Classification | IDH MUT | IDH WT | HCC | ICC | Malignant | Benign | |
| Age | 45 ± 13 | 54 ± 15 | 52 ± 12 | 56 ± 11 | 51 ± 12 | 43 ± 11 | |
| Gender | F | 11 | 21 | 15 | 19 | 64 | 44 |
| M | 13 | 15 | 85 | 31 | 0 | 0 | |
| Number of patients | 24 | 36 | 100 | 50 | 64 | 44 | |
| Total cases | 60 | 150 | 108 | ||||
The main cohort consisted of a retrospective cohort and a prospective cohort. The retrospective cohort of 40 cases, collected from June 2021 to August 2022, are used to develop and train the method. We use the independent prospective cohort consisting of 20 cases collected from September 2022 to November 2022 for further test. Figure 1 a summarizes the patient and glioma characteristics of all glioma cases based on WHO CNS5. Since TERTp mutation serves as a diagnostic indicator for glioblastomas of IDH wild type with a WHO grade of 4, and it is highly correlated with better prognosis. We additionally collected the TERTp mutation statuses of these cases, providing supplementary information. The incidence of TERTp mutation status in IDH mutant and IDH wild type cases are shown in Figure 1 b separately. A comparison between the classification of molecular features and the classification of histology features is shown in the Sankey diagram ( Fig. 1 c). Abbreviations: O, oligodendroglioma; A, astrocytoma; GBM, glioblastoma; MUT, mutant; WT, wild type; NA, not available; codel, codeletion; TERTp, TERT promoter; WHO CNS5, the 2021 World Health Organization Classification of Tumors of the Central Nervous System.

Methods
Study design and main innovations
All patients included in the main cohort underwent glioma surgery. The CEUS videos used in this study were intraoperatively collected, and the micro-convex probe (C2-7, micro-convex array) was used to observe and locate the intracranial tumor (Platform: Logiq E9, GE Medical Systems). When the ultrasound contrast agent SonoVue was intravenously injected (2.4 mL [5 mg/mL]) and flushed with 5 mL saline, a dynamic CEUS video of about 90 s was recorded in the static facet, with more than 45 s enhanced time [ , ]. We exported DICOM images of angiographic videos for analysis, and we have centered all TGC adjustments in image acquisition. These parameter settings remained constant during whole data acquisition process. In addition, we take the results of pathological detection as the ground truth. In the process of pathological detection, H&E-stained images with 20x magnification were acquired on a Digital Microscopic Imaging System Ocus®. The size of one H&E image is 43008 × 38912. H&E images were stored in ScanScope Virtual Slide (SVS) format. The detection of molecular typing was performed using the next generation sequencing (NGS).
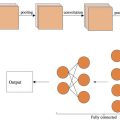
The proposed IDH diagnosis process mainly includes three modules: automatic ROI tracking, ATAN network analysis and transfer learning mechanism. The flow diagram of this method is shown in Figure 2 :
- 1.
The automatic ROI tracking method ( Fig. 2 a) based on the Bhattacharyya coefficient calculation is proposed to obtain the ROI inside and outside the tumor with important perfusion features, which improves the accuracy of TIC sequences acquisition.
- 2.
The ATAN model is proposed to predict IDH mutation status and integrates the characteristics of perfusion changes at critical locations ( Fig. 2 b), with optimal diagnostic performance.
- 3.
The transfer learning mechanism ( Fig. 2 c) is introduced with two CEUS datasets of different diseases as auxiliary cohorts to solve the small sample size problem of intraoperative glioma data.

Automatic ROI tracking
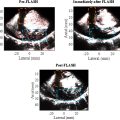
To ensure the accuracy of glioma locations, we optimized the method of ROI tracking. Object location tracking is critical in video processing, as it largely determines the reliability and capability of downstream tasks. Traditional target tracking algorithms are mostly based on models such as frame differencing algorithm, mean-shift method, or template matching, etc [ , ]. However, these methods are generally more suitable for the case of objects with large displacement, and these advanced algorithms are not conducive to obtaining the contrast intensity value while tracking, resulting in the separation of various tasks. Furthermore, during intraoperative epidural ultrasound, a microconvex probe, wrapped in a sterile sleeve, was employed to identify and locate the intracranial lesion before resection. The dynamic Contrast-Enhanced Ultrasound (CEUS) video was recorded in the Digital Imaging and Communications in Medicine (DICOM) format, using a static scan slice for approximately 90 seconds after the injection of the contrast agent. In this study, we introduced a new method for automatic ROI tracking that is beneficial for the pixel-wise tracking with tiny movements (average 7.4 pixels, range: 0–30 pixels). Figure 3 provides a detailed description of the procedures of automatic ROI tracking.

As illustrated in Figure 3 , we improved the algorithm on the basis of using minor manual annotation, and designed the automatic contrast intensity extraction method shown in the figure. For clear illustration, we take the ROI tracking inside the tumor as an example, and the external tumor ROI tracking method is similar:
(i) Each gray-scale image containing only the tumor can be easily obtained by multiplying the image of the frame with the manual annotation.
(ii) After the gray-scale histograms of two adjacent frames are obtained, the Bhattacharyya coefficient [ ] of the two histograms (range: 0–1) can be calculated. The formula of the coefficient calculation is shown in Eq. (1) .
B(P,P′)=∑i=1NP(i)*P′(i)
where <SPAN role=presentation tabIndex=0 id=MathJax-Element-2-Frame class=MathJax style="POSITION: relative" data-mathml='P’>?P
P
and <SPAN role=presentation tabIndex=0 id=MathJax-Element-3-Frame class=MathJax style="POSITION: relative" data-mathml='P′’>?′P′
P ′
represent the normalized histogram data of adjacent images, and <SPAN role=presentation tabIndex=0 id=MathJax-Element-4-Frame class=MathJax style="POSITION: relative" data-mathml='i’>?i
i
represents data distribution of each pixel value. Every value of the same <SPAN role=presentation tabIndex=0 id=MathJax-Element-5-Frame class=MathJax style="POSITION: relative" data-mathml='i’>?i
i
is calculated and summed as in Eq. (1) , and the image similarity value (Bhattacharyya coefficient) is finally achieved. A coefficient threshold of 0.95 is set to judge whether the ROI needs to be updated in step (ⅲ).
(iii) The gray value ranges of ROI in adjacent frames are calculated respectively, which are represented by (A, B) and (C, D). Updating ROI is based on removing pixels that do not fall into the (A, B) range and recalculating the center of the remaining pixels.
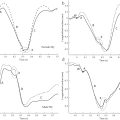
Therefore, the purpose of obtaining and tracking pixel-level ROI frame by frame is successfully achieved, which also provides convenience for the next step of extracting the intensity of contrast when tracking. As shown in Figure 2 a, we match the ROI position obtained in the previous step to the contrast part frame-by-frame (the symmetrical characteristics of the dual-modal video). Since the TIC of a single pixel is greatly affected by the flow of contrast agent and the average intensity of a region is directly proportional to the perfusion level of the region, therefore, in this study, we adopt a more comprehensive approach. Instead of relying on the luminance value of a single pixel point of a certain ROI within a frame, we calculate the average luminance value across all pixel points within each ROI. This strategy ensures a more robust representation of the contrast-enhanced portion’s dynamics. Considering the imbalance of each pixel intensity of the contrast part, we take the mean value within the ROI to obtain the contrast value. The final time-intensity curve (TIC) is achieved with the frame number as the X-axis and the contrast intensity value as the Y-axis [ ].
ATAN network analysis
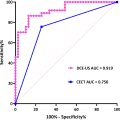
To further analyze the extracted TIC, we utilize the Temporal Convolutional Network (TCN) shown in the lower part of Figure 2 b. To better highlight the advantages of the method proposed in this paper (classification accuracy and generalization), we compare it with traditional TIC analysis methods. Traditional methods for curve analyses usually extract various features of the curve in advance to analyze perfusion changes, such as PE (peak enhancement), S (area under curve), RT (rising time), and other hemodynamic parameters. Table 3 lists nine quantitative parameters calculated from TIC. These features are put into machine learning models (such as SVM) for further diagnosis and prediction [ ]. In detail, the hemodynamic parameters from Time-Intensity Curves (TIC) of IDH mutant and IDH wild type were extracted ( Table 3 ) in advance. These parameters were then analyzed using SPSS (version 22.0, IBM Corp., Armonk, NY, USA), with statistical significance set at a p -value less than 0.05. Subsequently, parameters with statistical significance were input directly into a Support Vector Machine (SVM) for the binary classification task (IDH mutant and IDH wild type) across all 60 glioma cases. The dataset was divided into 80% for training and 20% for testing. The classification accuracy was computed, and the Receiver Operating Characteristic (ROC) curve was plotted. The Area Under the Curve (AUC), sensitivity, and specificity were therefore calculated ( Table 7 ). While in this study, we directly input the TIC of retrospective data into the neural network for training and perform five-fold cross validation, the independent data set composed of prospective data are tested to obtain the final results.
| Parameters | Definition |
|---|---|
| PE (peak enhancement) | <SPAN role=presentation tabIndex=0 id=MathJax-Element-6-Frame class=MathJax style="POSITION: relative" data-mathml='PE=f(t)max’>??=?(?)???PE=f(t)max P E = f ( t ) m a x |
| S (area under curve) | <SPAN role=presentation tabIndex=0 id=MathJax-Element-7-Frame class=MathJax style="POSITION: relative" data-mathml='S=∫t0t1f(t)•d(t)’>?=∫?0?1?(?)•?(?)S=∫t0t1f(t)•d(t) S = ∫ t 0 t 1 f ( t ) • d ( t ) |
| RT (rising time) | <SPAN role=presentation tabIndex=0 id=MathJax-Element-8-Frame class=MathJax style="POSITION: relative" data-mathml='RT=tp−t0′>??=??−?0RT=tp−t0 R T = t p − t 0 |
| RS (rising slope) | <SPAN role=presentation tabIndex=0 id=MathJax-Element-9-Frame class=MathJax style="POSITION: relative" data-mathml='RS=f(tp)−f(t0)tp−t0′>??=?(??)−?(?0)??−?0RS=f(tp)−f(t0)tp−t0 R S = f ( t p ) − f ( t 0 ) t p − t 0 |
| DS (descending slope) | <SPAN role=presentation tabIndex=0 id=MathJax-Element-10-Frame class=MathJax style="POSITION: relative" data-mathml='DS=f(tp)−f(t1)tp−t1′>??=?(??)−?(?1)??−?1DS=f(tp)−f(t1)tp−t1 D S = f ( t p ) − f ( t 1 ) t p − t 1 |
| RBF (regional blood flow) | <SPAN role=presentation tabIndex=0 id=MathJax-Element-11-Frame class=MathJax style="POSITION: relative" data-mathml='RBF=St1−t0′>???=??1−?0RBF=St1−t0 R B F = S t 1 − t 0 |
| WOI (wash-out intensity) | <SPAN role=presentation tabIndex=0 id=MathJax-Element-12-Frame class=MathJax style="POSITION: relative" data-mathml='WOI=St1−tp’>???=??1−??WOI=St1−tp W O I = S t 1 − t p |
| MTT (mean transit time) | <SPAN role=presentation tabIndex=0 id=MathJax-Element-13-Frame class=MathJax style="POSITION: relative" data-mathml='MTT=t1−f−1(12f(tp))min’>???=?1−?−1(12?(??))???MTT=t1−f−1(12f(tp))min M T T = t 1 − f − 1 ( 1 2 f ( t p ) ) m i n |
| PI (perfusion index) | <SPAN role=presentation tabIndex=0 id=MathJax-Element-14-Frame class=MathJax style="POSITION: relative" data-mathml='PI=SMTT’>??=????PI=SMTT P I = S M T T |
Related posts:
 WFUMB Commentary Paper on Artificial intelligence in Medical Ultrasound Imaging
 Quantitative Liver Fat Assessment by Handheld Point-of-Care Ultrasound: A Technical Implementation and Pilot Study in Adults
 Automatic Segmentation of Sylvian Fissure in Brain Ultrasound Images of Pre-Term Infants Using Deep Learning Models
 Added Value of Dynamic Contrast-Enhanced Ultrasound Analysis for Differential Diagnosis of Small (≤20 mm) Solid Pancreatic Lesions
 Assessment of Coronary Microcirculation with High Frame-Rate Contrast-Enhanced Echocardiography
 Ultrasonographic Measurement of Common Carotid Artery Wall Pulse Dynamics and Longitudinal Motion – Method Validation and a Novel Parameter Ratio
Stay updated, free articles. Join our Telegram channel

Full access? Get Clinical Tree


