Highlights
- •
At equivalent bone mineral density, osteoporotic vertebral fractures are more frequent in patients who had deficits in their paravertebral and psoas muscles.
- •
Paravertebral and psoas muscle deficit is associated with occurrence of vertebral fracture in osteoporosis.
- •
Muscle atrophy and fatty infiltration should be evaluated in osteoporotic patients with vertebral fracture.
Abstract
Objective
To determine if a lumbar musculature deficiency (paravertebral – PVM – and psoas – PM – muscles) is associated with a higher prevalence of vertebral fractures in osteoporotic patients.
Methods
To constitute the fracture group, data were collected retrospectively from patients with one or more recent osteoporotic vertebral fractures between T10 and L5 such as non-injected computerized tomography (CT), dual-energy X-ray absorptiometry (DXA). A control group was made by matching the patients on age, bone mineral density measured by DXA and gender. We analyzed PM and PVM atrophy based on cross-sectional area (CSA) adjusted to the body area as well as fatty infiltration on a 3-level scale and the average muscle density in Hounsfield units (HU).
Results
One hundred seventeen patients were included in each group. The fracture group had a lower PVM CSA than the control group (2197.92 ± 460.19 versus 2335.20 ± 394.42 mm 2 .m −2 , respectively p = 0.015), but there was no significant difference in the PM (746.92 ± 197.89 versus 731.74 ± 215.53 mm 2 .m −2 , respectively p = 0.575). The fracture group had a higher grade of fatty infiltration than the control group (PM: 1.3 ± 0.46 versus 1.07 ± 0.25, p < 0.001; PVM: 1.93 ± 0.5 versus 1.74 ± 0.5, p = 0.003) and a lower average muscle density (PM: 26.99 ± 12.83 versus 33.91 ± 8.12 HU, p < 0.001; PVM: 3.42 ± 21.06 versus 12.94 ± 18.88 HU, p < 0.001).
Conclusion
This study shows an association between a lack of axial musculature and the occurrence of osteoporotic vertebral fractures. Preventive strengthening exercises could be proposed to osteoporotic patients.
Abbreviations and acronyms
BMD
Bone mineral density
BMI
Body mass index
CSA
Cross-sectional area
CT
Computerized tomography
DXA
Dual-energy X-ray
GE
General Electric
HU
Hounsfield Units
L
Lumbar
MRI
Magnetic resonance imaging
PM
Psoas muscle
PVM
Paravertebral muscle
PY
Pack-Years
RIS
Radiology Information System
ROI
Region of Interest
SD
Standard deviation
T
Thoracic
1
Introduction
Osteoporosis is a public health problem, affecting about 200 million women in the world and is associated with a high rate of morbidity and mortality . Postmenopausal women are particularly impacted; about 50% of women over 50 are at risk for an osteoporotic fracture . Due to aging of the population, its prevalence is likely to increase . Osteoporosis is associated with high morbidity and mortality because of its complications. The most frequent complications are vertebral fractures, which are responsible for functional disability, low back pain, immobilization and kyphosis. Thus, osteoporosis has a significant financial burden [ , ].
The main risk factor for osteoporotic vertebral fractures is the severity of osteoporosis define as low bone mineral density (BMD) at peripheral and central sites . The FRAX® score describes risk factors that need to be explored in clinical practice: gender, age, history of fracture (vertebral and non-vertebral), personal history of low-energy fracture, history of femoral fracture in parents, active smoking, glucocorticoids, rheumatoid arthritis, chronic alcoholism, and presence of secondary osteoporosis . Other risk factors are related to bone microarchitecture, collagen characteristics and microdamage, vertebral size and shape, and to the risk of falling [ , , ].
Recommendations insist on an osteoporosis assessment when a person presents a vertebral fracture in order to initiate osteoporosis drug treatment . There is currently no consensus on whether or how to assess the axial musculature in the presence of vertebral fractures. However, the lumbar musculature has a major role in maintaining the spinal balance and it is known that osteoporosis and sarcopenia are associated [ , ].
We hypothesized that changes in biomechanical constraints related to an alteration of the lumbar musculature (paravertebral – PVM – and psoas – PM – muscles) could promote vertebral fractures. In this case, prophylactic measures such as physiotherapy, including exercises to improve the strength and quality of these muscles in people at risk, could be an important means of preventing vertebral fractures. The aim of our study was to determine if a lumbar musculature deficiency is associated with a higher prevalence of vertebral fracture in osteoporotic subjects.
2
Materials and methods
2.1
Type of study
This was a retrospective study involving computerized tomography (CT) data of patients with osteoporotic vertebral fracture compared to patients without vertebral fracture. This study was conduct in the Department of Radiology of Toulouse University Hospital (France) from March 2003 to December 2019. This study was approved by a research ethics committee. An information letter with a non-objection form was sent to all patients involved in this non-interventional study. The patient data were anonymized.
2.2
Study population
Patients were selected from our hospital’s radiology information system (RIS). All patients with an imaging report containing the words “cementoplasty” and/or “vertebroplasty” were eligible. The inclusion criteria were patients who had one or more recent osteoporotic vertebral fractures between T10 and L5 visible on non-injected CT, a lumbar dual-energy X-ray absorptiometry (DXA) within 6 months of the CT scan and weight and height data available. The exclusion criteria were: non-osteoporotic vertebral fractures (pathological or traumatic), history of vertebral surgery, congenital spinal anomaly or scoliosis. To define a control group, we matched patients without vertebral fractures who had a non-injected CT covering at least T10 to L5 based on age (in 10-year increments), sex and BMD obtained by DXA (in 0.5 g/cm 2 increments). Based on these criteria, we obtained two groups: patients with osteoporotic vertebral fracture (fracture group) and patients without fracture (control group).
Clinical data were collected from our hospital’s computerized medical records database (Orbis), including substance abuse (tobacco and alcohol), chronic disease (diabetes, history of cancer or pathology requiring long-term corticosteroid treatment), previous or current specific osteoporosis therapy (bisphosphonate, teriparatide, calcium and vitamin D supplementation), risk factors for osteoporosis (early menopause, personal or family history of osteoporotic fracture, dysthyroidism), hormone replacement therapy for menopause [ , ].
2.3
Imaging protocol
The CT scans analyzed were lumbar spine, abdominal/pelvic or thoracic and abdominal/pelvic. They were acquired on two multidetector CT systems: Optima CT660HD or Discovery CT750HD (GE Healthcare, Waukesha, WI, USA). Acquisitions parameters were tube voltage 120 to 140 kV, tube current 200 to 370 mAs, slice thickness 1 or 1.25 mm.
DXA of the lumbar spine was performed using standard techniques on GE Healthcare Lunar (GE Healthcare, Waukesha, WI, USA).
2.4
Images analysis
2.4.1
Vertebral fractures
Vertebral fracture was defined as an acquired focal or diffuse reduction in vertebral body height, diagnosed on CT or magnetic resonance imaging (MRI). The recent nature of vertebral fractures was determined by one of the following three criteria: the date of onset of pain, the absence of fracture on prior imaging (less than 1 months or the persistence of edema on MRI. We documented the level of vertebral fractures.
2.4.2
Muscle analysis
Two muscle groups were analyzed: the bilateral PVM (multifidus and erector muscles) and PM. To set the reference section for all measurements, we chose the slice passing through the transverse processes of L3, parallel to the endplate . We decided to study the L3 level because it is the most representative of overall body sarcopenia [ , , , ].
Measurements were taken on the CT scan performed prior to vertebroplasty as part of the preoperative assessment. Muscle analysis was performed by a radiologist with 5 years experience in musculoskeletal imaging.
Firstly, muscle atrophy was estimated by doing a free-hand drawing on Horos® software ( https://horosproject.org/ ) to determine the region of interest (ROI) on the fascia of the four muscle groups of interest: PVM right and left, and PM right and left. Cross-sectional areas (CSA) expressed in square millimeters were adjusted to the patient’s body area (Boyd’s formula) (square millimeters per square meter), then both sides of the PVM and PM were added together to obtain PVM CSA (sum of PVM right and left) and PM CSA (sum of PM right and left) [ , ].
Secondly, fatty infiltration was assessed in two ways: (i) average density in Hounsfield units (HU) was automatically calculated from the ROI, (ii) a semi-quantitative measure of visual fatty infiltration on a 3-level scale (mild grade 1 as a fat fraction below 10%, moderate grade 2 as 10–50% and severe grade 3 as above 50%) was made ( Fig. 1 ) [ , , ].

2.5
Statistical analysis
Data were summarized as means and their interquartile range for quantitative variables and as counts with percentage for qualitative variables. Clinical characteristics of patients in the two groups were compared by a Chi 2 or Fisher test, for qualitative variables, and Student’s t- test or Wilcoxon-Mann-Whitney test for quantitative variables.
A univariate analysis, by Chi 2 or Fisher test for qualitative variables, and Student’s t- test or Wilcoxon-Mann-Whitney test for quantitative variables, was performed first.
A logistic regression was performed to look at the influence of muscle structure and atrophy on the occurrence of vertebral fracture.
A p value < 0.05 was considered statistically significant.
Statistical analyses were performed using R software (3.6) ( https://www.r-project.org/ ).
3
Results
3.1
Population
A total of 117 subjects were included in the osteoporotic vertebral fracture group and 117 subjects were included in the control group ( Fig. 2 ). An MRI showing edema of the fractured vertebra was available in 77% of patients in the fracture group, previous images less than one month old showing no fracture were available in 13% of cases, and 10% of patients in this group had a well-documented date of symptom onset of less than one month. The two groups were comparable in their age, gender, DXA value and body mass index (BMI) ( Table 1 ) and body’s area.

| Overall | Fracture group | Control group | p -value | |
|---|---|---|---|---|
| N = 234 | N = 117 | N = 117 | ||
| Mean or N (SD or%) | Mean or N (SD or%) | |||
| Age (year) | 68.3 (11.69) | 68.22 (11.89) | 68.38 (11.53) | 0.920 |
| Gender (female) | 162 (69.2) | 82 (69.2) | 81 (69.2) | 1.000 |
| BMI (kg/m 2 ) | 26.47 (10.89) | 26.68 (14.64) | 26.25 (4.89) | 0.765 |
| Body area (m 2 ) | 1.76 (0.23) | 1.74 (0.23) | 1.78 (0.23) | 0.15 |
| BMD by DEXA (g/cm 2 ) | 0.94 (0.19) | 0,93 (0.19) | 0.96 (0.20) | 0.296 |
| Number of vertebral fracture | 2.76 (1.88) | 0 | ||
| Type 1 diabetes | 7 (3.0) | 3 (2.6) | 4 (3.4) | 0.497 |
| Type 2 diabetes | 36 (15.4) | 15 (12.8) | 21 (17.9) | 0.497 |
| Corticosteroids | 106 (45.3) | 40 (34.2) | 66 (56.4) | 0.001 |
| Neoplasm | 42 (17.9) | 33 (28.2) | 9. (7.7) | <0.001 |
| Tobacco (PY) | 9.56 (17.47) | 12.09 (20.07) | 7.03 (14.05) | 0.026 |
| Chronic alcoholism | 26 (11.1) | 17 (14.5) | 9 (7.7) | 0.145 |
| Early menopause | 32 (13.7) | 24 (20.5) | 8 (6.8) | 0.004 |
| Hypothyroidism | 64 (27.4) | 28 (23.9) | 36 (30.8) | 0.330 |
| Hyperthyroidism | 4 (1.7) | 3 (2.6) | 1 (0.9) | 0.330 |
| Menopausal hormone therapy | 19 (8.1) | 13 (11.1) | 6 (5.1) | 0.151 |
| Personal history of fracture | 61 (26.1) | 33 (28.2) | 28 (23.9) | 0.551 |
| Family history of fracture | 9 (3.8) | 6 (5.1) | 3 (2.6) | 0.497 |
Related posts:
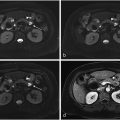 Feasibility of deep learning-reconstructed thin-slice single-breath-hold HASTE for detecting pancreatic lesions: A comparison with two conventional T2-weighted imaging sequences
 Development of a deep learning model for the automated detection of green pixels indicative of gout on dual energy CT scan
 Addition of contrast in ultrasound screening for hepatocellular carcinoma
 FDG uptake of pulmonary lesions in synchronous primary lung cancers and lung metastases
 Combination of intrahepatic TARE and extrahepatic TACE to treat HCC patients with extrahepatic artery supply: A case series
 Impact of inspiration level on lung nodule volumetry
Stay updated, free articles. Join our Telegram channel

Full access? Get Clinical Tree


