Magnetic Resonance Imaging of the Breast
Magnetic resonance imaging (MRI) of the breast is an extremely powerful test that will become increasingly important for breast evaluation. Breast MRI has been performed almost since the technique became available for body imaging. However, its development has been slow due to a “catch 22”: researchers needed dedicated units in breast centers that were readily available to evaluate a large number of women expeditiously in order to determine the efficacious use of breast MRI, while industrial developers were unwilling to provide systems designed for breast evaluation until the efficacy of the technique had been established.
When MRI was first developed, excitement was high. It was clear that some breast cancers were easily seen when surrounded by fat (Fig. 20-1) on T1-weighted images, and cysts were easily identified on T2-weighted images (Fig. 20-2). However, despite initial optimism, it was found that the differences in the relaxation times between benign and malignant tissues overlapped. Cancer could not be reliably distinguished from normal, benign fibroglandular breast tissue, nor could it be distinguished from benign breast lesions based solely on signal differences. When gadolinium-diethylene triamine pentaacetic acid (Gd-DTPA) became available as an intravenous contrast agent, a second round of breast MRI investigation began. Using contrast enhancement, MRI of the breast has become an increasingly useful clinical test.
The role of MRI in the detection of breast cancer and the evaluation of breast lesions has become better defined. Major improvements in MR technology and imaging techniques, coupled with the increased interest in developing ways that supplement mammography for detecting early breast cancer, as well as the hope of being able to noninvasively differentiate benign from malignant lesions, resulted in a surge in research over the past decade using breast MRI for breast cancer detection and diagnosis. However, the cost of the study and the difficulty in gaining access to busy clinical systems, coupled with the lack of breast imaging research magnets, have unfortunately impeded the development of breast MRI.
Intravenously Administered Contrast is Needed
With the exception of implant analysis for detecting rupture, MRI of the breast requires the use of an intravenous (IV) contrast agent to define areas of possible malignancy. Almost all invasive breast cancers demonstrate contrast enhancement following the administration of gadolinium. It is generally accepted that this is due to the formation of tumor neovascularity. Not surprisingly, the morphologic characteristics of breast cancers, as defined by MRI, are also important for MR breast imaging. The differentiation of lesions based on their shapes is similar to the using morphologic findings that have been defined on mammograms and those seen using ultrasound. The irregular shape of most breast cancers and even spiculation can often be appreciated on MRI, although not yet with the spatial resolution evident by mammography. Just as with mammography, however, morphologic characteristics cannot reliably differentiate benign from malignant lesions. An advantage of MRI is that the dynamics of the flow of gadolinium through a lesion can be evaluated, and some data suggest that the characteristics of the contrast dynamics can also help differentiate benign from malignant lesions. Consequently, MRI evaluation of breast lesions has developed as a combination of analyzing their morphologic characteristics
as well as the pattern of contrast enhancement over time following a bolus injection of contrast material.
as well as the pattern of contrast enhancement over time following a bolus injection of contrast material.
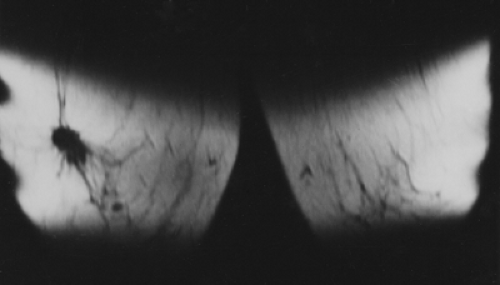 Figure 20-1 Invasive breast cancer visible on T1-weighted image because of the surrounding fat. |
Perhaps the most important advantage of breast MRI at this time is that contrast enhancement makes lesions stand out from the background tissues (high signal to background). Unlike mammography and ultrasound, where the signals generated by a cancer may be similar to the background tissue, thus making the lesion difficult to perceive or even invisible on those tests, contrast-enhanced MRI makes cancers stand out against the lower enhancement of normal tissues. Cancers that are indistinguishable from normal tissue on nonenhanced MRI scans “light up” with contrast on MRI, usually making them easily visible.
Although contrast enhancement facilitates the detection and delineation of cancer, as with most tests there is an overlap between cancer and benign as well as normal tissues. Just as cancers enhance, normal tissue and many benign lesions can also enhance on MRI. The dynamics of contrast enhancement has been only partially explored. The most useful information following the IV injection of contrast probably comes in the first minute following the bolus injection as the contrast first passes through the lesion. Unfortunately, routine scanning has yet to permit simultaneous high-resolution imaging and fast image acquisition to fully evaluate this early contrast phase when the entire breast is included in the scan. We explored the use of echoplanar imaging, which allowed rapid image acquisition but at the expense of spatial resolution. I am not aware of anyone using echoplanar imaging to evaluate the breast at present. The technology continues to progress, however, and faster high-resolution imaging will likely be feasible someday.
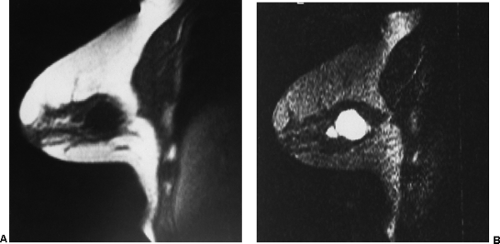 Figure 20-2 On MRI this cyst had a characteristically low signal intensity (black) on this T1-weighted image (A) and a high signal intensity (white) on the T2-weighted image (B). |
Basics of Breast MRI
The detailed physics of MRI is complicated and beyond the scope of this text. Furthermore, the instrumentation is varied and often proprietary and changes fairly rapidly, so I will not detail specific devices. I prefer to try to understand the physics at a fairly simplistic level that works well for the evaluation of clinical images.
In the simplest terms, MRI works in the following way. The nuclei of certain atoms such as hydrogen, phosphorus, and sodium have magnetic properties. They can be thought of as small bar magnets spinning like a child’s toy top with their own magnetic fields aligned with the axis of the top (atom). If these atoms are placed in an external magnetic field, their axes, which are normally randomly oriented, line up with the external field just like the needle of a compass
lines up with the Earth’s magnetic field. If radiofrequency (RF) energy is then applied from the proper direction, it can be used to tip the axis of these atomic magnets (spinning tops) over and out of line. As they swing back into line in the magnetic field, they give back RF signals that can be collected by antennas and used to generate images of the tissues in which they reside.
lines up with the Earth’s magnetic field. If radiofrequency (RF) energy is then applied from the proper direction, it can be used to tip the axis of these atomic magnets (spinning tops) over and out of line. As they swing back into line in the magnetic field, they give back RF signals that can be collected by antennas and used to generate images of the tissues in which they reside.
Not just any amount of energy will tip the axis of the atom. The amount of RF energy that is needed is specific for the type of atom and the strength of the magnetic field in which it lies. The frequency needed is called its Larmor frequency (see below), also known as its resonance frequency. The analogy with a spinning top is maintained when the atom is tipped by radio waves of the correct frequency. Just like a spinning top that is beginning to fall over, the atom continues to spin, but now it “precesses” as well as rotating as if its tip were anchored and the upper part was swinging in a circle in the magnetic field (Fig. 20-3). The precessing atom is influenced by the magnetic field as well as the other atoms and molecules in its neighborhood. When the radio pulse that tips it is terminated, the precessing atoms begin to realign themselves in the magnetic field. The motions of the atoms within the magnetic field generate return signals that can be detected by antennas in the MR device and recorded to form images.
One of the challenges involved in making images with MR is to identify the site from which the returning signals were originating. This is accomplished by tailoring the magnetic field and by using varying energy sequences to alter the phase of signals coming from different volumes of tissue. The magnetic field can be adjusted to be stronger at one end than the other. Secondary magnetic fields can be generated using differing coils to produce magnetic “gradients” within the main field. These differences can be used to identify the location and strength of the signals that are generated from within a volume of tissue to define the three-dimensional location of the atoms that generated the returning signals.
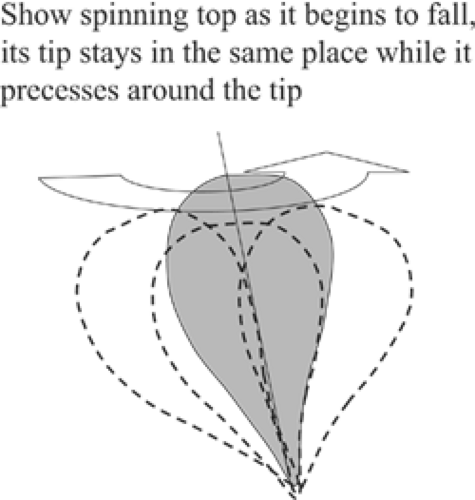 Figure 20-3 Protons “precess” in a magnetic field. When protons are knocked out of line in the magnetic field, they act like spinning tops that are beginning to fall over and swing in the magnetic field as they realign themselves in the magnetic field. As they move in the field, they generate RF energy that is the basis of the MR image. |
Tissue Effects in MRI
The precession of the protons is affected not just by the magnetic field, but also by the nearby atoms, the type of molecule in which the atom is located, and the organization of the molecules into tissues. Initially the tipped protons precess together synchronously, but they soon begin to lose energy to one another and they lose their synchrony. The atoms get out of phase with one another. The signals that they return begin to cancel each other. At the same time, the protons are influenced by the magnetic field, and they are also swinging back and realigning themselves in the magnetic field. The several components of the realignment, precession, and desynchronization can be used to generate images based on signal intensity. The returning signals can be used to identify and characterize the tissue that produced them and its location.
MR Spectroscopy
With very high field strengths, other nuclei can be studied, and these can reveal the molecular composition of the tissues. The nuclei of phosphorus, for example, can be identified. One of the molecules that is high in phosphorus is choline, a molecule that is nutritionally important because it is needed to make the phospholipids used in cell membranes. With very high magnetic fields, the concentrations of choline can be determined in specific volumes of tissue. Breast cancer cells appear to generate as much as 10 times more choline than normal cells, and MR spectroscopy is one of the areas of active research (1). Given the vast quantities of hydrogen in the body, however, the proton signal from hydrogen overwhelms the signal from other sources, so signals from hydrogen nuclei provide the standard MR image. Since the body is composed primarily of water-containing tissues and fat, it is the behavior of the protons that form the hydrogen nuclei in these tissues that provides the MR image. MRI spectroscopy of other nuclei remains a highly experimental technique that will not be covered since it is of no clinical value at present. However, as 3-Tesla magnets become more available, spectroscopy may become clinically useful.
Magnetic Resonance
Protons can be kept precessing in a magnetic field if their precession is continually reinforced by pulses of the correct RF energy. This is why the frequency of the pulses is known as the resonance frequency. The resonance frequency is defined by the Larmor equation, which states that the resonant frequency of the proton equals the strength of the magnetic field multiplied by the gyromagnetic constant of the proton. The gyromagnetic constant is influenced by the way the protons are organized into molecules. The protons in fat have a different gyromagnetic constant than the protons in water. This “chemical shift” can be used to enhance various aspects of an MR image. When a single pulse is given using the correct amount of energy, the protons can be tipped any amount. If they are tipped 90 degrees to the direction of the main magnetic field, this will maximize the amount of signal that they can return as they precess back into alignment. This realignment is called the “free induction decay” (FID).
T1 and T2
There are two basic signals that are generated by the protons returning to their alignment in the magnetic field: time 1 and time 2, or T1 and T2. The proton is tipped out of line by an RF pulse. It can be tipped at any angle to the magnetic field, but it will create its strongest return signal when the axis of its “magnetic moment” is tipped at 90 degrees (perpendicular) to the axis of the main magnetic field. A proton will generate its highest electromagnetic signal as it precesses at right angles through the magnetic field. The signal fades as the tipped proton shifts back up and realigns with the main magnetic field. There are two mechanisms by which the tipped proton loses signal. The time that it takes for the axis of the proton to return to alignment in the magnetic field has been labeled T1 (actually T1 is 63% of the total time, but for simplicity consider it “the time”) of “spin lattice” relaxation.
As noted earlier, while this is occurring, if the protons are left alone, they begin to precess at different rates because each experiences differing forces generated by its local environment and the influence of other nearby atoms (spin-spin relaxation). As the protons get out of phase, their signals begin to cancel each other out as they precess at different rates, so that if left alone there is a point in time at which they will be completely out of phase and there will no longer be net signal from the protons. This time is measured as T2.
Signals from Fat
RF pulses are used to “excite” the protons, knocking them out of alignment with the main magnetic field (“excitation pulses”). There are two major measurements that are made to generate MR images. The T1 signal is based on the time it takes for the proton to “relax” and return to its alignment in the main magnetic field. This relaxation can take as long as 3 seconds. Protons in more tightly bound molecules such as fat have faster relaxation times (greater interaction between molecules), so their T1 signal is shorter than pure water; thus, fat has the shortest T1 relaxation time. By convention, tissues with short T1 are presented as bright signals on T1 images.
Signals from Water
As they line back up, there are two major types of water that generate differing signals. “Free water” is, as it sounds, fluid like that in breast cysts. The molecules and hydrogen nuclei in free water are separated and do not interact rapidly with their surroundings; consequently, they lose their energy at a slower rate and get out of phase with one another over a longer period of time. Thus, the water in breast cysts gives back a signal more slowly. It has a long T1 and a long T2. By convention, tissues with a long T2 are presented as bright signals on T2-weighted images. Thus, cysts (that contain fluid) with long T1 are dark on T1-weighted images and those with long T2 are bright on T2-weighted images. Fibroglandular tissues, although largely made up of water, contain “bound water.” There is greater intermolecular interaction, so they lose their energy more quickly to one another (short T2 signals), and these tissues provide relatively low signal (dark) on T2 images.
Three-Dimensional Localization
One of the complexities of MRI is determining where in the tissues being studied the various signals are originating. Signal localization is accomplished in various ways. By varying the strength of the magnetic field over the volume to be imaged, the resonant frequency of the same protons can be increased or decreased. This can be used to determine where in the volume the signal from the protons actually originates. Similar protons at one end of the field spin faster than those at the other end of the tapered magnetic field, with proportionate spins in between. The field gradients are used to taper the main field and provide spatial localization to identify the signal’s origin. The phase of the pulses is also used to determine the origin of a signal. The magnetic gradients and the RF pulses are used to create the MR image. The MR signals form waves of varying frequency and amplitude based on the pulse sequences used. This provides a volume of data known as K space. The signals in K space are uninterpretable, but through the use of Fourier transformation, the K-space information is converted into a three-dimensional “physical space” that can be interpreted by the radiologist.
Basic MRI Technology
The basic MR system is composed of a main magnetic field, gradient fields, RF pulse generators, radiofrequency antennas
to receive the signals returning from the tissues, and computer systems to control the system and to convert the information into readable images. Since the returning signal intensities are subject to many factors, the absolute value of the signals is not very useful, but the relative values of the signals in an image provide useful information.
to receive the signals returning from the tissues, and computer systems to control the system and to convert the information into readable images. Since the returning signal intensities are subject to many factors, the absolute value of the signals is not very useful, but the relative values of the signals in an image provide useful information.
Magnetic Fields
To image the tissues of the body, the magnetic field must be quite strong. For breast imaging, our experience suggests that a magnet with the strength of at least 1.5 Tesla is needed. A 1-Tesla magnet generates a field of 10,000 Gauss. The Earth’s magnetic field is only 0.5 Gauss, so a 1-Tesla magnet is 20,000 times the strength of the Earth’s magnetic field. An MRI system contains a main magnet to generate the main field. Within the main magnet are gradient coils that can alter the magnetic field in carefully controlled ways that allow the system to determine where signals are originating in the tissues of the body, and to participate in the various pulses used in the “pulse sequences.” Within these are the RF coils that send in RF energy to begin a pulse sequence and antennas to record the signals that come back from the tissues. All of these are under computer control to ensure that the various functions occur in the proper order.
Spin-Echo Imaging
T2 relaxation occurs more quickly than does the return of the protons to alignment in the magnetic field, so T2 is always shorter than T1 (if the proton is not tipped, then there can be no T2 signal, since it is precession in the field that generates the RF signal). If left alone, T2 will go from a high number to a lower number as the protons get out of phase and their signals cancel one another out. To generate a signal, the desynchronization process can be reversed. This is done by using a “refocusing” pulse. The signals that are precessing at different rates can be reversed so that the forces that caused them to dephase can be used in reverse to cause them to realign and resynchronize, causing their return signal to go from weak back to strong. This has been compared to watching sprinters in a foot race in a movie. They start at the starting line together (consider this the 90-degree pulse). As they run at various speeds away from the starting line, some move faster than others; they are no longer in line but are at various distances from the starting line. If we were to stop the movie and run it backwards, the runners would appear to converge back to the starting line, at which point they would once again be aligned (synchronized). This is the principle behind the “spin echo.” The protons are first flipped 90 degrees, and their signal starts out strong and then begins to weaken as the protons precess at differing rates. A “180-degree” pulse is applied, and it has the effect of running the film backwards. It causes the desynchronization of the protons to reverse and they resynchronize, producing a strong signal as they are “refocused” and producing an “echo” of the original signal. Similar refocusing can be achieved by varying the magnetic field gradients. This is the basis of “gradient-echo” imaging. The sequences can be performed more rapidly by not tipping the protons all the way to 90 degrees. This variable “flip” angle is defined by the “pulse sequence.”
MRI Sequencing
During a typical image-acquisition sequence, the basic process of tipping the protons and refocusing them and collecting the returning signals is repeated hundreds of times. The amount of signal returning from the tissues can be altered by altering the repetition time (TR = the time between successive 90-degree pulses) and by altering the echo time (TE). This can be used to enhance the T1 signal (T1 weighting) or the T2 signal (T2 weighting). If a long echo time is used (TE), then this will enhance the T2 information (T2-weighted imaging). For example, water has a long T2 and will take longer to decay than fat and fibrous tissues, which lose their T2 signal faster. Lesions with long T2 values will produce signal longer and thus will stay brighter on T2-weighted images than other tissues. This is why cysts appear bright on T2 images.
T1 contrast is controlled by the time between repetitions of the pulses (TR). Tissue that take a long time to return to equilibrium alignment in the magnetic field (long T1) are dark on T1-weighted images, while those that return quickly (have a short T1) are bright on T1-weighted images. Fat in the breast is an example of a tissue with a short T1: it is bright on T1-weighted images. Since water takes a long time for its atoms to realign (long T1), a short TR will not give it time to produce a signal, and it will appear dark on T1-weighted imaging.
The density of the protons in the tissues can be demonstrated by choosing TR and TE to minimize T1 and T2 weighting (Table 20-1).
Gradient-Echo Imaging
Spin-echo imaging can be relatively slow. Instead of using the RF pulse to refocus the proton spins, the refocusing can
be accomplished by using gradients (adjustable magnetic fields that differ from the main magnetic field). Rather than using RF pulses to produce spin-echo images, gradients are used to first jolt the protons, and then refocusing is accomplished by reversing the direction of the magnetic gradient (eliminating the need for a 180-degree RF pulse). Gradient-echo imaging permits rapid T1-weighted scans by using short TR. This is advantageous when contrast agents are used. Another modification that speeds up imaging time is the use of flip angles that are less than 90 degrees.
be accomplished by using gradients (adjustable magnetic fields that differ from the main magnetic field). Rather than using RF pulses to produce spin-echo images, gradients are used to first jolt the protons, and then refocusing is accomplished by reversing the direction of the magnetic gradient (eliminating the need for a 180-degree RF pulse). Gradient-echo imaging permits rapid T1-weighted scans by using short TR. This is advantageous when contrast agents are used. Another modification that speeds up imaging time is the use of flip angles that are less than 90 degrees.
TABLE 20-1 TR AND TE VALUES | |
|---|---|
|
IV Contrast Is Needed to Differentiate Lesions From Breast Tissue Despite T1 and T2 Variations
The strength of T1 and T2 signals can be used to evaluate some disease processes directly. However, in the breast it has been found that these signals are not sufficient for distinguishing malignant lesions from normal breast tissue and benign lesions. As in other organ systems, IV contrast material (at present gadolinium) is needed to distinguish cancers from the background breast tissue. At present there are two ways to evaluate breast lesions with MRI. As with any other imaging test, the morphologic characteristics of the imaged lesions can be evaluated. In addition, since contrast material is administered and scanning can take place over time, the dynamics of contrast enhancement and washout over time can be used to help assess MRI findings.
Breast Coils and Patient Positioning
The farther away the antenna that receives the MR signals is from their point of origin, the weaker the signal. Hence, the signal-to-noise ratio is enhanced by placing the RF antennas as close to the tissue being imaged as possible. Experience has made it clear that breast MRI requires the use of dedicated breast coils. Many early breast imaging systems used a single coil and only one breast could be imaged at a time. This was problematic, since the IV contrast material used to image one breast made it impossible to image the other breast on the same day, and patients needed to return after their bodies had cleared the gadolinium so that a second bolus could be administered, usually a day or more later, to evaluate the second breast. We have always preferred a double coil that allowed bilateral simultaneous imaging because it has permitted a direct comparison between the two breasts. We have had to sacrifice some signal strength and spatial resolution, but just as with mammography, symmetry of the tissues, or more specifically lack of symmetry, can be significant in detecting malignancy.
Breast coils are designed such that the patient is imaged in the prone position. She is supported above the table so that her breasts are pendent. The structure that supports the patient and surrounds the breasts holds the coil. The patient lies with her breasts in wells so that the coil wraps around her breasts (other configurations have been used to get the coil even closer to the breast). The pendent position reduces motion artifact from respiration and allows gravity to pull and separate the structures of the breast while maintaining an anatomic orientation and configuration that facilitates interpretation.
Before the patient is positioned in the coil, an IV catheter is inserted into the patient’s arm. The line is maintained with 0.5% saline with a stopcock apparatus. It is connected to a power injector filled with Gd-DTPA. If a power injector is not available, the second line can be connected to a Gd-DTPA–filled syringe. It is obviously important to have the IV connected before the start of the study to reduce the chance that the patient’s position will change between the pre- and postcontrast sets of images. It also diminishes the amount of time the patient is within the scanner. I feel that contrast subtraction is the best way to perform breast MRI. It is far easier to identify an enhancing lesion using contrast subtraction than any other method. Excellent registration is needed to use contrast subtraction. Any patient motion compromises the accuracy of registering the pre- and post-injection images, so reducing (eliminating) patient motion is very important.
The optimal dose of Gd-DTPA may range from 0.1 to 0.2 mmol per kg body weight, depending on the imaging sequence selected. Higher doses have been suggested. Heywang-Koebrunner et al found that improved imaging could be achieved using 0.16 mmol/kg (2). Weinreb and Newstead, however, speculated that this may have been a function of the technique and pulse sequence used by the authors (24). We use 0.1 mmol. If a power injector is used, the rate may vary up to 3 mL per second.
A variety of MR sequences for contrast-enhanced breast imaging can be used. These include 3D imaging such as 3D FLASH (fast low-angle shot), FISP (fast imaging with steady precession), FATSS (fast adiabatic trajectory in a steady state), and GRASS (gradient-recalled acquisition in a steady state) (3,4,5,6,7). The same sequence is performed before and after injection with Gd-DTPA. These sequences allow volumetric coverage of the breasts, resulting in thin, contiguous slices (1 to 2 mm).
Small lesions are better detected with 3D sequences than with 2D techniques because the latter produce gaps between slices that may miss a small lesion. Our protocol uses sagittal T1-weighted localizing images. We then obtain axial fast spin-echo T2-weighted images and high-resolution 3D axial gradient-echo T1-weighted images. We obtain a T2-weighted sequence before the pre- and post-enhancement sequences. The T2 sequence helps to define fluid-containing structures such as cysts (Fig. 20-4A) and to distinguish blood products from fluid or fibrosis. The
T1-weighted images are obtained before contrast adminis-tration and then repeated three times after the IV adminis-tration of gadolinium. The preinjection T1 sequence as well as the T2 sequence helps to distinguish blood products from fluid or fibrosis (see Fig. 20-4B). Although we use fat suppression, I rarely look at these images, since computerized subtraction of the pre- and postcontrast images facilitates image interpretation and eliminates any confusion from the bright fat signal.
T1-weighted images are obtained before contrast adminis-tration and then repeated three times after the IV adminis-tration of gadolinium. The preinjection T1 sequence as well as the T2 sequence helps to distinguish blood products from fluid or fibrosis (see Fig. 20-4B). Although we use fat suppression, I rarely look at these images, since computerized subtraction of the pre- and postcontrast images facilitates image interpretation and eliminates any confusion from the bright fat signal.
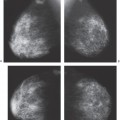
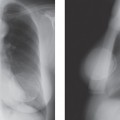
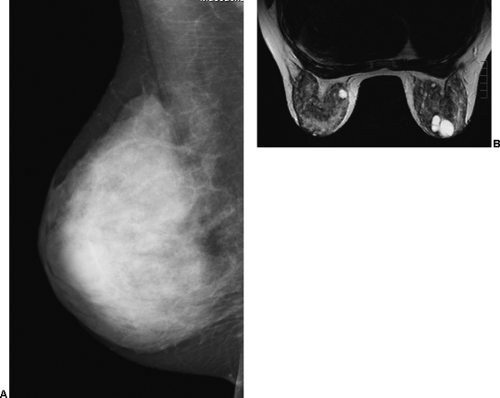 Figure 20-4 Cysts are bright on T2. In this mammogram of the right breast (A), the dense tissues obscure the cysts that are easily seen on the T2-weighted MRI examination (B). |
FAT Suppression AIDS in The Appreciation of Contrast Enhancement
If accurate registration of pre- and postcontrast injection scans is unreliable, then the radiologist has to look at the precontrast scans, compare them to the postcontrast scans, and try to determine which tissues have enhanced on the postcontrast scans. Because of the high signal intensity of fat on T1 images, it is often difficult to appreciate enhancing lesions on gradient-echo images from the high signal produced by fat on T1-weighted images. Consequently, methods have been devised that eliminate the high signal from fat so that the tissues that enhance following contrast administration are more easily appreciated (Fig. 20-5). Most MR imaging includes sequences that suppress the signal from fat. To optimize the chemical-shift fat-suppression techniques, maximizing the homogeneity of the field of the imaging volume is necessary. Shimming before imaging is needed to reduce the field inhomogeneities that commonly occur in breast imaging. If this is not done accurately, the subsequent study may be uninterpretable. Automated shimming is available. One effective method of fat suppression that is used in the one dedicated breast MRI system being sold uses RODEO (rotating delivery of excitation off-resonance) pulse sequence (8,9,10). This sequence requires a transmit-receive coil.
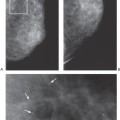
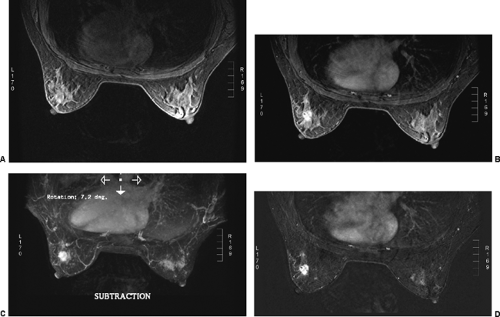 Figure 20-5 Fat suppression makes enhancing lesions easier to appreciate. Fat has low signal intensity on this fat-saturated T1-weighted image (A) prior to the IV administration of contrast. The cancer in the left breast is more evident on the first fat-saturated set of images following contrast injection (B). The lesion is more evident on this maximum intensity contrast subtraction 3D display (C) and on this single-slice subtraction image (D). |
Contrast Subtraction
The method that I prefer for determining which tissues enhance is using image subtraction. This is identical to contrast subtraction in angiography. The preinjection (precontrast) images are subtracted from the postcontrast images, leaving images of the contrast distribution (9,10,11,12,13). I prefer using subtraction since I have found it far easier to appreciate contrast enhancement on subtraction images than using fat suppression (Fig. 20-6). Because fat does not enhance very much following the IV contrast injection, subtraction of the precontrast images from those following contrast can be used to essentially eliminate the fat signal. Only tissues that contain the contrast agent are evident on the subtraction
images. However, for subtraction to work, alignment of the two sets of images must be very accurate. Any motion of the patient may compromise the method. Subtraction algorithms often just subtract one slice from another; this makes it impossible to try to register the images if movement shifts the slices. We have been using a 3D registration algorithm of the pre- and postcontrast scans using software developed at the David Sarnoff/National Information Display Laboratories in Princeton, New Jersey. This has been the most powerful registration technology that we have seen. Our subtractions are routinely accomplished with excellent registration. This approach facilitates the review of a large amount of data in minutes. Our software allows a 3D subtraction. This provides the images so that they can be displayed using a 3D maximum intensity projection presentation (MIP) of the contrast distribution (Fig. 20-7). Both breasts are viewed simultaneously, and by rotating the MIP the reader is provided with a clear 3D overview of the enhancement patterns. It is not possible to rely exclusively on the MIP, however, since some information is suppressed by the technique (nonenhancing lesions and space-occupying structures such as implants may be overlooked on MIP images), but the subtraction MIP provides a clear overview of the major areas of enhancement and an appreciation of the 3D distribution of enhancement (see Fig. 20-7A).
images. However, for subtraction to work, alignment of the two sets of images must be very accurate. Any motion of the patient may compromise the method. Subtraction algorithms often just subtract one slice from another; this makes it impossible to try to register the images if movement shifts the slices. We have been using a 3D registration algorithm of the pre- and postcontrast scans using software developed at the David Sarnoff/National Information Display Laboratories in Princeton, New Jersey. This has been the most powerful registration technology that we have seen. Our subtractions are routinely accomplished with excellent registration. This approach facilitates the review of a large amount of data in minutes. Our software allows a 3D subtraction. This provides the images so that they can be displayed using a 3D maximum intensity projection presentation (MIP) of the contrast distribution (Fig. 20-7). Both breasts are viewed simultaneously, and by rotating the MIP the reader is provided with a clear 3D overview of the enhancement patterns. It is not possible to rely exclusively on the MIP, however, since some information is suppressed by the technique (nonenhancing lesions and space-occupying structures such as implants may be overlooked on MIP images), but the subtraction MIP provides a clear overview of the major areas of enhancement and an appreciation of the 3D distribution of enhancement (see Fig. 20-7A).
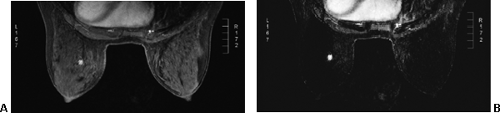 Figure 20-6 Accurate subtraction facilitates interpretation. The enhancing mass proved to be PASH. It is evident on the post-gadolinium injection fat-suppressed image (A) but is more evident on the subtracted images (B). |
After the MIP overview, I then review the 2D (slice-by-slice) subtraction images. These provide a more detailed evaluation of the enhancing structures that are not limited by the suppression of some of the signal that can occur with MIP images. Finally, the T2-weighted images are reviewed to see whether there are any cysts or to evaluate any other fluid collection. T2 images also provide the clearest definition of breast anatomy and the skin. Postsurgical change can be obvious and dramatic on T2 images (see Fig. 20-7C). Postsurgical scar does not enhance, so this may not be easily appreciated on the postcontrast images.
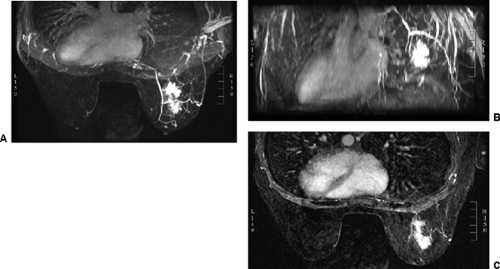 Figure 20-7 The 3D maximum intensity subtraction image provides an overview of the MRI information. The segmental enhancement and 3D distribution of the malignancy is easily appreciated on this maximum intensity projection (A) produced after the pre- and post-gadolinium images have been subtracted and viewed from the foot of the patient’s bed. The image can be rotated on a monitor so that this second image is viewed as if we are looking through the patient from behind (B). The finest detail is seen on the individual slices, of which (C) is representative. |
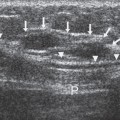
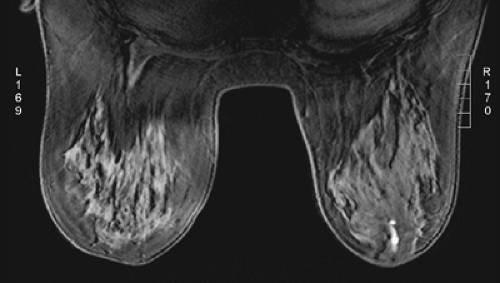 Figure 20-8 Blood in the ducts can be bright on T1. This patient had a bloody nipple discharge on the right. The blood in the duct is bright on the precontrast T1 image. |
If the patient is experiencing a bloody nipple discharge, blood may be evident within a duct as a bright signal on the precontrast T1 images (Fig. 20-8). Blood goes through several stages. Acute bleeding is bright on both T1 and T2 images. As hemosiderin collects, the subacute bleed is bright on T1 but dark on T2, and “old” blood is dark on both T1 and T2 images. Mucin is bright on both T1 and T2 images.
When the data are presented as described, breast MR images can be reviewed quickly, efficiently, and accurately.
Dynamics of Contrast Enhancement
The IV administration of a bolus of the contrast agent gadolinium-DTPA at 0.1 mmol/kg has become standard for imaging the breast. Gadolinium passes through the vascular system and diffuses out of the microvasculature into the extravascular space of normal as well as abnormal breast tissues. Tumors produce new blood vessels (neovasculature) that are not normal. These vessels are poorly formed and tend to “leak.” Because tumors develop a nest of new blood vessels (see Fig. 20-7B), the volume of gadolinium is higher in the network of tumor vessels than in the normally vascularized tissues, and because the vessels leak, the gadolinium moves more rapidly into the extracellular space of tumors than in normal breast tissue and most benign lesions. This is probably also why it “washes out” faster than normal tissues.
Gadolinium also alters the magnetic characteristics of the tissues into which it diffuses. The T1 signal is shortened by the presence of the gadolinium, and this produces a bright signal on T1-weighted images. This makes most cancers “light up” following the IV administration of gadolinium.
If gadolinium is administered IV in a bolus and the breasts are scanned several times over several minutes, it is possible to compare the signal intensities of the breast tissues and breast lesions from one scan to the next and to calculate the MRI signal changes over the time period as contrast material flows through the breast and diffuses into the breast tissues and lesions in the breast. The dynamics of the contrast enhancement over time can be plotted for any region of interest in the breast. With modern 1.5-T scanners, the breasts can be scanned every 1 to 2 minutes, and the signal intensities can be graphed (Fig. 20-9). Software has been developed that will measure contrast changes over time for every voxel in the breast examination. The computer can be used to identify regions of enhancement (time and amount) over time that meet thresholds defined by the user to automatically identify regions with one of the three types of dynamics.
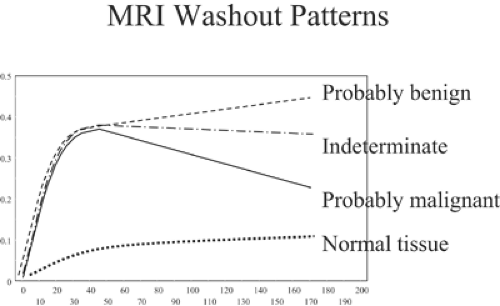 Figure 20-9 Different washout patterns following IV contrast administration during breast MRI. If the flow of contrast is measured (using signal intensity changes) over time, normal breast tissue enhances slightly and slowly. Benign lesions such as fibroadenomas tend to enhance rapidly and continue to enhance over several minutes. Breast cancers tend to enhance rapidly and then plateau, or wash out, rapidly. Although these patterns can sometimes help in evaluating a lesion, there is significant overlap, so enhancement patterns cannot be used independently to accurately differentiate benign lesions from malignant. |
In normal breast tissues and many benign lesions, the contrast enhancement stays low but continues to increase steadily over many minutes. Most breast cancers enhance rapidly (within the first minute) following an IV bolus injection of gadolinium. In general, the enhancement rises rapidly in malignant lesions and then either plateaus or begins to wash out of the lesion. Kuhl et al have defined these three patterns (14). They evaluated 266 breast lesions and established contrast intensity levels over time. They called a steady enhancement type I. Type II enhancement is the rapid increase and then plateau pattern. Type III is the rapid increase followed by a rapid washout pattern. Among the lesions that they evaluated, 38% were malignant and 62% were benign. Among the breast cancers, 8.9% showed a type 1 (usually benign) pattern of enhancement. The largest number (57.4%) showed a type III pattern, and 33.6% had a type II (plateau) pattern. In the benign lesions, 83% had a type I pattern, 11.5% had a type II pattern, and 5.5% had a type III pattern, significantly different from the malignant lesion patterns (p < 0.001). The authors felt that these differences make the evaluation
of the dynamics of contrast enhancement an important component of MRI analysis of breast lesions.
of the dynamics of contrast enhancement an important component of MRI analysis of breast lesions.
As is often the case, however, the first investigators of a new test tend to have the best results. Siegmann et al (15) did not find that the dynamic patterns were useful. However, they evaluated only 51 patients (19 malignancies and 32 benign lesions), and 36 were imaged using a 1.0-T system, while only 15 were studied in a 1.5-T system. The small numbers and likely slower scan times may have affected their time studies.
Even if the significant differences found by Kuhl et al are reproducible, it is difficult to know how to use contrast dynamics. Since a breast biopsy is so safe and the stakes for overlooking a cancer are so high, it would be difficult to avoid a biopsy by considering a lesion to be benign simply because it had a type I enhancement. Even the better data show that almost 9% of the cancers had a type I enhancement pattern. This is a fairly high number, and it would be difficult to avoid a biopsy based on these statistics. Consequently, it is difficult to see how the evaluation of contrast dynamics alone, as currently understood, would alter the care of the patient.
Lesion Morphology and Enhancement Pattern Analysis
As with mammography and ultrasound, the morphology of lesions as seen on MRI can be used to suggest their histology. Just as the shape and echo texture of a lesion as seen on ultrasound are useful in analyzing the lesions, the shape of a lesion and the texture of its contrast enhancement on MRI can also help in its analysis.
Shape and Margins
Since histologically benign lesions tend to be round, oval, or smoothly lobulated, with a sharp demarcation between the mass and the surrounding tissues, it is not surprising that lesions seen on MRI that are round, ovoid, or smoothly lobulated with sharply defined margins tend to be benign (Fig. 20-10), while those that are irregular in shape or have ill-defined or spiculated margins tend to be malignant (Fig. 20-11).
Lesion Enhancement Patterns
Benign masses tend to have uniform enhancement (Fig. 20-12). Nunes et al have suggested that a round or oval lesion that has nonenhancing (low-signal) septations (Fig. 20-13) is almost always a fibroadenoma (16). The difficulty with using this latter observation is that the authors had very high-resolution capability not available on many breast MRI systems. When nonenhancing septations are clearly evident, we believe that the observation is quite accurate for fibroadenomas, but it can be difficult to distinguish nonenhancing septations from the heterogeneous enhancement seen in small malignant lesions. If a lesion is evident but shows no enhancement, then a cyst is likely. This can be verified by looking at the T2-weighted image, where the cyst fluid will produce a bright signal (see Fig. 20-13A).
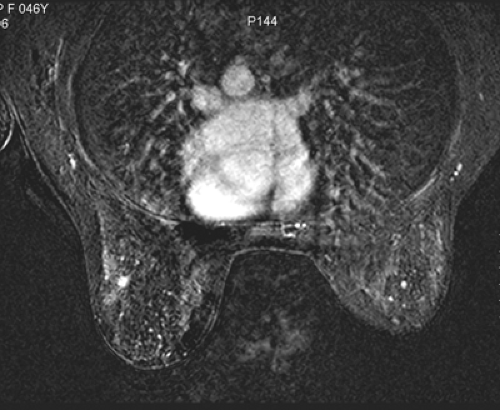 Figure 20-10 Fibroadenomas are usually round or oval, with sharply defined margins, on contrast-enhanced MRI. The brightly enhancing mass in the left breast was found to be a fibroadenoma at biopsy. There are other, nonspecific enhancing nodules bilaterally that we call “physiologic.” |
Heterogeneous enhancement is more common in malignant lesions (Fig. 20-14), although not all irregularly shaped, heterogeneously enhancing masses are malignant (Fig. 20-15).
A number of malignant lesions exhibit brighter enhancement at their periphery, now called rim enhancement (Fig. 20-16). Orel et al saw this in 5 of 16 malignant lesions that they studied (17). It is fairly rare for a benign lesion to do this. Inflamed cysts can demonstrate rim enhancement (Fig. 20-17A), but these are usually thinner than seen in cancer. Furthermore, cancers are low in signal intensity on T2 images, and the cyst, with its enhancing wall, will demonstrate a bright signal on T2 imaging (see Fig. 20-17B).
Given the overlap between benign and malignant lesions using morphologic criteria, it is difficult to avoid a biopsy of an enhancing lesion based just on these criteria. Nunes et al have tried to combine the morphologic criteria with the contrast enhancement patterns to aid in MRI interpretation (18), but once again it is difficult to avoid performing a biopsy of an enhancing lesion if there is more than a 2% chance that it might be malignant (2% is the accepted risk of cancer for classifying lesions as “probably benign” using mammography and the BI-RADS classification). This is also the conclusion of the Technology Assessment Center that advises Blue Cross and Blue Shield (19).
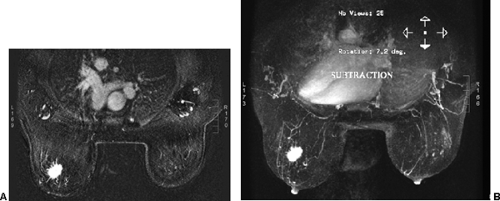 Figure 20-11 Spiculated mass on MRI. The morphology of cancers on MRI is similar to what is seen mammographically. The spiculated margin of this invasive ductal carcinoma is clearly evident on the 2D post-contrast subtraction image (A). It is even more evident on the 3D post-subtraction maximum intensity projection image (B). |
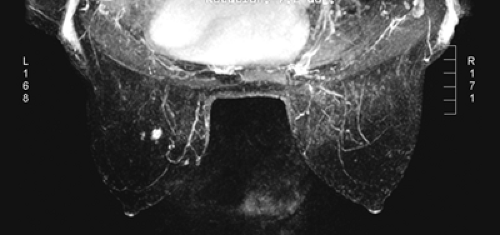 Figure 20-12 Benign lesions tend to show uniform enhancement. The uniformly enhancing mass in the left breast on this maximum intensity projection subtraction study proved to be pseudoangiomatous stromal hyperplasia. |
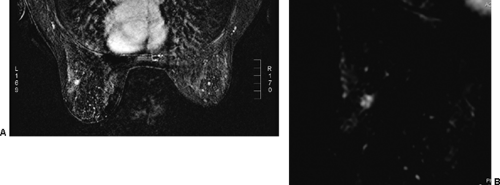 Figure 20-13 Fibroadenomas can have nonenhancing septations on MRI. The bright enhancing mass in the left breast seen from the foot of the bed (A) is found to have nonenhancing septations when the image is enlarged and windowed (B). It proved to be a benign fibroadenoma. |
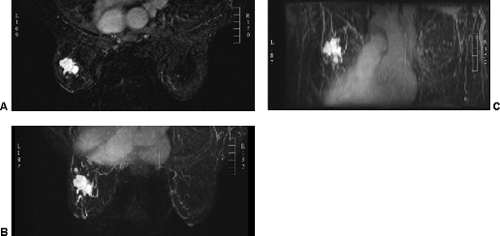 Figure 20-14 Breast cancers are usually irregular in shape and heterogeneous in their enhancement on MRI. This very large left breast cancer shows marked irregularity of its shape and margins on this single slice from the post-gadolinium subtracted image (A). The extent and irregularity are more obvious in the 3D maximum intensity projection (B) as when observed from the foot of the bed and from behind the patient (C). |
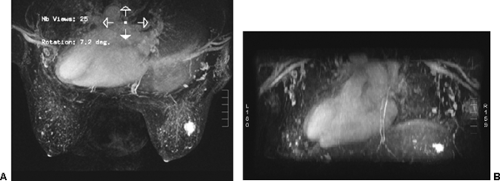 Figure 20-15 Not everything that enhances like cancer is cancer. The 3D post-subtraction maximum intensity projection image from the foot of the bed shows a 2.5-cm, irregularly shaped enhancing mass (A). The lesion can be seen on this maximum intensity projection as if the observer is standing behind the patient (B). The lesion was excised (no longer evident on follow-up MRI) and proved to be a vascular benign lesion. |
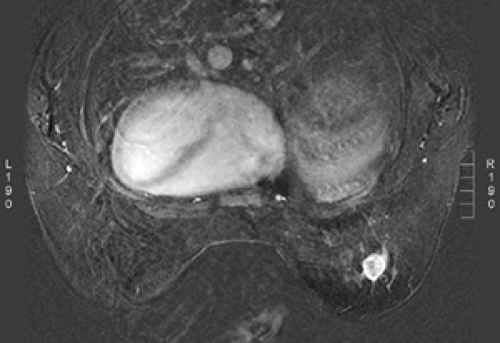 Figure 20-16 Rim enhancement. If scans are collected rapidly enough, many cancers display contrast enhancement at their periphery soon after the IV administration of contrast, as seen in this invasive ductal carcinoma. Over time most of these lesions fill in. This is likely due to the concentration of tumor neovascularity at the growing edge of the lesion. |
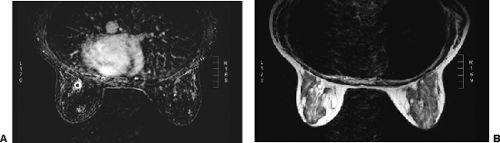 Figure 20-17 Occasionally, rim-enhancing lesions are cysts. Because it has a long T2, cyst fluid is bright on T2-weighted images. The rim-enhancing lesion seen on this T1-weighted image (A) following the IV administration of contrast and subtraction from the precontrast image is clearly a cyst, since its inside is bright on the corresponding slice of the T2-weighted image (B). This is presumably due to inflammation in the wall of the cyst, since most cysts do not display rim enhancement. |
Breast MRI is Sensitive But Not Specific
Since most cancers enhance, MRI is quite sensitive to the presence of breast cancer, but the specificity of the technique is fairly low. The low specificity is complicated by the fact that MRI-guided biopsies are fairly complicated, since they must be performed in the presence of the strong magnet field and there is limited space within the magnet, so the patient must be moved in and out during the procedure. This, coupled with the high cost of MRI in the United States, has slowed the introduction of MRI into the general breast imaging armamentarium.
MRI of The Breast and Breast Lesions
Background
Early studies demonstrated that MRI of the breast was not useful in distinguishing normal breast tissue from benign or malignant lesions due to poor spatial resolution, the overlap in lesion morphology, and signal intensities using the normal tissues’ T1 and T2 values (21). Noncontrast MRI could easily distinguish cysts and blood products based on their T1 and T2 values (Table 20-2) and MR behavior, but the ability to detect or aid in the diagnosis of breast cancer was lacking. Heywang et al were among the first to demonstrate that IV contrast material could help distinguish an abnormality from normal breast parenchyma on MR images (21,22). Since that time, the experience using Gd-DTPA enhancement suggests that the vast majority of malignancies demonstrate contrast enhancement. Unfortunately, some benign entities also enhance. The use of enhancement to separate the normal from the abnormal is somewhat complicated by the fact that normal breast parenchyma also enhances. Fortunately, the amount of normal parenchymal enhancement is much less than that of malignancies. Unfortunately, some benign lesions also show marked contrast enhancement in the early period after an IV bolus injection.
TABLE 20-2 ELATIVE SIGNAL INTENSITIES OF SILICONE, FAT, AND WATER ON MRI OF THE BREAST | ||||||||||||||||||||||||||||
|---|---|---|---|---|---|---|---|---|---|---|---|---|---|---|---|---|---|---|---|---|---|---|---|---|---|---|---|---|
| ||||||||||||||||||||||||||||
MRI and the Normal Breast
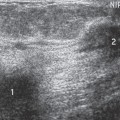
As a cross-sectional imaging technology, breast MRI provides new insights into the analysis of the breast and its anatomy, physiology, and histology. The relationship of breast tissue to the skin and muscular structures is easily appreciated (Fig. 20-18). The distribution of fibroglandular tissue and fat tissue is easily seen, and the wide variation in breast composition is more easily appreciated (Fig. 20-19). MRI can more accurately quantitate the volume of dense tissue. The normal nipple enhances in many women (23). It appears that it is usually the surface of the nipple that enhances (Fig. 20-20). The reason for this is unclear. An unexpected observation is that normal axillary lymph nodes also routinely enhance (Fig. 20-21). The lymph nodes are usually clearly defined and are often seen in close proximity to blood vessels. The periphery of the lymph node enhances, while the central fatty hilum remains low in signal intensity on subtracted images. MRI is not a very accurate way to evaluate the axillary lymph nodes, although special contrast materials are being evaluated that may permit more accurate detection of nodal metastases (24). Clearly, enhancement is related to blood supply and blood flow. There is a slow rise in the concentration of contrast material in normal breast tissues over time.
Contrast Enhancement Related to the Menstrual Cycle
Signal intensities of normal tissue can vary with the time in the menstrual cycle during which the scanning is performed (25). The maximum enhancement of the normal tissues of the breast occurs in the luteal phase, the week prior to menstruation (26), and may extend into the first week of the cycle (27,28). Unfortunately, enhancement associated with the hyperemia during the menstrual cycle is not always uniform (Fig. 20-22). It can be nodular, and some tissues can have rapid enhancement similar to malignant processes (27,28). If there is a choice, MRI of the breast is best performed between days 7 and 14 of the menstrual cycle. Anyone interpreting breast MRI must be prepared for the demonstration of numerous unexplained foci of enhancement regardless of the menstrual status. It is very common to have numerous enhancing foci (Fig. 20-23) that we group under the general term “physiologic enhancement.” There is as yet no histologic explanation for this phenomenon. The use of exogenous hormones can have a similar effect on the distribution of contrast (29), so ideally exogenous hormones should not be used for several weeks prior to the MR scan, if possible.
The challenge can be to try to detect an abnormality from among the benign changes (Fig. 20-24). We have used a threshold of 5 mm for intervening when a solitary lesion is detected only on MRI. Any focal, solitary enhancing lesion that is less than 5 mm, we will follow up in 6 months. If it remains stable at 6 months, we will generally not follow it any further. If it enlarges, we will try to biopsy it. This applies only to solitary lesions; if there are multiple enhancing foci that are diffuse and bilateral, we report them as physiologic and do not recommend a biopsy or follow-up. However, this approach is purely anecdotal and has not been validated scientifically.
The early efforts to develop thresholds that included “probably benign findings” on MRI that can be followed safely have not been very satisfying. Liberman et al (30) reviewed the results among 367 women who were studied using MRI because they were at high risk of developing breast cancer. Among these 367, there were 89 (24%) women whom they classified as having “probably benign” lesions by MRI. They performed follow-up MR imaging on 70 (79%) of the 89 women with a median follow-up time of 11 months (range 1 to 24 months). Among these 70, 20 women subsequently underwent biopsy at a median of 9 months (range 1 to 18 months). Among these 20, 14 were biopsied since the lesion had “progressed,” while 6 were biopsied for other reasons. Malignancy was diagnosed in 9 women, or 45% of the 20 women who underwent biopsy and 10% of the 89 women who had been classified as having “probably benign” lesions. Four of the women were diagnosed with ductal carcinoma in situ (DCIS) and five women had infiltrating ductal carcinoma. These are fairly high percentages, but the women were also at very high risk.
Sadowski and Kelcz had similar but somewhat better results among an undefined population of women (31). Between 1994 and 2002 they evaluated 473 patients using breast MRI. Among these, 79 (17%) were categorized as “probably benign” and 68 were followed for at least 2 years. The criteria for follow-up were “focal or diffuse mild enhancement and benign dynamic enhancement curves in the area of the mammographic abnormality, or because of the presence of microcalcifications on the mammogram, or because of incidental enhancing lesions.” With delays ranging from 14 to 18 months, there were four women (6%) who were diagnosed with breast cancer. This is a fairly low percentage but higher than the 2% that has been accepted as reasonable for mammographically detected lesions. It is clear that the definition of what constitutes a “probably benign” lesion based on MRI that is safe to follow needs refinement.
Stay updated, free articles. Join our Telegram channel

Full access? Get Clinical Tree


