Mammography and the Normal Breast
This chapter is primarily devoted to x-ray mammography using either film/screen systems or digital mammography. The appearances of the “normal” breast on ultrasound and magnetic resonance imaging are discussed in their respective chapters.
Mammography
The primary role of mammography is to screen asymptomatic women in the hope of detecting breast cancer at a smaller size and earlier stage than the woman’s own surveillance or her doctor’s routine examination might ordinarily achieve. Detecting cancers using mammography when they are at a smaller size and earlier stage has been shown to reduce or delay mortality from breast cancer (1,2,3,4,5).
Mammography is also used to evaluate women with clinically evident abnormalities. However, its utility as a diagnostic technique is limited by the fact that mammographically evident morphologic criteria are frequently not specific and precise diagnoses are rare. Mammography is best thought of primarily as a screening test. Although on occasion mammographic findings can accurately guide clinical management, the management of a clinically apparent lesion must ultimately be determined by the clinical assessment. Because mammography cannot be used to exclude breast cancer, and because mammographic findings are frequently not specific, in women who have a sign or symptom that might indicate breast cancer it should be used primarily to screen the remainder of the ipsilateral breast and screen the contralateral breast to detect clinically occult cancer (6).
Detection Versus Diagnosis
In 1979, Moskowitz (7) emphasized the difference between detection (screening) and diagnosis. Mammography is primarily useful for detecting abnormalities, including many early-stage and curable cancers. It is less valuable for diagnosis to determine whether a lesion that has been detected is benign or malignant. The distinction has become increasingly important as we enter a period in which large populations are being screened for breast cancer. If the benefits of screening are to be available to all women, the cost of mammography must be kept reasonable. Image quality, however, must be maximized. This can be accomplished by developing efficient screening programs. As has been shown in Europe as well as in the United States (8), costs can be reduced by separating screening (detection) from the evaluation of women who have a clinically evident problem or a problem detected by mammographic screening (diagnosis). Screening cases should be read in batches after the patient has left the center. This is more efficient than online reading. It also permits a less hurried review that reduces the chance of error. Batch reading also facilitates double reading (a desirable service, though not the standard of care).
To detect abnormalities in the breast, it is important to understand the normal breast. Complicating the process is the fact that there is a wide variation in “normal” as it appears on breast imaging studies. A familiarity with the range of “normal” is required for accurate imaging interpretation.
General Principles
The Normal Breast
In view of the enormous amount of work that has been done in an effort to understand the breast and the development of breast cancer, it is surprising that the normal breast has never been clearly defined. This is likely due to the fact that since breast cancer is really the only significant abnormality that occurs in the breast, it is really only the changes that appear to predispose to breast cancer that are
considered significant. There is a large range of histologic findings that occur in women who never develop breast cancer, but where “normal” ends and “abnormal” begins is not obvious. Not surprisingly, classifications in the past have been found to be inaccurate. For example, the term “fibrocystic disease” is still used by some although it has been discarded in favor of more accurate subcategorization of the changes that had been formerly grouped under this term. The change in terminology occurred when it was recognized that most of the findings that had been grouped in this nonspecific classification were of no particular significance and were so common that it would be difficult to classify them as a disease (9).
considered significant. There is a large range of histologic findings that occur in women who never develop breast cancer, but where “normal” ends and “abnormal” begins is not obvious. Not surprisingly, classifications in the past have been found to be inaccurate. For example, the term “fibrocystic disease” is still used by some although it has been discarded in favor of more accurate subcategorization of the changes that had been formerly grouped under this term. The change in terminology occurred when it was recognized that most of the findings that had been grouped in this nonspecific classification were of no particular significance and were so common that it would be difficult to classify them as a disease (9).
Compounding the difficulty of defining normal is the wide variation among individuals. It is also difficult to obtain significant amounts of histologic information concerning the normal breast at different ages because normal breasts are rarely available for histologic evaluation. The preponderance of data comes from autopsy series, which tend to be biased toward an older population of women or those with significant disease. Other data are derived from mastectomy material for cancer and breast biopsies, which are by definition abnormal tissue. Furthermore, because it is not possible to histologically follow the actual development, monthly changes, and long-term evolution of the mammary tissues in a single individual, most studies can look only at a cohort of women at one point in time. Inferences must be made by comparing histopathology from different women at varying ages, and these are influenced by such factors as reproductive history, environmental factors, and the use of exogenous hormones. Consequently, an accurate definition of what constitutes normality is difficult.
The Mammogram and The Menstrual Cycle
Although the physiologic changes of the menstrual cycle can be dramatic, it is far from clear what if any of the changes are visible by mammography. The effects of the menstrual cycle on the mammogram have been fictionalized, but little has been clearly documented. It has been my experience that it is extremely rare to see any obvious changes in mammographic tissue patterns in premenopausal women that can be attributed to the menstrual cycle, despite the fact that women are called back from screening studies for additional evaluation so that the imaging takes place during different times of the cycle. I suspect that any changes in such a short time are more likely due to differences in positioning and compression than true changes in the appearance of the tissues.
One study by Baines et al has suggested that the false-negative rate for mammography was higher among women who were screened in the luteal phase (days 15 to 28) of their menstrual cycle than among those screened during the follicular (days 1 to 14) phase of the cycle (10). Clearly the general poor quality of the mammography in the Canadian Screening Trial makes these data suspect. In addition, the authors did not take into account the fact that the breast may be more sensitive in the luteal phase and patients might not permit firm compression.
Another report with similar weaknesses (11) found that 28% of women had very dense breast tissue during the luteal phase of the menstrual cycle, while 23% to 24% of women had the densest breast patterns during the follicular phase. In addition to the subjective grading that was used, and the fact that the percentages are fairly close, the problem with an analysis such as this one is that it did not follow the same women through their cycles. Experienced radiologists will recognize that the breast rarely changes its tissue pattern suddenly. Large alterations in weight can cause a fairly dramatic change in density as fat is removed or accumulated in the breast. A small percentage of women (10% to 15%) when using exogenous hormones may have noticeably increased tissue density. The real effects of the menstrual cycle on the mammographic appearance of the breast have yet to be demonstrated.
Graham et al (12) used magnetic resonance imaging (MRI) to evaluate seven women during several phases of their menstrual cycles and suggested that water content and the volume of fibroglandular tissues increased at the end of the menstrual cycle and decreased at the beginning. However, the amounts were small, as was the number of women studied.
Hussain et al (13) found slight changes in breast volume on MRI that occurred with varying phases of the menstrual cycle, with an 8% increase in volume premenstrually.
Clinically there are fairly significant, cyclic changes that occur in the breast that vary with the individual. Histologic evaluation has documented significant, periodic cellular changes (14). Magnetic resonance data have demonstrated increased contrast enhancement during the premenstrual phase of the menstrual cycle (15), suggesting hyperemia, but correlates have never been histologically documented.
The Normal Mammogram
The spectrum of tissue patterns as seen by mammography is almost as varied as the individual. It is likely that all these variants are “normal.” In all likelihood, most breast cancers form in normal breast tissue, with a single cell developing the malignant genotype (and ultimately the malignant phenotype) that is transferred to its clones. Despite the difficulty in determining with any precision what is normal and what is abnormal, there are likely some abnormal breast tissues. The higher, and often bilateral, risk of breast cancer associated with atypical ductal or atypical lobular hyperplasia and lobular carcinoma in situ (LCIS) suggests that these precursor lesions may represent field abnormalities where a large number of cells are in some way
primed, increasing the likelihood that one cell or a group of cells will become overtly malignant. Because of this increased risk, it is reasonable to consider these abnormal breast tissues; however, with the exception of occasional calcium deposition, these tissues are indistinguishable from normal breast tissue on the mammogram. Although there appears to be some increased risk associated with the dense breast patterns (16), there are as yet no accurate indicators that are visible by mammography that can predict where, or even in whom, a cancer will grow. There are as yet no mammographically defined indications of the presence of either atypical hyperplasia or LCIS.
primed, increasing the likelihood that one cell or a group of cells will become overtly malignant. Because of this increased risk, it is reasonable to consider these abnormal breast tissues; however, with the exception of occasional calcium deposition, these tissues are indistinguishable from normal breast tissue on the mammogram. Although there appears to be some increased risk associated with the dense breast patterns (16), there are as yet no accurate indicators that are visible by mammography that can predict where, or even in whom, a cancer will grow. There are as yet no mammographically defined indications of the presence of either atypical hyperplasia or LCIS.
The presence of these high-risk lesions does seem to have some associations. For example, LCIS usually occurs in women whose breasts are radiographically dense. It is unclear whether this is due to the age at which LCIS is usually found (most often in the premenopausal woman) or a true relationship to breast density. Stomper et al (17) have noted, and our data agree, that atypical hyperplasia is often found by biopsies instigated by mammographically detected calcifications. They found that as a consequence, mammography was able to define more women with atypical hyperplasia than were found by biopsies due to clinically evident abnormalities. We have found a similar association with calcifications adjacent to LCIS. Georgian-Smith et al have described an unusual form of LCIS that produces calcifications (18), but we have found that LCIS is frequently detected by calcium disposition in adjacent benign tissue. Although these latter associations are interesting, their significance and practical use remain unclear.
Developmental Variations
The breasts usually develop in a fairly symmetric fashion. Although small areas of tissue are not identical in both breasts, the general distribution of tissues is symmetric, and tissues should be evaluated to search for asymmetries. Although the breasts generally develop simultaneously, occasionally one begins to develop before the other. As a consequence, the asymmetric development of one breast before the other, in the preadolescent or adolescent female, may be thought, by an inexperienced examiner, to represent a mass on clinical examination. Surgery should be avoided since this is almost always asymmetrical development of the breast bud. Removal of the breast bud will result in the subsequent failure of breast development. There are occasional masses that develop in the adolescent breast, but these are uncommon. They are virtually always benign and are almost always eccentric from the nipple. Since breast cancer is extremely rare among very young women and the odds are extremely high that a true mass is benign, observation rather than intervention is reasonable if there is any question.
Accessory and Ectopic Breast Tissue
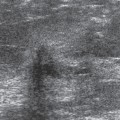
Fairly striking developmental variations in breast tissue are occasionally seen. Breast tissue may develop anywhere along the “milk line,” which, in the embryo, extends from the axilla to the groin. Ectopic breast tissue (discontinuous with the gland and in an uncommon location) is fairly unusual because all but the thoracic portion of the mammary ridge is usually resorbed during fetal development. Accessory breast tissue (extending from the main gland) is fairly common, appearing high in the axilla, either unilaterally or on both sides (Fig. 12-1). On rare occasions, an accessory nipple may be imaged (Fig. 12-2) or a complete accessory breast (Fig. 12-3). These variations are important because wherever there is ductal epithelium, it is possible for breast cancer to develop. Since the most common location of accessory tissue is in the axilla, the properly positioned mammogram should attempt to image as much tissue as possible in this area.
Asymmetric Breasts
Once development is complete, there is usually only a minor difference in the sizes of the two breasts. On occasion, however, one breast may develop noticeably larger than the other (Fig. 12-4). The exact reason for this has never been determined, but it is likely due to differential end-organ response to hormones and growth factors. Other than the psychological difficulty that this may induce, there is no reason to believe that it is of any particular consequence. Rapid asymmetric enlargement during adolescence can sometimes be caused by the growth of a giant fibroadenoma. Phyllodes tumors can also grow rapidly and result in breast enlargement. Very large cysts may occupy large volumes of the breast, but these usually do not occur until a woman is in her thirties.
It is rare that cancer will cause a significant enlargement of one breast without any other evidence of malignancy, such as a mass, skin thickening, or erythema. Similarly, nonneoplastic inflammation will almost always result in pain or erythema. Noticeably asymmetric breasts with no other associated abnormality are almost always a developmental phenomenon. Imaging is generally not indicated unless a mass or abscess is suspected.
Breast Size and Cancer Risk
Although one might expect that a greater volume of tissue might mean a greater risk of malignancy, there does not appear to be any obvious relationship between breast size and cancer development. There have not been any good studies of the relationship of risk to size, in part due to difficulty in measuring size. Using bra size as a crude measure
of breast size, we found that the percentage of women who were diagnosed with breast cancer was approximately the same for each size.
of breast size, we found that the percentage of women who were diagnosed with breast cancer was approximately the same for each size.
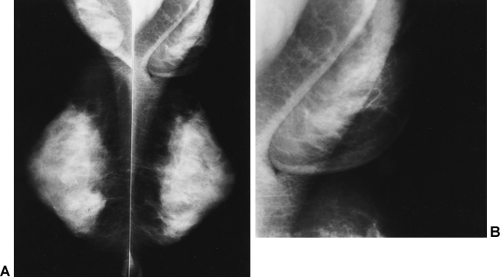 Figure 12-1 A Accessory breast tissue is seen high in the axilla on these mediolateral oblique projections. B The appearance of this tissue is identical to normal breast tissue on a photographic enlargement of the right axillary tail. |
Breast Composition
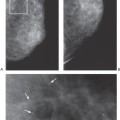
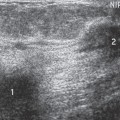
The composition of the breasts is also extremely variable. Adipose tissue represents a large portion of many breasts and is radiolucent. The radiographically visible densities include to varying degrees ducts, lobular elements, and fibrous connective tissue structures. Ducts can frequently be seen as thin linear structures (usually 1 mm or less in diameter) radiating back from the nipple and crisscrossing the tissues. Lobules and the intralobular connective tissue project as vague “fluffy” densities whose architecture can be seen following the injection of contrast material (Fig. 12-5A–C). The ducts and lobules are often hidden within the connective tissue (see Fig. 12-5D–G), and because they have the same x-ray attenuation as the connective tissue they are not visible.
There are two different types of connective tissue in the breast. The specialized intralobular connective tissues contribute to the visibility of the lobule. The major component of radiographic density on the mammogram is due to the extralobular connective tissues, which are likely responsible for most of the gross variations in tissue density. As noted earlier, studies have suggested that women whose breasts are radiographically dense are at greater risk for breast cancer. This debate has continued for over 20 years. There does appear to be some increased risk for women with dense patterns. This is an important relationship, and understanding it may reveal new insights into the etiology of breast cancer, but because cancer occurs in women with every tissue pattern, the radiographic density of the breast is important only in that the dense patterns can obscure a cancer. Since most women with dense patterns do not develop breast cancer and women with less dense patterns are not protected from breast cancer, none of the many tissue variations can truly be labeled as abnormal.
Breast Variation with Age
The conventional teaching has been that the breast, with its primitive ducts present at birth, develops during adolescence with growth into the mid-twenties, and “maturation” (end-bud differentiation into lobules) with the first full-term gestation. Conventional teaching further holds that the breast undergoes involution after menopause, with diminution in epithelial, stromal, and lobular elements and an increase in fat content. This “conventional wisdom” is actually not accurate. At least one autopsy series suggests that, in fact, involution significantly precedes menopause in many women and can begin as early as the third decade of life (19). Our own experience following mammographically determined tissue patterns shows the same changes.
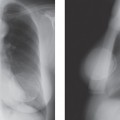
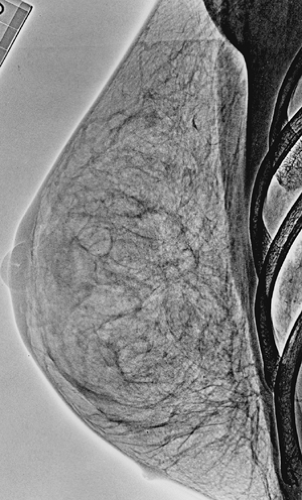 Figure 12-2 An accessory nipple is visible at the bottom of the breast on this lateral xerogram. |
In 1976, Wolfe (20) published a review of cases of women who had had mammograms over a 5- to 10-year period. He suggested that among some women in this group who had dense mammary tissues, involutional changes with fatty replacement were apparent on the subsequent mammograms. His conclusions, however, must be challenged. The images displayed in the article suggest that Wolfe was comparing tissue patterns obtained with the plain film techniques of the 1960s, which used low kilovolt peak (kVp) and produced high-contrast images, with the flatter, lower-contrast, wider exposure latitude xerographic images obtained at higher kVp in the 1970s. This comparison, coupled with the conventional teaching of fatty involution, may have biased his results. Other studies have shown that the percentage of younger women who have radiographically dense breasts is higher than that among older women, but this is far from universal, and there are many women in their 20s who have fat as the predominant
tissue and many women in their 80s who have extremely dense breast tissues.
tissue and many women in their 80s who have extremely dense breast tissues.
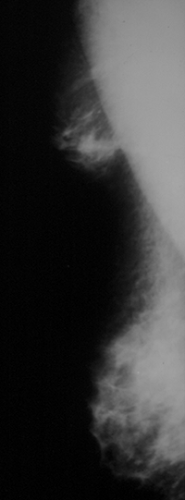 Figure 12-3 Accessory breast tissue can form a complete functioning breast that is capable of lactation. The tissue in this patient’s left axilla was a complete breast with its own separate nipple that lactated when she nursed. |
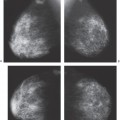
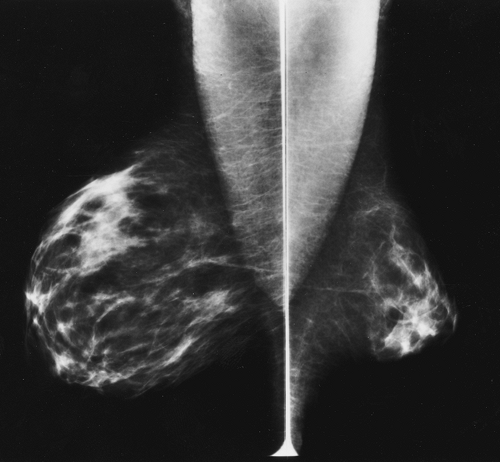 Figure 12-4 Both breasts are normal, even though the left breast developed to be considerably larger than the right. |
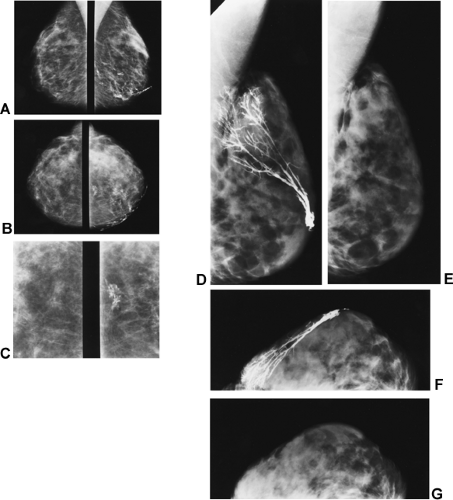 Figure 12-5 Ducts are fine linear structures, whereas lobules produce ill-defined densities. These structures are seen on the pre-contrast injection (left) and post-contrast injection (right), lateral A and craniocaudal projections B. The terminal ductules (acini) appear like fingers of a glove on this close-up view from the craniocaudal projection of the pre- and postinjection images C. The ducts are clearly visible when injected with contrast (D,F) but are normally silhouetted by the intra- and extralobular connective tissues (E,G). |
In our experience with women who have had mammograms over a period of 10 years or more, we have rarely seen a significant change in the radiographic density of the breast unless there has been a significant increase or decrease in body weight. In fact, it is likely that obesity is one of the most significant influences on tissue density, because the breast is one area where fat deposition and resorption are very common. Body habitus and percentage of body fat were not controlled for in Wolfe’s work.
Based on the involutional changes that have been fairly well documented at the microscopic level, one would expect changes in the radiographic appearance of the breast over time, but these have not been convincingly shown in longitudinal studies and may be too subtle to be obvious on mammography. We can only extrapolate from horizontal studies in which older women tend to have a greater proportion of fat in the breast than younger women. Progression from one radiographic pattern to another, in any large number of women, has never been objectively demonstrated.
Breast Density and Age
The failure to understand the changes that take place in the breast with increasing age has led many to continue to believe that there is a dramatic change in the mammogram at the age of 50 (used as a surrogate for menopause). This is an artifact of data analysis. Much of the confusion is due to analyses that group women into those younger than age 50 years and those older than age 50. By analyzing the data in this fashion, with a single age as the point of analysis, differences that occur steadily with age have been made to appear to occur at that age. If the point of analysis is age
50 years, any changes with age will appear to occur at that age (Fig. 12-6A). If the data are analyzed properly comparing ratios at each age, a different picture emerges (see Fig. 12-6B): women with dense patterns do not change their patterns at age 50 or at any other single point in life (Fig. 12-7


50 years, any changes with age will appear to occur at that age (Fig. 12-6A). If the data are analyzed properly comparing ratios at each age, a different picture emerges (see Fig. 12-6B): women with dense patterns do not change their patterns at age 50 or at any other single point in life (Fig. 12-7
Stay updated, free articles. Join our Telegram channel
Full access? Get Clinical Tree
