This review examines the role of metabolic connectivity based on fluorodeoxyglucose-PET in understanding brain network organization across neurologic disorders, with a focus on neurodegenerative diseases. The article explores key methodologies for metabolic connectivity study and highlights altered connectivity patterns in Alzheimer’s, Parkinson’s, frontotemporal dementia, and other conditions. It also discusses emerging applications, including single-subject analyses and brain–organ interactions.
Key points
- •
Molecular brain connectivity analyses capture statistical dependence between regional measures of molecular imaging. This article focuses on [18F]Fluorodeoxyglucose-PET-based connectivity, so-called metabolic connectivity (MC).
- •
MC analyses include several statistical methods such as seed-based correlation analysis, component analysis, and graph theory-based approaches.
- •
MC analyzes different signal origin than the blood–oxygen-level-dependent signal in fMRI but can also identify well-known networks at rest such as the default mode network, and the salience network.
- •
MC studies have revealed disturbed MC in all common neurodegenerative disorders, including Alzheimer’s disease, Parkinson’s disease, and dementia with Lewy body.
- •
Most MC studies rely on group-level studies of static fluorodeoxyglucose-PET images. Future perspectives include MC at the single subject level, with dynamic acquisitions (functional PET), and brain–body MC.
Introduction
Over the past decades, positron emission tomography (PET) imaging techniques have made significant advancements, including improved spatial and temporal resolution, and enhanced sensitivity. Parallelly, there has been a recent increase of the attention on PET-based connectivity analyses, with increasing popularity and acceptance of functional MR imaging-based functional connectivity.
Classically, the authors oppose structural connectivity to functional connectivity. Structural connectivity refers to the anatomic connections between brain regions through white matter fiber tracts. It is usually measured using diffusion tensor imaging in magnetic resonance imaging (MRI). Functional connectivity refers to the functional connections between regions, either at rest or during a task. Functional connectivity was defined by Karl Friston as “statistical dependencies among remote neurophysiological events.” Functional connectivity can be measured with several neuroimaging methods: functional MRI (fMRI) using blood-oxygen-level dependent (BOLD) sequences, electrophysiological measures using electroencephalogram (EEG), magnetoencephalography, and of course molecular imaging such as positron emission tomography (PET) and single photon emission tomography (SPECT). When connectivity measures are extracted from PET and SPECT, the authors define them as molecular connectivity.
In more details, molecular connectivity refers to the statistical dependence of regional measures of molecular imaging, assuming that regions with similar metabolic profiles or molecular characteristics are interconnected. Metabolic connectivity (MC) is the term used for molecular connectivity using [18F]fluorodeoxyglucose (FDG) PET. This article is dedicated to MC.
Many computational approaches deriving from graph theory and other statistical approaches such as seed correlation, independent component analysis (ICA), and sparse inverse covariance estimation (SICE) have been developed to extract MC measures, yielding a considerable amount of information about network organization.
Historically, the first interregional correlation imaging studies were with FDG-PET in the 1980s, a decade before the fMRI studies. Compared to fMRI, FDG-PET has the advantage to be a more direct reflection of neural activity than BOLD sequences that depend on blood flow, blood volume changes, and cerebral metabolic rates of oxygen, , offering a better signal-to-noise ratio and to be more quantifiable. PET also has the advantage of studying different possible molecular targets such as proteinopathies and neurotransmission.
The first network discovered in functional connectivity was the motor network . This discovery dates back to 1995 when Biswal and colleagues found that low-frequency fluctuations in the BOLD signal were synchronized between the left and right motor cortices in resting-state fMRI. This finding was pivotal in demonstrating that brain regions could be functionally connected even at rest, leading to the development of resting-state functional connectivity research and the later discovery of other networks like the default mode network (DMN).
In 2001, Raichle and colleagues found using FDG-PET a network that was consistently deactivated during goal-oriented tasks also called the DMN. The DMN primarily includes the medial prefrontal cortex, posterior cingulate cortex/precuneus, and inferior parietal cortex. , In fact, the DMN is characterized by activity during rest and internally focused tasks like daydreaming, internal thought processes and is typically deactivated during goal-oriented activities. As an example, a lower performance in working memory has been associated with reduced MC in the DMN of healthy subjects using FDG-PET.
Several other resting-state networks have been identified including the salience, visual, auditory, the right and left executive, attention, and the extrastriate networks.
The salience network, with core nodes in the anterior insular cortex and the dorsal anterior cingulate cortex, plays a crucial role in detecting behaviorally relevant stimuli and coordinating neural resources across other large-scale brain networks. This network integrates external sensory information with internal emotional and bodily state signals and is instrumental in regulating the interactions between the DMN and central executive network, particularly through the right anterior insular cortex, which acts as a hub for switching between these networks based on task demand. Understanding resting states network (RSN) in the normal brain is important to understand how MC measures can be disrupted in pathologic processes such as neurodegenerative disorders (NDDs).
This article endeavors to present a review of brain metabolic PET connectivity, emphasizing its pivotal role in elucidating the mechanisms underlying neurologic disorders, particularly NDDs.
Common methods for MC analyses are presented in the first section. The second section is dedicated to MC in comparison with fMRI. The following sections discuss representative MC studies in neurodegenerative diseases. Then, the authors overview some MC studies in psychiatric disorders and epilepsy. Finally, they cast a spotlight on prospective avenues in the field such as inter-organ connectivity studies, and strategies applicable to investigating MC at the single-subject level, which holds promise not only for research but also for diagnostic purposes.
Methodologies in metabolic connectivity studies
In this section, we will explain the principles of MC analyses. , ,
Seed Correlation or Interregional Correlation Analysis
Seed-based correlation analysis (SBCA) involves selecting a specific brain region (the “seed”) and examining how the activity in that seed region correlates with activity in other parts of the brain. The seed region is typically chosen based on prior knowledge, or a hypothesis about the network of interest, or data-driven from prior analysis on the same population. Hence, MC of the whole brain cannot be investigated.
The time-activity curve (the time series of PET signal changes) or a value from the seed region is extracted. This curve or value is then correlated with the time-activity curves or values from all other brain voxels or regions. Regions that show a strong correlation with the seed are considered to be functionally connected to it, and these regions are defined as resting-state networks.
SBCA is widely used to investigate MC in well-defined networks. For instance, this method was used to study connectivity applied to dopaminergic pathways using Fluorodopa PET, FDG-PET, and dopamine transporter SPECT in a recent study.
Component Analysis
I ndependant component analysis ( ICA ) and principal component analysis (PCA) are both data-driven methods for dimensionality reduction. Both methods do not require the selection of a seed region, making them unbiased approaches to network identification.
ICA seeks to find statistically independent components or sources within the data. PET data are decomposed into a set of independent components based on the assumption that the observed signals are mixtures of underlying independent sources. Each component represents a network of brain regions that are functionally connected. ,
PCA aims to find new axes (principal components) that capture the maximum variance in the data. It identifies the directions (principal components) along which the data vary the most, without necessarily considering the statistical independence of these directions.
ICA is particularly useful for identifying large-scale brain networks, without any prior assumptions, and may be used at the single-subject level.
Graph Theory-Based Approaches
Graph theory provides a mathematical framework for analyzing the brain as a network, where brain regions are represented as “nodes” and the functional connections between them as “edges.” , PET connectivity data are used to construct a graph. Nodes represent different brain regions, and edges represent the strength of the functional connections between them. Various graph metrics, such as degree (number of connections), clustering coefficient (degree to which nodes cluster together), or path length (shortest path between nodes), can be calculated to assess the topological properties of the brain network.
Graph theory-based approaches are powerful for understanding the overall organization of brain networks, identifying hubs (regions with many connections), and characterizing the network’s efficiency and robustness.
Statistical dependence between different regions can be determined using simple methods such as correlation, or by using more sophisticated solutions as SICE, particularly when dealing with high-dimensional data with limited samples. Unlike correlation-based approaches, which measure direct and indirect connections, SICE identifies direct connections between brain regions by estimating the inverse covariance matrix. In this context, the nonzero elements of the inverse covariance matrix represent direct functional or metabolic connections.
One key advantage of SICE is its ability to provide sparse solutions, meaning that it effectively highlights the most critical connections while reducing the influence of noise. This sparsity is particularly important in PET studies, where the number of regions often exceeds the number of available scans.
These methods are currently the most developed. As for ICA, graph theory approaches permit the study of the “whole-brain” connectivity.
Each of these methods provides unique insights into brain connectivity. Before being applied to the study of neurologic disorders, these methods were first used to study connectivity at rest in the normal brain.
Metabolic connectivity versus fMRI functional connectivity
The principle of MC is that regions in the brain that share similar metabolic profiles in FDG-PET are interconnected. The basic assumption of functional connectivity in fMRI is that if the signal in 2 parts of the brain evolves similarly, these 2 regions are functionally connected. It is important to acknowledge that most connectivity studies using FDG-PET derive from static volume analyses—one image per subject —so without temporal/dynamic information, as opposed to fMRI (see paper by Sala and colleagues for more information) . A few studies investigate connectivity from dynamic PET protocols in a what-so-called functional PET (fPET; see last paragraph). ,
Nevertheless, several studies have shown that MC from static FDG-PET is close to resting state fMRI, , although the origin of the neural signal registered is different.
Functional MRI, which relies on the BOLD signal, measures real-time fluctuations in blood oxygenation levels in the brain linked to neural activity: the neurovascular coupling. It is the relationship between neural activity and subsequent changes in blood flow, blood volume, and the ratio of oxygenated hemoglobin to deoxygenated hemoglobin. When a specific brain region becomes more active, it consumes more oxygen. To compensate, the body increases blood flow to that area, leading to a relative increase in oxyhemoglobin and a decrease in deoxyhemoglobin detected on BOLD signal. Overall, the BOLD signal serves as an indirect measure of neural activity by tracking these blood flow and oxygenation changes, rather than directly measuring neuronal firing. ,
In contrast, the measure of glucose metabolism reflects neural activity via glucose consumption and astrocytes functioning. Since glucose consumption is less dependent on neurovascular coupling, it offers a more stable view of brain activity. This difference allows FDG-PET to provide more robust and reproducible data at the single-subject level. ,
While MC using FDG-PET and functional connectivity using BOLD fMRI measures are close, some differences have been reported , , in studies specifically comparing both modalities.
With spatial-ICA, Di and colleagues compared resting state networks using FDG-PET and fMRI in 155 elderly subjects. Most homotopic networks were found in both imaging modality such as visual, auditory, motor, cerebellar, and subcortical regions. Compared to fMRI, PET showed reduced intersubject metabolic covariances in these networks. They concluded that differences in MC and fMRI connectivity might reflect differences in energy consumption and neural synchronization across modalities.
In a comparison of resting-state networks with ICA using PET and fMRI, Savio and colleagues identified in 22 healthy middle-aged subjects 13 out of 20 components in PET data and 17 in fMRI data as meaningful. Ten resting state networks were common to both modalities, though spatial overlap varied from moderate (eg, primary visual, sensorimotor, DMN) to fair (eg, secondary visual, cerebellar, left central executive network, auditory networks), while executive control and right central executive networks showed poor overlap. Seven resting state networks were unique to fMRI, including salience and anterior DMN, while 4 were exclusive to PET, such as subcortical networks and mesial parietal and prefrontal networks.
Finally, Lizarraga and colleagues studied in 56 healthy subjects the similarity at the whole brain level between connectivity measures from fMRI (functional connectivity) and from intersubject covariance of regional FDG-PET. They found a convergence ratio of 46% and Spearman of 0.30.
Metabolic connectivity using FDG-PET applied to neurodegenerative disorders
Dysfunctional connectivity patterns have been implicated in several NDDs, including Alzheimer’s disease (AD), Parkinson’s disease, and dementia with Lewy bodies (DLBs).
Applications in Alzheimer’s Disease
AD has been the most studied NDD in MC particularly regarding changes in the DMN (see Heyer and colleagues for an extensive review).
AD is characterized by hypometabolism in associative posterior regions, including the posterior cingulate cortex, which is part of the DMN. Studies have shown a progressive decline in MC as cognitive impairment worsens, starting from normal aging through mild cognitive impairment (MCI) to AD. ,
For instance, Pagani and colleagues demonstrated that in patients progressing from normal aging to AD (including stable MCI, and MCI converting to AD), there is a gradual breakdown of MC, especially in the DMN, with distinct AD-specific components becoming evident in the late-MCI stage.
Similarly, Morbelli and colleagues reported reduced MC in both hypometabolic and non-hypometabolic areas in patients with MCI who later converted to AD, suggesting large-scale network disruptions at the prodromal stage.
Further, disruption in “normal” connectivity has been observed in critical DMN areas, such as the dorsolateral prefrontal cortex and hippocampi, , and between the posterior cingulate cortex and hippocampi, which are typically well connected in healthy individuals. In more details, Ripp and colleagues found reduced integrity of the posterior part of the DMN in AD in FDG-PET, more specifically than using fMRI.
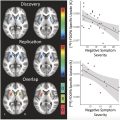
Titov and colleagues found significant intralobar connectivity changes, particularly in the parietal lobe, while Ballarini and colleagues observed that psychiatric symptoms in early-onset AD are linked to increased MC in the salience network and decreased MC in the DMN. Additionally, Hsu and colleagues highlighted altered dopaminergic networks in AD.
Interestingly, some studies have noted factors that can mitigate these connectivity disruptions. For example, higher cognitive reserve—linked to education, bilingualism, and gender—has been associated with increased MC in certain brain regions of patients with AD, suggesting compensatory mechanisms. , Morbelli and colleagues found that highly educated prodromal patients with AD recruit compensatory neural networks, such as the right dorsolateral prefrontal cortex.
Malpetti and colleagues identified more efficient network functioning in different regions based on gender: greater efficiency in the posterior DMN for male individuals, and in the anterior frontal executive network for female individuals. Perani and colleagues demonstrated that bilingualism enhances connectivity in the executive control and DMN networks.
Applications in Parkinson’s Disease and Parkinson Atypical Syndromes
Spetsieris and colleagues identified disruptions in the DMN MC linked to cognitive decline in advanced Parkinson’s disease (PD), and Ruppert and colleagues an altered DMN connectivity in PD without cognitive decline and PD with MCI. Sala and colleagues confirmed these findings and further revealed that PD-related connectivity changes extend beyond the DMN, affecting frontal regions across nearly all large-scale brain networks. Additionally, the study highlighted widespread connectivity reductions, both local and long distance, in the frontolateral cortex. Ruppert-Junck and colleagues also reported reduced nodal degrees in the subcortical, frontal, and temporal regions in patients with PD compared to healthy controls.
On the other hand, PD seems associated with enhanced coupling of cortical motor regions. A recent study found significantly higher cortical motor area connectivity in PD than in healthy controls that correlated with disease severity.
In PD, a potential compensatory connectivity increase has also been observed in the occipital cortex. ,
Interestingly, this pattern was the opposite of that found in DLB, where occipital connectivity decreases and frontal increases. Despite differences in occipital connectivity, PD and DLB exhibited shared connectivity disruptions in the cerebellum and mesencephalic-pontine areas, early sites of α-synuclein pathology in both disorders. , ,
Choi and colleagues found in patients with DLB reduced interregional connectivity between motor cortex–striatum, midbrain–striatum, striatum–globus pallidus, and globus pallidus–thalamus and also reduced intra-regional connectivity in the motor cortex, and the striatum. These results suggested a disruption in the striato-thalamo-cortical circuit in DLB irrespective of Parkinsonism.
Stockbauer and colleagues identified specific MC changes in patients with DLB. DLB with and without dopaminergic loss exhibited similar patterns of hypometabolism in the parietal and occipital cortices and hypermetabolism in regions like the basal ganglia, limbic system, and motor cortices, with correlated MC changes.
Caminiti and colleagues evaluated MC changes in men and women with DLB. They identified a shared pattern of MC in both sexes with a clinical diagnosis of DLB. The common connectivity changes were linked to the posterior cortical vulnerability that uniquely defines the DLB condition. However, male individuals exhibited more pronounced brain hypometabolism and long-distance connectivity disruptions in the typical DLB-affected regions, potentially explaining the clearer symptom-related diagnosis observed in men compared to women.
To our knowledge, no MC studies were conducted in multiple system atrophy, supranuclear palsy, and corticobasal dementia.
Applications in Frontotemporal Dementia
In a cohort of 52 frontotemporal lobar degeneration (FTLD), Titov and colleagues identified abnormal metabolic connections in FTLD, predominantly clusters in the frontal and temporal lobes, confirmed by Malpetti and colleagues and Rus and colleagues.
In a cohort of 33 behavioral FTD (bvFTD), Liu and colleagues reported an altered MC within the limbic cortico-striato-thalamo-cortical circuit in presymptomatic and symptomatic bvFTD.
Additionally in bvFTD, Ripp and colleagues found reduced integrity of RSN anterior DMN, salience network, and right central executive network, whereas Malpetti and colleagues found altered MC in all major RSN. Frontal bvFTD variant had more MC alterations in orbitofrontal regions and anterior resting-state networks, while temporo-limbic bvFTD had more MC alterations in the limbic and salience networks.
Applications to Amyotrophic Lateral Sclerosis
In a cohort of 195 patients with amyotrophic lateral sclerosis (ALS), Pagani and colleagues reported MC changes in ALS in addition to hypermetabolism in the midbrain and hipocampal cortex, hypometabolism of left sensorimotor, and dorsolateral prefrontal cortex. Voxel-wise interregional correlation analysis revealed the correlation of the hypermetabolic cluster in the midbrain with metabolism in the cerebellum and white matter tracts.
To our knowledge, no MC study is available in Limbic-predominant age-related TDP-43 encephalopathy.
Metabolic connectivity using FDG-PET applied to other disorders
MC changes have been described in other neurologic disorders than NDDs such as psychiatric disorders and epilepsy.
Applications to Psychiatric Disorders
MC changes have been studied in several neuropsychiatric disorders such as depression, schizophrenia, non-epileptic seizures, and acrophobia to cite a few. Mah and colleagues found in depressed patients with bipolar depression type II altered connectivity within limbic–cortical–striatal networks, showing multiple abnormal interactions not present in healthy controls.
Several studies reported MC changes in schizophrenia. ,
Verger and colleagues found that after virtual reality exposure therapy for acrophobia, patients showed increased MC between the left frontal and precentral gyri and bilateral occipital areas, suggesting enhanced coordination in the visual-motor control system associated with clinical improvement.
MC changes might be observed in psychogenic non-epileptic seizures, as reported by Arthuis and colleagues who found an increase in metabolic correlation in this condition between the right inferior parietal region and the bilateral cerebellum, and between the bilateral anterior cingulate cortex and the left parahippocampal gyrus.
Applications to Epilepsy
Epilepsy has been associated with MC changes, with drug-resistant temporal lobe epilepsy (TLE) being the most studied.
Shim and colleagues found that TLE patients with hippocampal sclerosis (HS) exhibited decreased global connectivity and increased modularity, as well as altered local connectivity, whereas TLE patients without HS showed no global connectivity changes compared to healthy controls.
Trotta and colleagues examined how unilateral mesiotemporal lobe epilepsy (MTLE) with HS alters connectivity in the brain, focusing on the non-epileptic amygdalo-hippocampal complex (AHC). They found that patients with MTLE had reduced connectivity between the non-epileptic AHC and certain cortical regions, such as the ventral prefrontal cortex and temporal pole, but increased connectivity with midline structures, potentially explaining cognitive and emotional challenges in these patients, with the non-epileptic AHC’s link to the epileptic side playing a key role in these changes.
MC may also predict surgical outcome. Cho and colleagues reported in a cohort of 75 patients with TLE significant differences in preoperative metabolic networks regarding surgical outcome, with a lower assortative coefficient in seizure free patients. In 107 patients with TLE, Doyen and colleagues found that strengthened epileptogenic connectome was associated with non-free-seizure outcomes.
In insular epilepsy, Zhao and colleagues found that patients exhibited increased MC between the insula and opercular cortex, along with disrupted network organization characterized by excessive local connections and reduced small-worldness, reflecting abnormal synchronization and impaired global communication across brain regions.
Mcgonigal and colleagues investigated metabolic changes in patients with generalized seizures and postictal generalized suppression, finding disrupted connectivity in cortical and subcortical structures predominant in the right hemisphere in patients with high-risk postictal generalized suppression.
Long COVID Disease
In a recent study (under submission—not published yet) , Verger and colleagues are investigating MC in a large cohort of patients with long COVID disease with MC changes in the regions classically affected in long COVID.
Future perspectives: single-level subjects, interorgan metabolic connectivity
PET at a Single Subject Level
As mentioned earlier, most MC analyses are conducted at the group-level with one image per subject (without time series information). To give individual insights into MC measures, statistical methods can be applied to group-level analysis, leading to single-subject results derived from group-level results. Currently, ICA is a validated method to do so. Independent component analysis involves analyzing connectivity patterns across subjects to identify common networks and then computing how strongly each subject’s data loads onto these identified networks. This helps estimate individual connectivity metrics based on group findings. Another approach at the single subject level to classify subjects can be derived from SICE.
Another approach that directly measures PET at the single subject level is what is called functional PET ( fPET ), where dynamic protocols are used to register PET signal overtime in a single subject. ,
Currently, functional PET needs the use of a continuous FDG infusion ± an FDG bolus at the beginning of the infusion, which is more restrictive to use. , The statistical dependence between the time-activity curves of the different brain regions is then analyzed to determine connectivity at the individual level.
In a recent fPET study, Deery and colleagues could explore the effect of aging on MC. Aging was associated with reduced global integration of metabolic hub regions, smaller energy budget in comparison to younger adults, and the use of a higher proportion of energy to support posterior hub regions.
In a future perspective, with the increase in sensitivity of novel PET cameras, it would be valuable to assess fPET at the single subject level using classic bolus injection, as for static PET. However, this faces the issue of low signal-to-noise ratio at the single subject level compared to the group level.
Whole-Body PET Imaging to Study Connectivity
With the emergence of total-body PET imaging, it is now possible to study brain–organ MC, using segmentation methods as proposed by Reed and colleagues. Their analysis on healthy subjects revealed significant brain–organ metabolic connections, particularly between the liver and various brain regions, including the temporal, occipital, and parietal lobes. Studying brain–organ connectivity is a promising field of research. For example, the gut-brain axis is increasingly recognized as a critical factor in the development and progression of NDD, offering potential avenues for therapeutic intervention through modulation of the gut microbiome.
The gut-brain axis, a bidirectional communication network between the gastrointestinal tract and the central nervous system, plays a crucial role in the pathogenesis of both AD and PD. In AD, gut dysbiosis—imbalances in the microbial communities within the intestines—has been linked to neuroinflammation and amyloid plaque formation, both hallmark features of the disease. Similarly, in PD, gut dysbiosis is thought to contribute to the misfolding of α-synuclein, a key protein involved in the disease, and to the initiation of neuroinflammation.
Summary
This article overviews common methods of assessing MC and elaborates the contribution of MC studies to understanding the brain’s network organization in health and neurologic disorders. Future promising directions include single-subject connectivity analyses and whole-body PET imaging for brain–organ interactions, as for the gut-brain axis. As for functional connectivity using fMR imaging, MC provides a valuable and distinct approach for network analysis, offering both clinical relevance and new avenues for personalized diagnostics.
Clinics care points
- •
Altered metabolic connectivity patterns have been observed through FDG-PET in all main neurodegenerative diseases such as Alzheimer’s disease (AD), Parkinson’s disease (PD), and dementia with Lewy bodies (DLB).
- •
Altered MC patterns may help understanding pathophysiology underlying these neurodegenerative disorders, and their progression; and might become a tool at the individual level.
Related posts:
 Movement Disorders and Its Variants
 A Brief History and the Use of PET in the Diagnosis and Management of Schizophrenia
Brain Tumor Assessment
A Brief History and the Use of PET in the Diagnosis and Management of Schizophrenia
Brain Tumor Assessment
 Brain PET Imaging in the Presurgical Evaluation of Drug-Resistant Focal Epilepsy
 Clinical Applications of PET Imaging in Alzheimer’s Disease
Brain Tumor Assessment
Clinical Applications of PET Imaging in Alzheimer’s Disease
Brain Tumor Assessment
Stay updated, free articles. Join our Telegram channel

Full access? Get Clinical Tree


