formation, as reflected in excessive urinary uric acid excretion (more than 600 mg/day) measured while the patient is maintained on a standard purine-free diet. Increased production can also be seen in gout secondary to myeloproliferative disorders associated with increased destruction of cells and result in increased breakdown of nucleic acids. Decreased excretion occurs in primary gout in patients with a dysfunction in the renal tubular capacity to excrete urate and in patients with chronic renal disease. In most patients, however, there is evidence of both: uric acid overproduction and diminished renal excretion of uric acid.
Table 7.1 CLINICAL AND IMAGING HALLMARKS OF METABOLIC, ENDOCRINE, AND CRYSTAL DEPOSITION ARTHROPATHIES | ||||||||||||||||||||||||||||||||||||||||||||||||||||||||||||||||||||||||||||
|---|---|---|---|---|---|---|---|---|---|---|---|---|---|---|---|---|---|---|---|---|---|---|---|---|---|---|---|---|---|---|---|---|---|---|---|---|---|---|---|---|---|---|---|---|---|---|---|---|---|---|---|---|---|---|---|---|---|---|---|---|---|---|---|---|---|---|---|---|---|---|---|---|---|---|---|---|
|
 Figure 7.1 ▪ Pathology of gouty arthritis. A: Gross specimen of an amputated finger from a patient with gout shows the large chalky white deposits of monosodium urate crystals. B: Sagittal section of the specimen shows the extent of the tophaceous deposit and bone destruction. C: The radiograph of the specimen shows large gouty tophi and articular bone destruction. (From Bullough PG. Atlas of Orthopedic Pathology with Clinical and Radiologic Correlation. 2nd ed. New York, NY: Gower Medical Publishing; 1992, Figs. 11.33, 11.34, and 11.35, p. 11.12.) |
helps differentiate this condition from rheumatoid arthritis. The reason for the absence of osteoporosis is that the duration of an acute gouty attack is too short to allow the development of the disuse osteoporosis so often seen in patients with rheumatoid arthritis. If erosion involves the articular end of the bone and extends into the joint, part of the joint is usually preserved (Fig. 7.10A, see also Fig. 7.5). Unlike rheumatoid arthritis, periarticular and articular erosions are asymmetric in distribution (Fig. 7.11). In chronic tophaceous gout, monosodium urate crystal deposit in and around the joint is seen, creating dense masses in the soft tissues called tophi, which frequently exhibit calcifications (Figs. 7.12, 7.13, 7.14, 7.15, see also Figs. 7.1 and 7.2). Characteristically, tophi are randomly distributed
and are usually asymmetric; if they occur in the hands or feet, they are more often seen on the dorsal aspect (Fig. 7.16). Currently, dual-energy CT (DECT) color-coded images can accurately depict gouty tophi (Figs. 7.17, 7.18, 7.19, 7.20, see also Figs. 2.27 and 2.28). DECT has ability to extract information and characterize the chemical composition of material according to the differential x-ray photon energy-dependent attenuation of compounds being examined at two different energy levels. Reported sensitivity of this technique varies between 78% and 100% and specificity between 89% and 100%. Magnetic resonance imaging is also an effective way to detect articular and soft tissue abnormalities of gouty arthritis. Tophaceous gouty deposits exhibit a wide spectrum of signal intensities characteristics, which reflects their variable composition and relative proportion of protein, fibrous tissue, crystals,
and hemosiderin. Most lesions are isointense relative to muscle on T1-weighted images, and low-to-intermediate heterogeneous signal intensity on proton density-weighted and water-sensitive (IR, T2) sequences (Fig. 7.21). There is strong enhancement following intravenous injection of gadolinium, although contrast enhancement of the tophus is variable and depends on the vascularity of the affected synovium and surrounding granulation tissue (Fig. 7.22). Concomitant enhancement of adjacent tendon sheaths, ligaments, muscles, and bone marrow may also be present, reflecting intense inflammatory reaction.
 Figure 7.2 ▪ Histopathology of gouty arthritis. A: Low-power photomicrograph of a portion of the joint shown in Figure 7.1 depicts the erosion of the bone and articular cartilage by an amorphous material (H&E, original magnification ×2.5). B: On slightly higher magnification observe bluish amorphous material surrounded by bundles of dense collagenized tissue and inflammatory cells (H&E, original magnification ×4). C: Same field examined by polarized light demonstrates the birefringence of the crystalline material (H&E, polarize light, original magnification ×4). D: On the higher magnification, note a thin layer of mononuclear and giant cells surrounding the amorphous crystalline deposit, with an occasional sprinkling of chronic inflammatory cells (H&E, polarized light, original magnification ×25). (From Bullough PG. Atlas of Orthopedic Pathology with Clinical and Radiologic Correlation. 2nd ed. New York, NY: Gower Medical Publishing; 1992, Figs. 11.37, 11.38, and 11.39.) |
 Figure 7.3 ▪ Gouty arthritis. A: Dorsovolar radiograph of the left hand of a 55-year-old man shows small periarticular erosions at the proximal interphalangeal joints of the index, middle, and small fingers (arrowheads) with associated soft tissue tophi (arrows). B: Dorsovolar radiograph of the left hand of a 51-year-old man shows small periarticular erosions at the proximal interphalangeal joints of the index, middle, and small fingers and at the first metacarpophalangeal joint with associated soft tissue tophi. C: Dorsoplantar radiograph of the left forefoot of a 68-year-old man shows periarticular erosions of the first, second, and third metatarsal heads, as well as at the bases of the proximal phalanges of the great, second, and third toes. Note preservation of the joint spaces. |
 Figure 7.4 ▪ Gouty arthritis. A: Dorsovolar radiograph of the left hand of a 43-year-old man with tophaceous gout shows multiple sharply marginated articular and periarticular erosions and soft tissue masses at the proximal interphalangeal joints of the index and middle fingers, representing tophi. B: Dorsovolar radiograph of the fingers of a 70-year-old man with gouty arthritis shows multiple articular and periarticular erosions associated with large tophi (arrows). |
 Figure 7.5 ▪ Gouty arthritis. Anteroposterior (A) and oblique (B) radiographs of the right great toe of a 58-year-old man with a 3-month history of gout shows the typical involvement of the first metatarsophalangeal joint. Note the characteristic “overhanging edge” of the erosive changes (arrows), preservation of the lateral portion of the joint (open arrow), and a large tophus (arrowheads). |
 Figure 7.6 ▪ Gouty arthritis. Typical para-articular erosions in the distal inter-phalangeal joint of the index finger exhibiting an “overhanging edge” are associated with a large tophus. |
 Figure 7.7 ▪ Gouty arthritis. A: Dorsoplantar radiograph of the left foot of a 71-year-old man shows destruction of the second metatarsophalangeal joint exhibiting overhanging edges. B: Oblique radiograph of the left foot of an 80-year-old man shows erosions at the first metatarsophalangeal joint. Observe overhanging edge and preservation of part of the joint. |
 Figure 7.8 ▪ Gouty arthritis. Dorsovolar radiograph of both hands of a 60-year-old man shows articular and periarticular erosions. In addition, note the presence of intraosseous defects in the phalanges consistent with intraosseous tophi. |
 Figure 7.9 ▪ Gouty arthritis. Radiograph of the index finger of a 65-year-old man shows the intraosseous tophi within the middle and distal phalanges. |
 Figure 7.10 ▪ Gouty arthritis. A: Dorsoplantar radiograph of the left foot of a 62-year-old man with a long history of tophaceous gout shows multiple erosions involving the joints of the great and small toes and the base of the fourth and fifth metatarsals. The first metatarsophalangeal joint is partially preserved, a characteristic feature of gouty arthritis. A large soft tissue mass of the great toe represents a tophus. Dorsoplantar radiograph of the left foot (B) and lateral radiograph of the left ankle (C) of a 49-year-old man show numerous articular and periarticular erosions of the midfoot and Lisfranc joint and destruction of the second metatarsophalangeal joint associated with several soft tissue tophi. |
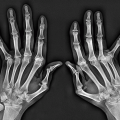
 Figure 7.11 ▪ Gouty arthritis. A: Dorsovolar radiograph of the hands of a 64-year-old woman shows the typical asymmetric distribution of periarticular and articular erosions. Note involvement of the carpometacarpal joints of the right hand (arrows), a typical site for gout. B: Dorsovolar radiograph of the hands of a 58-year-old man shows periarticular erosions and soft tissue tophi of the proximal interphalangeal joints of the index, middle, and small fingers of the left hand. There are also tophi at the first and second metacarpophalangeal joints (arrows), but no erosions are present. In the right hand, a soft tissue tophus is seen adjacent to the hamate bone (arrowhead). C: Dorsoplantar radiograph of the feet of a 46-year-old man shows asymmetric distribution of the articular and periarticular erosions, some of them associated with soft tissue tophi. |
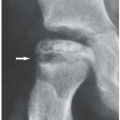
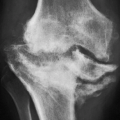
 Figure 7.12 ▪ Gouty tophi. A: Lateral radiograph of the elbow of a 73-year-old man with a 30-year history of gout shows a tophus with dense calcifications adjacent to the olecranon process, which exhibits small erosion. B: Dorsoplantar radiograph of the right forefoot of a 69-year-old man shows densely calcified prominent tophi at the fifth and first metatarsophalangeal joints (arrows). Note small periarticular erosion at the base of the proximal phalanx of the great toe (arrowhead). C: Lateral radiograph of the right knee of a 60-year-old man shows a large infrapatellar tophus (arrow). There are no articular erosions present, but there is a small suprapatellar joint effusion (arrowheads). |
 Figure 7.13 ▪ Gouty tophi. Anteroposterior radiograph of both feet (A) and lateral radiograph of the left foot (B) of a 69-year-old man show numerous gouty tophi (arrows). Note also a characteristic for this arthritis erosion of the first metatarsophalangeal joint of the left foot. C: Radiograph of the great toe of a 54-year-old man shows a large tophus adjacent to the first metatarsophalangeal joint. Note also small erosions at the base of the proximal phalanx and at the medial aspect of the first metatarsal head. |
 Figure 7.14 ▪ Gouty tophi. Dorsoplantar radiograph of both feet (A) and dorsovolar (B) and lateral (C) radiographs of both hands of an 81-year-old man show numerous calcified tophi associated with periarticular and articular erosions. |
 Figure 7.15 ▪ CT of gouty tophus. Sagittal reformatted CT images of the elbow viewed in bone (A) and soft tissue (B) window show a large soft tissue mass with numerous calcifications adjacent to the olecranon process of ulna. |
 Figure 7.16 ▪ Gouty tophus. Dorsoplantar (A) and lateral (B) radiographs of the great toe show articular and periarticular erosions (arrows) associated with a large tophus on the dorsal aspect of the first metatarsophalangeal joint (arrowheads). |
 Figure 7.17 ▪ Dual-energy CT of tophaceous gout. A: Merchant view of the left knee of a 68-year-old man shows a radiolucent defect in the medial aspect of the patella (arrow). B: Two dual-energy color-coded axial CT images show a soft tissue, monosodium urate crystal-containing tophus (green foci) eroding medial aspect of the patella. |
 Figure 7.18 ▪ Dual-energy CT of tophaceous gout. Anteroposterior radiograph of the right foot (A) of a 48-year-old man shows nonspecific erosion at the third tarsometatarsal joint (arrow), confirmed on the coronal reformatted CT image (B). Dual-energy coronal (C) and 3D reconstructed (D) color-coded CT images show in addition several masses (green areas) representing uric acid crystals within the gouty tophi. |
 Figure 7.19 ▪ Dual-energy CT of tophaceous gout. A 50-year-old man presented with painful swollen third toe of the left foot. A: Anteroposterior radiograph shows a para-articular erosion of the proximal phalanx of the third toe (arrow), associated with a fusiform mass (arrowhead). Dualenergy sagittal reformatted (B) and axial color-coded (C) CT images supplemented with 3D reconstructed CT color-coded image (D) viewed from the plantar aspect of the foot were diagnostic of gouty tophi in several locations (green areas). |
 Figure 7.20 ▪ Dual-energy CT of tophaceous gout. A: Long-axis CT image of the right foot of a 71-year-old man (same patient as shown in Fig. 7.7A) shows a nonspecific low-attenuation mass in the region of the second toe. Long-axis (B) and sagittal (C) reformatted dual-energy color-coded CT images identify the mass as being a large tophus containing monosodium urate crystals (green area). In addition, several smaller tophi are identified at the site of Lisfranc joint and at the site of Achilles tendon attachment to the calcaneus. Three-dimensional reconstructed dual-energy CT color-coded images viewed from the plantar (D) and medial (E) aspects of the foot better demonstrate the spatial distribution of the urate tophi. |
production, such as xanthine oxidase inhibitors (allopurinol or febuxostat), and medications that improve removal of uric acid from the body (probenecid), are used to prevent complications of gout. Most recently, rheumatologists reported that urate-lowering therapy using pegloticase, a pegylated mammalian (porcine-like) recombinant uricase, resulted in reduction of the gouty tophus size both at subcutaneous sites and within the joints. However, ACP recommends that clinicians should discuss benefits, harms, costs, and individual preferences with patients before initiating urate-lowering therapy in patients with recurrent gout attacks. This includes the risk of Stevens-Johnson syndrome in patients receiving allopurinol.
 Figure 7.21 ▪ MRI and dual-energy CT of tophaceous gout. A: Lateral radiograph of the knee of a 65-year-old man, who presented with right knee pain, shows prepatellar soft tissue mass eroding the anterior cortex of the patella. Sagittal (B) and axial (C) proton density-weighted fat-suppressed MR images demonstrate heterogeneous mass adjacent to the patella and smaller mass eroding the lateral femoral condyle (arrow). Axial (D) and sagittal (E) dual-energy color-coded CT images are diagnostic for the presence of gouty tophi containing monosodium urate crystals (green areas). Three-dimensional reconstructed color-coded CT images viewed from the lateral (F) and frontal (G) aspects of the knee more accurately depict the gouty tophi. |
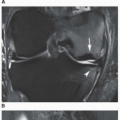
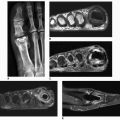
 Figure 7.22 ▪ MRI of gouty arthritis. Coronal proton density-weighted fat-suppressed (A) and sagittal T1-weighted fat-suppressed contrast-enhanced (B) MR images of the right knee of a 53-year-old man show multiple articular and paraarticular erosions associated with intraosseous as well as soft tissue tophi. C: Short-axis T1-weighted MRI of the foot in another patient with gouty arthritis demonstrates a low signal intensity tophaceous deposit in the dorsal aspect of the second metatarsal (arrow). D: Short axis T2-weighted MRI of the same patient shows the low signal intensity tophaceous deposit (arrow). E: Short axis postcontrast T1-weighted fat-saturated MRI demonstrates strong enhancement of the tophaceous deposit (arrow). |
Table 7.2 MOST COMMON CAUSES OF CHONDROCALCINOSIS | ||||||||||||||
|---|---|---|---|---|---|---|---|---|---|---|---|---|---|---|
|
Related posts:

Stay updated, free articles. Join our Telegram channel

Full access? Get Clinical Tree


