Hip dysplasia in the young adult population is a significant contributing factor in the development of early osteoarthritis. Diagnosis and treatment planning relies on a comprehensive imaging assessment of the hip joint morphology to better detect and characterize disease. This article discusses the various diagnostic markers of hip dysplasia in the adult population on radiography, computed tomography, and MR imaging.
Key points
- •
Hip dysplasia is a major risk factor for the development of early osteoarthritis in the young adult population.
- •
Knowledge of the several imaging markers of hip dysplasia in adults is important for diagnosis and treatment planning.
- •
Radiography and computed tomography are optimal to evaluate the osseous anatomy.
- •
MR imaging can be utilized to evaluate the osseous anatomy but is optimal to evaluate the soft tissue anatomy and pathology including labrum, cartilage, and ligament injuries.
- •
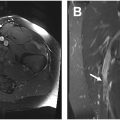
Assessment of labral tears in patients with hip dysplasia on MR imaging should discuss if there is disruption of the chondrolabral junction and capsulolabral recess and the presence or absence of labral displacement.
Introduction
Hip dysplasia is a major risk factor for the development of early osteoarthritis in the young adult population. Patients with hip dysplasia typically have a hypovolemic acetabulum with a steep acetabular roof and decreased weight-bearing area, which cause instability of the hip and increased shear stress on the acetabular rim with increased concentration of joint contact force. , These morphologic abnormalities predispose patients to labral disorders, premature hip joint cartilage degeneration, and subsequent osteoarthritis. , Historically, this has been diagnosed with 2 dimensional radiographic assessment of the acetabular coverage of the femoral head relying solely on radiographs. More recently, with the advancement of knowledge in the field utilizing diagnostic markers on cross-sectional imaging such as computed tomography (CT), MR imaging, and MR arthrography (MRA), the diagnosis and treatment planning has shifted toward a more comprehensive 2-dimensional radiographic and 3 dimensional (3D) cross-sectional assessment of the hip joint including acetabular, labral, and femoral morphology, to better detect and characterize disease. The treatment of symptomatic hip dysplasia is a combination of pain relief, functional improvement, and prevention of osteoarthritis. Knowledge of the various imaging findings indicating the presence and severity of hip dysplasia are very important in determining whether hip arthroscopy alone or in conjunction with reorienting osteotomy is necessary for treatment. We will discuss the various radiographic and cross-sectional CT and MR imaging diagnostic parameters of hip dysplasia in the adult population utilizing this comprehensive approach. It is important to note that many of the markers described in this discussion are listed in specific imaging modality sections corresponding to the modality with which the markers were first described; however, several of these markers can be utilized across radiography, CT, and MR imaging.
Radiographic markers of hip dysplasia
Lateral Center-edge Angle
The lateral center-edge angle (LCEA) is a commonly used diagnostic marker of hip dysplasia in adults, and it measures the superolateral acetabular coverage of the femoral head. It was originally described by Wiberg by measuring the angle between 2 lines on a well-centered anteroposterior (AP) pelvis radiograph. Both lines originate at the center of a best-fit circle of the femoral head, with one line extending vertically and perpendicular to the transverse axis of the pelvis and the other line extending obliquely to the lateral edge of the acetabulum. The angle formed between the vertical line and the line extending to the lateral margin of acetabulum is the LCEA, which if less than 20° is considered a diagnostic marker of hip dysplasia ( Fig. 1 ). LCEA values of 20° to 25° are considered borderline hip dysplasia (BHD) and thought to represent patients who are at the lower limits of normal in terms of coverage of the femoral head. Conversely, an LCEA value greater than 40° is indicative of overcoverage and pincer-type femoroacetabular impingement (FAI). The classic Wiberg measurement of the LCEA was later refined by Ogata and colleagues who more specifically described the line extending from the center of the femoral head to the lateral acetabular margin as a line that intersects the most superolateral point of the sclerotic weight-bearing zone of the acetabular roof referred to as the sourcil. More precisely, the sourcil is an area of physiologic subchondral sclerosis in the acetabular roof, which is a normal physiologic response by the articular portion of the ilium to the stresses provoked by the compressive forces of weight-bearing. The lateral margin of the sourcil on an AP pelvis radiograph can sometimes be located more medial than the lateral margin of the acetabulum described by Wiberg, especially in patients with acetabular retroversion and hip dysplasia. The Wiberg method has thus been found to overestimate acetabular coverage by an average of 4° because of inclusion of a bony region that functions as the labral base but is not part of the sourcil and thus does not come into contact with the femoral head, thereby not contributing directly to femoral head coverage. , The LCEA is primarily a radiographic measurement; however, the measurement has also been demonstrated on cross-sectional imaging including MR imaging and CT with good radiographic correlation. ,

Anterior Center-edge Angle
The anterior center-edge angle (ACEA), which is also referred to as the vertical-center-anterior margin angle, is used as a diagnostic marker of hip dysplasia specifically evaluating the anterior acetabular coverage of the femoral head, which is as important as lateral coverage in assessing hip instability. , The ACEA was first described by Lequesne on a false-profile (FP) hip radiograph as an angle formed between a vertical line through the center of the femoral head and a line extending from the center of the femoral head to the anterior margin of the acetabular roof ( Fig. 2 ). ACEA measurements between 20° and 40° represent normal anterior acetabular coverage. An ACEA measurement less than 20° is considered diagnostic of hip dysplasia due to deficient anterior acetabular coverage. Conversely, an ACEA greater than 40° is indicative of anterior acetabular overcoverage and pincer-type FAI. The FP radiograph is obtained with the patient in a standing position with the pelvis rotated 65° relative to the film, which can be challenging to obtain accurately. An additional limitation of this measurement on the FP radiograph is that for hip joints with deficient lateral coverage, the anterior edge of the acetabulum on FP radiographs will be very blurred. The ACEA measurement has also been described on CT, which showed no correlation between ACEA measurements on FP radiographs and CT. Furthermore, the reproducibility of ACEA on CT is more consistent than that of ACEA on FP radiograph, which is attributed to the ACEA CT measurement being done on a single sagittal CT slice making the anterior edge of the acetabulum very distinct and readily measurable, while the ACEA FP is measured on radiography, which is a superimposition of many planar images leading to blurring of the anterior edge of the acetabulum. MR imaging measurements of ACEA have shown good correlation with CT measurements, which further supports the use of cross-sectional CT or MR imaging as a more accurate 3D assessment of ACEA than the FP radiograph.

Acetabular Index Angle
The acetabular index angle evaluates the inclination of the acetabular roof on an AP pelvis radiograph. It is also referred to as the Tonnis angle, sourcil angle, acetabular roof angle, and horizontal toit externe angle. It is the most commonly used measurement for acetabular inclination. The angle is measured by forming a horizontal line, which is parallel to the transverse pelvic axis starting at the medial edge of the sourcil and then drawing another line extending from the medial edge of the sourcil to the lateral edge of the sourcil ( Fig. 3 ). A normal acetabular index angle is between 0° and 10°. An angle greater than 10° indicates hip dysplasia and an angle less than 0° places the hip at an increased risk of pincer-type FAI. Use of the acetabular index angle with CT and MR imaging has been reported showing good reproducibility and good correlation with radiographs. ,

Flat Acetabular Roof
A normal acetabular roof or sourcil has a concave morphology that mirrors and is congruent with the convexity of the femoral head. In the setting of hip dysplasia, the acetabular roof can sometimes have a flattened morphology, which is incongruent with the femoral head and laterally directs the shear forces within the hip joint causing labral eversion, which in turn leads to compromise of the labrum suction seal and instability of the hip joint. Initially, this was referred to as a “short roof” ; however, this terminology was modified to a “flat roof” because most patients with hip dysplasia have a roof length that is short because of the low volume of the acetabulum, but in the majority of patients, the roof remains congruent with the femoral head. It is the flattened morphology with subsequent loss of congruity with the femoral head, which specifically characterizes this smaller subset of patients with hip dysplasia due to a flat acetabular roof. Thus, while many patients with hip dysplasia have an elevated acetabular index angle greater than 10°, there is a subset of patients that have hip dysplasia due to a flat roof that can present with a normal acetabular index angle. This highlights the importance of subjectively evaluating the acetabular morphology in addition to making quantitative measurements described throughout this discussion.
Upsloping Lateral Sourcil
Hip dysplasia due to an upsloping lateral sourcil (ULS) is defined as a caudal-to-cranial inclination of the middle to far lateral aspect of the acetabular sourcil with loss of the normal concavity of the acetabular roof at the far lateral aspect of the roof on an AP pelvis radiograph ( Fig. 4 ). A study by Wong and colleagues has shown that nearly 90% of patients with frank hip dysplasia were found to have a ULS, and 3 times as many patients with BHD were found to have ULS compared to those with normal acetabular coverage. CT can also be utilized to evaluate for ULS in patients with borderline or frank hip dysplasia. It is important to note that ULS can also be present in patients without hip dysplasia (LCEA >25°), thus one must measure the LCEA when ULS is detected in order to determine if there is dysplasia.

Sharp’s Angle
Sharp’s angle measurement is another less commonly used measurement of acetabular inclination performed on an AP pelvis radiograph. It differs from the previously described measurements of acetabular inclination, which focus on the sourcil morphology only in that it measures the total acetabular inclination by including the ischial teardrop component of the acetabular socket in addition to the sourcil. The angle is measured by forming a horizontal line that is parallel to the transverse pelvic axis starting at the distal point of the acetabular teardrop and then drawing another line extending from the distal point of the teardrop to the superolateral edge of the acetabulum. A Sharp’s angle 45° or greater is consistent with hip dysplasia. The literature also supports the use of this measurement on cross-sectional CT and MR imaging showing good correlation.
Acetabular Version
Acetabular version refers to the relationship of the anterior and posterior walls of the acetabulum and the resultant orientation of the acetabular socket, which can be quantified by measuring the distance or angle between the anterior and posterior walls of the acetabulum on radiography and CT. Excessive acetabular anteversion is associated with hip dysplasia and acetabular retroversion is associated with pincer type FAI. Several parameters have been proposed to evaluate acetabular version on AP pelvis radiograph including the transverse axis distance (TAD) and the neck axis distance (NAD), which are described in further detail in later discussion. It is important to note that the presence of pelvic tilt on the AP pelvis radiograph can significantly impact the acetabular version measurement accuracy. More specifically, an anterior pelvic tilt can reduce acetabular version, and a posterior pelvic tilt may falsely increase acetabular anteversion.
Transverse Axis Distance
The TAD was first described by Nitschke and colleagues. It is measured on an AP pelvis radiograph by forming a horizontal line (line T), which is parallel to the transverse pelvic axis and intersects the center of a best-fit circle drawn around the femoral head of the hip being measured. The distance between the anterior and posterior acetabular walls along line T is then measured, yielding the TAD measurement in millimeters ( Fig. 5 ). A TAD measurement greater than 17 mm is indicative of excessive acetabular anteversion.

Neck Axis Distance
The NAD, which is similar to the previously described TAD measurement, was also first described by Nitschke and colleagues. It is measured on an AP pelvis radiograph by forming a line (line N) along the axis of the femoral neck through the center of a best-fit circle of the femoral head. The distance between the points where the anterior and posterior acetabular walls intersect line N is then measured in millimeters as the NAD ( Fig. 6 ). A measurement of greater than 14 mm is considered to represent excessive anteversion.

Shenton Line
The Shenton line was originally described in 1902 by an English Radiologist named Edward Warren Hine Shenton. To this day, it remains a commonly used radiographic marker on AP pelvis radiograph that is made by drawing a curved line along the inferior border of the superior pubic ramus, which also corresponds to the superior border of the obturator foramen, and along the inferomedial border of the femoral neck. This line should normally be a smooth curve, and if there is a disruption in the curve, it can be an indicator of superolateral hip subluxation from hip dysplasia. It is important to note that there can be other causes of a disrupted Shenton line besides hip dysplasia, including a femoral neck fracture and excessive external rotation of the normal hip, thus one must be careful to consider the clinical scenario and look for other radiographic markers of hip dysplasia. A disrupted Shenton line is typically indicative of more severe forms of acetabular dysplasia with a superolateral hip center; however, a normal continuous line does not exclude hip instability.
Iliofemoral Line
The iliofemoral line (IFL) is a radiographic marker on AP pelvis radiograph that is made by drawing a curved line along the lateral aspect of the femoral neck concavity through the inner cortical lip of the ilium. The percent medialization of the IFL is utilized to assess for lateral subluxation of the femoral head relative to the ilium by measuring the horizontal distance from the IFL to the lateral femoral head margin and dividing by the femoral head diameter. A percent medialization of the IFL greater than 22% is indicative of frank hip dysplasia, while values of 15% to 22% are considered to represent BHD.
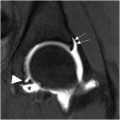
Femoral Head Extrusion Index
The femoral head extrusion index is performed on AP pelvis radiograph in order to calculate the percentage of the femoral head not covered by the acetabulum. This is done by measuring the width of the femoral head that lies lateral to the lateral margin of the acetabulum, which is considered uncovered (A), diving it by the total horizontal width of the femoral head (B), and multiplying by 100 [(A/B) × 100] ( Fig. 7 ). A femoral head extrusion index of 25% or greater is considered to represent undercoverage and potential hip dysplasia. It is important to note that the morphology of the sourcil is not accounted for in this measurement; thus, a normal index may be measured in a dysplastic hip due to incongruent sourcil morphology.

Lateralized Head Sign
In addition to undercoverage of the femoral head by the acetabulum, hip dysplasia presents with a lateral subluxation of the femoral head, which can be measured on an AP pelvis radiograph with the lateralized head sign (LHS). The LHS measures the distance between the medial aspect of the femoral head and the ilioischial line. If the distance is greater than 10 mm, it is considered lateralized and indicative of hip dysplasia. The LHS has been shown to demonstrate poor interobserver variability, and it has been suggested that the ilioischial line is an inappropriate reference line because the position of the line relative to the femoral head can be affected by the acetabular anteversion and pelvic morphology. A modified version of the LHS was recommended by Tachibana and colleagues, which measures the distance between the femoral head and the floor of the acetabular fossa. It was demonstrated in this study that the floor of the acetabular fossa is superior to the ilioischial line as the reference line for LHS in terms of sensitivity and specificity in diagnosing lateral femoral head subluxation. Furthermore, the modified LHS showed excellent reproducibility and diagnostic accuracy. They defined a positive modified LHS if it is 12 mm or greater in men and 10 mm or greater in women.
Cliff Sign
The cliff sign was first introduced by Packer and colleagues, which is assessed by drawing a perfect circle around the femoral head on an AP pelvis radiograph, and if the femoral head does not completely fill the perfect circle, it is considered a positive cliff sign. It has been demonstrated that a positive cliff sign is associated with microinstability of the hip joint defined intraoperatively as requiring minimal traction to distract the hip, or lack of reduction after the release of negative intra-articular pressure, or straight anterior or straight lateral labral tears. It is important to note that a positive cliff sign can be seen in patients without microinstability. Furthermore, microinstability of the hip can be secondary to factors other than hip dysplasia, including connective tissue disorders, microtrauma, and iatrogenic and idiopathic causes; therefore, the diagnosis of hip dysplasia based solely on this sign is not recommended.
Femoroepiphyseal Acetabular Roof Index
The femoroepiphyseal acetabular roof (FEAR) index was first introduced by Wyatt and colleagues as a radiographic marker specifically used to assess for hip instability in patients with BHD. FEAR is measured on an AP pelvis radiograph as the angle between a straight line drawn along the central aspect of the femoral head physeal scar, and a second straight line from the medial to lateral aspect of the acetabular sourcil. If the FEAR index is less than 5° in a patient with BHD, it is likely to be a stable hip, and in such a situation, it is suggested that a patient’s hip pain might be due to other causes such as FAI, rather than instability.
Acetabular Quotient
The acetabular quotient, which is also referred to as the acetabular index of depth to width, is the ratio of the acetabular width measured as the distance between the lateral edge of acetabular roof to the most inferior point of the acetabulum at the ischial teardrop, to the acetabular depth, measured as the perpendicular distance from the midpoint of the width line to the acetabular dome on AP pelvis radiograph. The value of this ratio is then multiplied by 1000. An acetabular quotient less than 250 indicates an abnormally shallow acetabulum as is seen in hip dysplasia.
Femoral Neck-shaft Angle
The femoral neck-shaft angle (NSA) is measured on the AP pelvis radiograph as the angle formed between a line parallel to the femoral neck drawn along the center of the intramedullary canal of the femoral neck and second line parallel to the femoral shaft drawn along the center of the intramedullary canal of the femoral shaft. Normal NSA values are between 120° and 140°. An NSA greater than 140° is described as coxa valga, and NSA less than 120° is described as coxa vara. , This measurement is important in hip dysplasia because coxa valga, which is also associated with external femoral torsion (antetorsion), is found in higher frequency in patients with hip dysplasia. , In contrast, coxa vara is more frequently found in patients with FAI. , An important limitation of the NSA measurement is that both femurs have to be internally rotated, which is the normal position for an AP pelvis radiograph, and if it is not positioned appropriately, the NSA can be inaccurate.
Alpha Angle and Cam Deformity
The alpha angle is a radiographic measurement used to detect the presence of an abnormal convex osseous prominence of the femoral head and neck junction referred to as a cam deformity, which can be associated with FAI. On radiography, the recommended view for measuring the alpha angle is the 45° Dunn lateral view because it is the most sensitive in detecting a cam deformity of the anterolateral aspect of the femoral head and neck junction where cam deformities most commonly occur. The alpha angle is measured by first drawing a circle around the femoral head and then an angle between a line starting from the center of the circle down the femoral neck and another line starting from the center of the circle to the location where the femoral head–neck junction joins the circle. If the alpha angle is greater than 55°, it is indicative of a cam deformity. It is important to evaluate for cam deformity in patients with hip dysplasia because if a cam lesion is not surgically corrected during hip arthroscopy before periacetabular osteotomy correction for hip dysplasia, it can result in impingement and reduced range of motion postoperatively.
Fovea Alta
Fovea alta refers to a higher or more cranial position of the fovea capitis of the femoral head in patients with hip dysplasia compared to normal hips. It was first described on radiography by Nötzli and colleagues who hypothesized that this morphologic abnormality further reduces the already smaller loaded cartilage surface contributing to the development of osteoarthritis in hip dysplasia, and therefore, it should be considered in biomechanical models and in planning of corrective procedures. The presence of fovea alta can be determined by measuring the delta angle on AP pelvis or hip radiograph, which is the angle between a line drawn from the center of the femoral head to the superior aspect of the fovea capitis and another line drawn from the center of the femoral head to the medial aspect of the acetabular sourcil ( Fig. 8 ). A normal delta angle is greater than 10°, and a dysplastic hip with fovea alta has a delta angle of 10° or less. A negative delta angle can occur in patients with severe fovea alta when the superior edge of fovea capitis is lateral to the medial-most aspect of the sourcil. Beltran and colleagues later described the use of the delta angle measurement on MR imaging by using the same measuring technique on the coronal MR imaging slice in which both the acetabular sourcil and fovea capitis are best visualized. In this study, they found that the fovea alta measurement had a high specificity of 82.1% as an indicator of hip dysplasia and the mean delta angle in frankly dysplastic hips was 3.4° compared to 21.7° in normal hips. It is also important to note that no significant difference in mean delta angle was found when comparing BHD and normal hips; therefore, this marker is only useful in patients with frank hip dysplasia, which is generally defined as LCEA less than 20°.