Introduction
Myocardial perfusion single photon emission computed tomography (SPECT) is a nuclear medicine imaging technique that uses a radioactive perfusion tracer to detect ischemia. Myocardial SPECT can detect, localize, and quantify the degree of ischemic myocardium. The result of a myocardial perfusion SPECT is related to the prognostic outcome of cardiac events (ie, myocardial infarction and death). Therefore, myocardial perfusion SPECT is used to guide treatment in patients with stable angina and after acute coronary syndrome. Myocardial perfusion SPECT is a mature technique, one of the most commonly used cardiac imaging techniques, and part of the international guidelines for treatment of patients with ischemic heart disease.1-3 There are international guidelines on how to perform,4 how to report,5 and when to use6 myocardial perfusion SPECT. Myocardial positron emission tomography (PET) is a newer nuclear medicine imaging technique that has rapidly become routine in cancer patients. The use in cardiology is also increasing because PET has inherent advantages compared to SPECT (eg, better image resolution and the possibility for absolute quantification of blood flow). However, the limited availability of the technique and especially of the PET perfusion tracers and higher costs are influencing the choice of method, and SPECT has kept its role as the main workhorse for cardiac patients.
Pathophysiology
Myocardial ischemia is defined as a mismatch between the demand and supply of oxygen to the myocytes, and this is mainly dependent on an adequate myocardial perfusion in various physiologic conditions. The inotropic and chronotropic states determine the myocardial demand, and during physical exercise, the heart rate increases and the force of the myocardium increases to raise the stroke volume and the left ventricular systolic pressure. At normal conditions, the arterioles can dilate during exercise, and perfusion can thus increase from a resting value of 1 mL/min/g to 3 mL/min/g. The maximal vasodilatation of the coronary arteries is even larger; over 5 mL/min/g has been measured, for example, during reactive hyperemia7 or pharmacologic vasodilatation. Coronary artery disease (or ischemic heart disease) affects myocardial perfusion by coronary artery stenoses that increase the resistance of the larger coronary arteries, and thus, the flow is limited. The heart will compensate for this increased resistance by dilatation of the arterioles at rest, thereby preventing a flow decrease. However, this means that part of the flow vasodilator reserve that is supposed to be used at stress is already being used at rest. This explains why patients who have stress-induced ischemia commonly have normal perfusion at rest.
SPECT Technique
Myocardial perfusion is depicted at rest and exercise using an intravenous injection of a radioactive perfusion tracer in a peripheral vein. The most commonly used perfusion tracers are technetium 99m (99mTc)–labeled tetrofosmin (Myoview; GE Healthcare, Little Chalfont, United Kingdom) or sestamibi (Cardiolite; Bristol-Myers Squibb, New York, NY). The formerly most used tracer, thallium, is an elementary compound with similar physiologic properties as potassium and provides a good linear relationship between blood flow and tracer uptake into the myocardium. The radiation dose is higher using thallium, and the image quality is not as good as that obtained with technetium-labeled tracers. The uptake of the perfusion tracer is related to the perfusion of the tissue, which means that only 3% of the injected radioactive material is distributed to the heart. Photons emitted from the radioactive decay (ie, gamma rays) are registered with a gamma camera. The resulting images are coded according to a gray or color scale from no perfusion (black) to maximum perfusion (white in the gray scale or bright colors in most of the color scales). A normal image is shown in Figure 3–1, and a yellow to white color denotes the highest tracer activity in the heart. Images are often displayed in a two-dimensional summary image of the heart called polar plot or “bull’s eye” (Fig. 3–2). A normal finding is an even bright color in all parts of the heart during exercise. When one part of the myocardium shows decreased tracer uptake during stress, a perfusion defect, the images are compared against the images obtained at rest. A perfusion defect that is larger at exercise than at rest is interpreted as ischemia (Fig. 3–3A,B). A perfusion defect that does not change between exercise and rest is considered to represent infarcted myocardium but can also be linked with other causes such as hibernating myocardium (Fig. 3–4).
Figure 3–1.
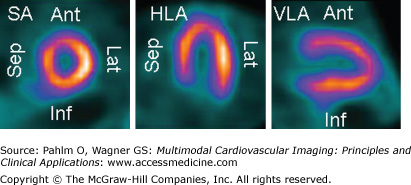
A normal myocardial perfusion SPECT with an evenly distributed perfusion. The three projections used for visualizing perfusion on myocardial SPECT are shown. The short axis (SA) images are by convention positioned with the inferior (Inf) wall downward, the septum (Sep) to the left, the anterior (Ant) wall upward, and the lateral (Lat) wall to the right. The horizontal long axis (HLA) images are presented with the apex upward, the septum to the left, and the lateral wall to the right. The vertical long axis (VLA) images are presented with the apex toward the right, the anterior wall upward, and the inferior wall downward. Isotope uptake is color coded from black (zero uptake) to yellow-white (100% of maximum uptake within the heart).
Figure 3–2.

The perfusion images are routinely presented in a two-dimensional (2D) or three-dimensional (3D) parametric image (polar plot or bull’s-eye image). In the 2D image, the entire left ventricle is represented in a circle, where the apex is located in the center and the base of the ventricle is located in the periphery. By convention, the anterior wall is placed upward, the inferior wall downward, the septal wall to the left, and the lateral wall to the right. The muscular perfused part of the septum is shorter than the lateral wall because of the membranous septum, and therefore, there is a peripheral rim of low perfusion tracer uptake to the left in the 2D image. To the right is shown a 3D parametric image of the left ventricle. This image can be freely rotated on the workstation
Figure 3–3.
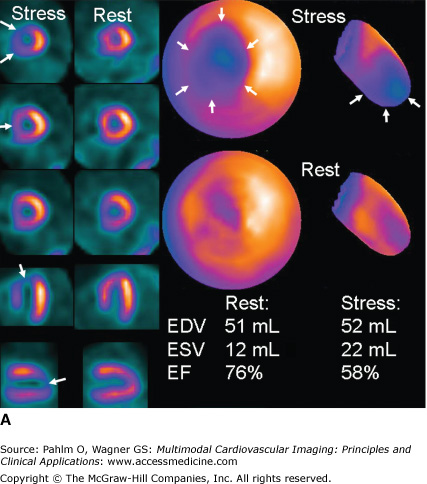

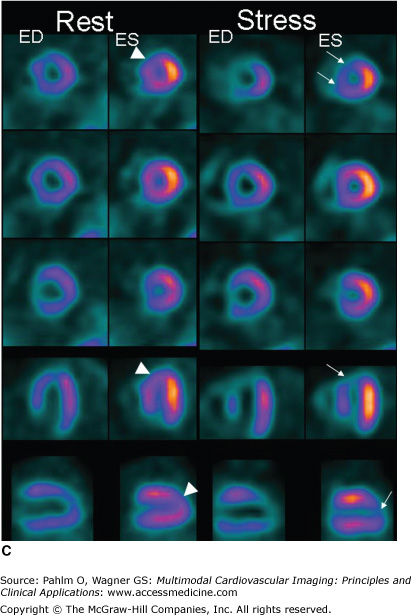
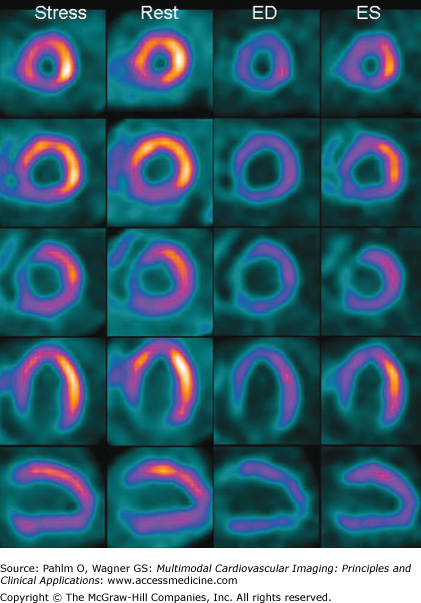
A. A 66-year-old woman with abdominal pain and no medication or previous history of ischemic heart disease. The exercise test induces abdominal pain and an equivocal ST-segment reaction; therefore, a perfusion single photon emission computed tomography (SPECT) is performed. A mild perfusion decrease in the anteroseptal region is seen at rest, and a severe perfusion defect in the anteroseptal region and apex is seen at stress. Hence, stress-induced ischemia is seen in the left anterior descending (LAD) territory, probably a proximal stenosis after a first diagonal. The reduced activity at rest could be due to breast attenuation. However, at gated SPECT, a mild regional dysfunction is seen in this area, and therefore, resting ischemia or a previous infarction is more likely. The patient was put on medication and referred for coronary angiography because the perfusion defect is large (almost 25% of the left ventricle) and severe because it causes transient ischemic dilatation and postischemic stunning (see Fig. 3–3C). A severe stenosis of the LAD was found and treated with percutaneous coronary intervention. EDV, end-diastolic volume; EF, ejection fraction; ESV, end-systolic volume. B. All perfusion images of the 66-year-old patient displayed in short axis, vertical long axis, and horizontal long axis views. By convention, stress images are placed above rest images. C. Gated SPECT at stress and rest. The frames at end-diastole (ED) and end-systole (ES) are shown. Automatic contour detection yields the end-diastolic and end-systolic volumes, and the ejection fraction can be derived from these volumes. Global function can be visually determined by looking at the endocardial contours at ED and ES. Regional function can be assessed by the increase in counts from ED to ES. Normal regional function is seen as an increase in counts from ED to ES as in the rest images of this patient except in a small area in the apex (arrowheads). At stress, a lack of count increase can be seen in the apex and anteroapical regions (arrows), which implies a decreased regional function in this area.
Figure 3–4.

A 75-year-old man with a previous myocardial infarction and shortness of breath. A large perfusion defect is seen at stress in the apex, inferior wall, and parts of the lateral wall. The perfusion defect is unchanged at rest. The left ventricular volumes are severely increased (end-diastolic volume = 430 mL; end-systolic volume = 350 mL), and the global function is severely depressed (ejection fraction = 17%). Gated single photon emission computed tomography images at end-diastole (ED) and end-systole (ES) in the horizontal long axis (HLA) and vertical long axis (VLA) projections are shown at bottom right. There are no signs of inducible ischemia. The infarcted territory is in more than one vessel. The vessels could be a distal LAD with a large wrap around to the inferior wall, alternatively a dominant right coronary artery supplying the inferior wall and apex. The basal lateral perfusion defect, which is not adjacent with the inferior and apical infarct is probably caused by infarction in the circumflex territory.
Uptake of the perfusion tracer to the tissues is related to the perfusion also in extracardiac tissues (eg, skeletal muscle and the gastrointestinal tract). This means that an injection at rest will have higher uptake to the gastrointestinal tract compared with an injection at physical exercise because of the higher blood flow to the gastrointestinal tract at rest. During exercise with high sympathetic activity, blood flow is lowered in the gastrointestinal tract and elevated in skeletal muscles. This will affect the image acquisition because the liver and intestines are close to the heart and the extracardiac tracer uptake in the image field of view can be much higher than the uptake of the heart. High extracardiac tracer uptake close to the heart, as a rule of thumb within the width of the heart wall, may necessitate renewed image acquisition. Therefore, before image acquisition, it is recommended to wait for more than 30 minutes after resting injection or injection during pharmacologic stress. In the waiting period, patients are recommended to take a walk in the corridors and eat or drink something to increase the gastrointestinal motility so that the tracer uptake moves away from the heart. After an exercise stress test, images can be acquired 15 minutes after injection.
Electrocardiogram (ECG) triggering or “gating” is routinely used during the gamma camera acquisition, and the acquisition is called gated SPECT. The recorded data are placed into 8 to 16 bins or gates depending on the time after the R wave of the ECG. Gated SPECT enables studies of global and regional ventricular function. Endocardial contours are automatically generated and provide the left ventricular volumes over the cardiac cycle. By calculation of the end-diastolic volume and end-systolic volume, the ejection fraction can be derived (Fig. 3–3C). Left ventricular function is visualized by displaying the images in a cine loop. The information from gated SPECT has been shown to have incremental prognostic value compared with assessment of perfusion only.8 PET images are often ECG gated in the same manner to obtain functional information.
A perfusion defect that is unchanged between rest and stress can be due to infarction but also due to attenuation artifact, and gated SPECT can be used to differentiate these two (Moving Image 3–1). A myocardial infarct is characterized by reduction in perfusion tracer uptake and decreased regional function (Moving Image 3–2). If normal regional function is seen at gated SPECT in the area of reduced uptake, it is read as an attenuation artifact, and not as an infarct. Decreased ejection fraction and increased left ventricular volumes without any perfusion defects are seen in cases of cardiomyopathy (Fig. 3–5).
Gated SPECT images from the patient in Figure 3-6A.
Play Video
Decreased perfusion and regional function in the basal part of the inferior and inferolateral wall with no difference between stress and rest.
Play Video
Figure 3–5.
Gated single photon emission computed tomography (SPECT) of a 44-year-old male intravenous drug addict with a previous episode of sepsis. After antibiotic treatment, a decreased ejection fraction (EF) remains. Myocardial SPECT is performed to assess whether ischemic heart disease is the explanation for the heart failure. No perfusion defects are seen at stress or rest. At gated SPECT, increased left ventricular volumes (end-diastolic volume = 244 mL; end-systolic volume = 167 mL) and decreased EF (31%) were found. The findings of no stress-induced ischemia, no perfusion defects, increased ventricular volumes, and decreased EF are signs of nonischemic cardiomyopathy. ED, end-diastole; ES, end-systole.
The summed images from gated SPECT are used for assessment of perfusion, and therefore no extra scanning is needed; perfusion and function images are obtained simultaneously. Gated SPECT uses information from many heart beats, and if the heart rhythm is not stable (eg, sinus arrhythmia, premature beats, or atrial fibrillation), gated SPECT cannot be performed. One should bear in mind that the perfusion images display the perfusion as it was at the time of injection. The gated SPECT functional images, however, show function at the time of acquisition. This explains why a perfusion defect representing ischemia can be seen with preserved function at gated SPECT. During the time from injection to scanning, function can be restored. A stress perfusion defect with decreased function compared with the resting images is indicative of postischemic myocardial stunning (Moving Image 3–3). Lower ejection fraction and larger volumes after stress compared with rest are signs of severe ischemia. The increased ventricular volumes caused by postischemic stunning can also be seen on the summed perfusion images as transient ischemic dilatation (TID). TID manifests as a larger blood pool at stress compared with rest; in the images, this is manifested as more of the dark lumen at stress compared with rest (see Fig. 3–3A,B).
Decreased perfusion in the apex at rest that increases to a severe and large perfusion defect at stress.
Play Video
Recent developments have introduced ultrafast cardiac SPECT cameras with acquisition times down to a few minutes and increased spatial resolution.9,10 This development also provides the possibility to lower the injected radioactive dose to the patient, resulting in effective doses of only a few millisieverts. This has been made possible by new detector technology composed of cadmium-zinc telluride crystals with higher sensitivity, digital detectors instead of photomultiplier tubes, and improved collimator techniques that enable the acquisition of the entire three-dimensional volume continuously without moving the detectors in the conventional half-circle around the patient. The reconstruction algorithms for myocardial perfusion SPECT have also been refined, shortening the acquisition times by 30%. The cost of the new detector technology is roughly double the price for a conventional dedicated cardiac SPECT Anger gamma camera.
Radiation from different parts of the myocardium travels different distances through tissue with varying densities on the way to the gamma camera detector. If there is tissue of high density between the myocardium and the detector, some photons may not reach the detector. This is called attenuation of the signal and may mimic a perfusion defect.11 Because the body has the same constitution at both stress and rest images, the attenuation will be the same and a similar decrease in counts will be seen at stress and rest. Attenuation causes a decrease in the specificity of the test. Gated SPECT, additional imaging in the prone position, or transmission attenuation correction11 can be used to overcome this problem (Fig. 3–6). Attenuation correction can be performed by acquiring additional information about the body composition and attenuation properties and then mathematically calculating what the signal would be in the case of no attenuation. Traditionally, transmission information (as opposed to the emission perfusion information from the patient) from radioactive rods orbiting the patient and detected by the gamma camera on the opposite side of the patient has been used. Today, hybrid systems with computed tomography (CT) are available, and the CT information can be used for attenuation correction.12 The transmitted x-rays give a map of the attenuation of the body. Indeed, attenuation is the basis for all x-ray–based technology, and Hounsfield units in CT are a measure of attenuation. CT can be used to create an attenuation map of the patient, which can correct for attenuation of the photons by the tissues of the body. The information from a low-dose CT scan is superior to that obtained from radioactive rods and is acquired more rapidly.
Figure 3–6.
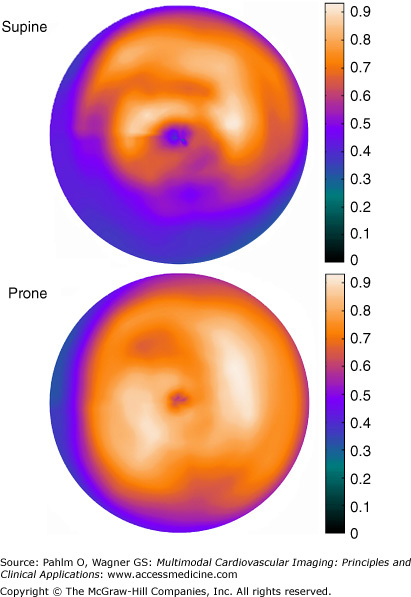
Supine and prone imaging in a man with chest pain at exercise and an equivocal stress test. Isotope is injected during peak stress, and SPECT images are acquired 15 minutes later in both the supine and prone positions. The supine perfusion image show a moderate reduction in the inferior wall, but the prone image shows an even isotope distribution, indicating attenuation of the radioactive signal. This simple form of attenuation correction can be used without any additional technical devices. Gated SPECT showed normal left ventricular volumes and ejection fraction. See Moving Image 3-1 for the gated SPECT images of this patient. Because of the normal perfusion and function, no resting injection is needed. This approach shortens the examination and lowers the radioactive exposure to the patient. In many nuclear cardiology services, between 25% and 50% of patients’ stress images suffice for exclusion of stress-induced ischemia.
A simple and inexpensive method to help in identifying attenuation effects without these technical options is to repeat the image acquisition in the prone position. A defect that is present in one position but moves or disappears in the other image acquisition is not caused by an infarct13,14 (see Fig. 3–6). Prone imaging has therefore been called the “poor man’s attenuation correction.”
PET Technique
PET has technical advantages over SPECT; the spatial resolution is higher, the acquisition is faster, the motion artifacts are less of a problem, attenuation correction is routine, and absolute quantification of perfusion is possible.15 There are several methodologic differences between SPECT and PET. PET scanners have a different geometry and a different detection principle. Multiple correction algorithms are routinely applied to yield images of absolutely quantitative tracer distribution of the target.
PET scanning aims to produce a three-dimensional image volume, which is an accurate map of the distribution of tracer in the body. To enable quantification, a series of such volumes is normally generated over time to describe the time-activity curves and investigate the kinetics of tracer uptake in different tissues and blood. The isotopes used in PET emit positrons, which are the antimatter of electrons. The positron is annihilated when colliding with an electron, whereupon two photons are emitted (annihilation radiation) and can be detected by the PET camera. The half-lives of the radioactive PET isotopes are much shorter than those of technetium or thallium used in SPECT (eg, 76 seconds for rubidium 82 [82Rb] and 10 minutes for nitrogen-13 ammonia [13NH3]). In addition, compared with radionuclides emitting single gamma-ray photons, the emission of pairs of 511-keV photons gives PET imaging higher detection efficiency, better uniformity of spatial resolution, and easier correction for attenuation. Gated images for assessment of regional and global function are acquired in the same manner as with SPECT (see previous section on SPECT).
In PET, the photon attenuation correction is routinely used in a robust manner. To exploit the potential of PET to provide quantitative data, a number of other corrections need to be carried out. The geometry of a PET system introduces variation in the detection sensitivity. Normalization corrects this by measuring the count rate for each line of response using a radioactive source. The response time of a detector system is finite. Dead time is the period when a detector is unable to record a new event, and this needs to be corrected also. In addition, to achieve quantitative results, scattered events, random coincidences, and partial volume effects in small targets need to be corrected; these correction methods use mathematical modeling. Furthermore, motion correction is needed when a moving target such as the heart is imaged. Luckily, most of these corrections are performed by the scanners automatically. Partial volume correction for cardiac studies is commonly done after data modeling, and for motion correction, ECG and/or respiratory gating is available.
The Stress Test
An exercise stress test is recommended as the method of choice when performing myocardial perfusion SPECT, and the perfusion tracer is injected during maximum cardiac exertion. To avoid injecting the perfusion tracer at submaximum exertion and thereby risking a false-negative test, injection should be done when the heart rate is above 85% of the age-predicted maximum. This can be calculated by the following formula: (220 – age) × 0.85. After injection, the patient should continue exercise for 1 minute to make certain that the perfusion tracer has entered the cells and left the blood pool. The workload can be lowered somewhat to enable the patient to continue exercise for 1 whole minute. Contraindications for an exercise stress test and criteria for termination of the test before reaching the age-predicted heart rate are the same as for a standard exercise stress test according to the international recommendations.16 Contraindications include any acute or ongoing severe cardiopulmonary disease, such as acute coronary syndrome, aortic dissection, cardiac failure or complex arrhythmias with hemodynamic instability, pulmonary embolism, severe hypertension (blood pressure >200/110 mm Hg), and severe aortic stenosis. Absolute indications for early termination of the exercise test include significant decrease in blood pressure, severe angina, sustained ventricular tachycardia, pathologic ST-segment elevation (>1 mm in leads with no Q waves other than V1 or aVR), increasing nervous system symptoms, or signs of poor perfusion. If there are technical difficulties affecting the ability to record ECG and blood pressure, the test should be terminated, and the problems should be fixed before continuing. Relative contraindications include marked ST-segment depression (>3 mm), arrhythmias such as triplets of premature ventricular contractions or supraventricular tachycardia, development of left bundle branch block, and severe hypertension (>250/130 mm Hg).
Pharmacologic stress with adenosine, dipyridamole, regadenoson, or dobutamine can be used to cause coronary vasodilatation in patients who cannot perform a maximum exercise stress test, including patients with orthopedic problems and patients who cannot reach adequate heart rate because of β-blockers or a concomitant disease such as chronic obstructive pulmonary disease or kidney failure. A vasodilator drug is also used in patients with left bundle branch block or a pacemaker with ventricular stimulation because of potential false-positive perfusion images when using the exercise stress test (see “Pitfalls” later). Pharmacologic stress is used most commonly with PET imaging. Direct vasodilatation is caused by adenosine, dipyridamole, and regadenoson. Dobutamine is a sympathomimetic drug with positive inotropic and chronotropic properties that causes a secondary vasodilatation. Pharmacologic stress testing is safe under correct monitoring and patient supervision. ECG, blood pressure, and patient status should be assessed and supervised by a physician, and cessation of the drug and use of antidotes may be necessary.
Adenosine is the most commonly used pharmacologic stress agent and acts as a direct vasodilator on the coronary vessels by binding to the A2A receptor on the arterioles. Adenosine is given as a continuous infusion in a peripheral vein for 5 to 6 minutes. The half-life of adenosine is very short (<10 seconds), and therefore, no antidote is needed. After cessation of the infusion, the effect stops. Adenosine is given at a dose of 140 μg/kg/min, but the dose can be lowered if adverse effects occur. Common adverse effects to adenosine are flushing, headache, chest discomfort, and dyspnea. These adverse effects are unspecific and not related to ischemia; therefore, patients are informed of their benign nature, and most patients can tolerate them. Criteria for early termination of adenosine infusion are persistent high-grade atrioventricular (AV) block or sinoatrial block, severe hypotension, bronchoconstriction, and severe angina. Adenosine causes AV block in high doses, and especially in older patients, transient AV block is seen. Lowering the adenosine dose is often sufficient to avoid high-grade AV block. Blood pressure drops in many patients because of the vasodilatation, but there is rarely a need to stop the infusion. A profound decrease of blood pressure is related to a worse patient status and ischemia, and in some patients, adenosine infusion has to be terminated. Healthy subjects given adenosine do not experience a drop in blood pressure but do experience an increase in the heart rate and stroke volume to maintain the blood pressure. Bronchoconstriction is a rare but potentially severe adverse effect of adenosine and is the reason for the contraindication of adenosine in patients with active asthma or severe chronic obstructive pulmonary disease. In patients with mild chronic obstructive pulmonary disease, premedication with inhalation of β2 stimulants can be used. Auscultation of the lungs during adenosine infusion can be used to detect bronchoconstriction. Of note is that the dyspnea experienced by most patients is not related to bronchoconstriction. Dyspnea is believed to be caused by stimulation of the peripheral oxygen receptors in the carotid sinus. The safety of adenosine has been assessed in a large study of over 9000 patients; 0.1% of patients experienced bronchoconstrictions, although patients with asthma and severe chronic obstructive pulmonary disease were excluded from receiving adenosine. Two patients experienced severe complications with pulmonary edema and myocardial infarction, respectively. The combination of the adenosine infusion with physical exercise on a bicycle ergometer or treadmill decreases adverse effects. The increase in sympathetic activity during exercise increases blood pressure and decreases the risk of AV block and possibly bronchoconstriction. Furthermore, the blood supply to the gastrointestinal tract decreases and hence tracer uptake in that region, which is advantageous for the subsequent SPECT acquisition. In patients with left bundle branch block and pacemakers with ventricular stimulation, adenosine infusion should not be combined with physical exercise (see later section “Pitfalls“).
Dipyridamole acts via the endogenous adenosine of the body by inhibiting the reuptake of adenosine and thereby raising the concentration around the receptor. Because of its long half-life, an antidote is needed, and theophylline is most commonly used. Adverse effects to dipyridamole are similar to those of adenosine.
Regadenoson is a specific A2A receptor agonist recently made available with similar diagnostic results as adenosine.17 The effect of regadenoson is sustained, with a half-life of 2 to 3 minutes. Therefore, an antidote such as theophylline is often used. Because of its specific A2A receptor characteristics, regadenoson can be used in chronic obstructive pulmonary disease and asthma patients. Regadenoson was approved in the United States in 2008.
Dobutamine is a sympathomimetic drug with positive inotropic and chronotropic properties that causes secondary vasodilatation. The infusion rate is increased in steps, starting at 5 or 10 μg/kg/min and increasing every third minute to 20, 30, and 40 μg/kg/min. Blood pressure and ECG are monitored continuously, and criteria for termination of infusion and contraindications are the same as for an exercise stress test. Injection of the radioactive tracer is performed at 85% of the age-predicted heart rate, which often occurs only after adding atropine starting at a dose of 0.25 mg. It is important that β-blockers are discontinued before the test in order to reach the age-predicted heart rate. Common adverse effects of dobutamine are headache, nausea, anxiety, and atypical chest pain. Angina and ventricular arrhythmias need to be monitored, and paroxysmal atrial fibrillation can be triggered by dobutamine. If the termination criteria are followed, severe complications such as myocardial infarction and death are extremely rare. When discontinuing the infusion, the effect of dobutamine lasts longer compared with adenosine, and sometimes an intravenous injection of a β2-blocker is needed. There are additional contraindications for the use of atropine (eg, narrow-angle glaucoma).
Oral nitrates should be avoided before stress because of their anti-ischemic effect. If an exercise test or dobutamine infusion is used, β-blockers and heart rate–lowering calcium blockers should be discontinued 48 hours before the injection. A common indication for vasodilator perfusion imaging is inappropriate heart rate response in patients who cannot or who have forgotten to discontinue their medication. The amount of ischemia will be less if anti-ischemic medication is maintained even with vasodilator stress tests,4 however, with β-blockers, not to the extent that it affects the sensitivity and specificity.18 Caffeine needs to be discontinued before adenosine, dipyridamole, and regadenoson because of a competitive blockage of the adenosine receptor. Abstinence from caffeine is recommended for preferably 24 hours.
Radiopharmaceuticals
The characteristics of an ideal perfusion tracer would be uptake to the myocardium in direct proportion to blood flow; high extraction from blood to the myocardium during the first passage; medium half-life to enable time for acquisition but not so long that the radiation dose becomes high; radiation properties that suit the acquisition with regard to energy emission, resolution, and attenuation; and of course, a stable, cheap, and ready supply of the tracer. Unfortunately, there are no tracers today that meet all of these criteria, but three SPECT tracers fulfill several and are therefore used clinically. For PET imaging, three tracers are being used. The radiopharmaceuticals used are injected as a bolus injection in a peripheral vein.
In the case of thallium, the perfusion tracer and the radioactive substance are one and the same. Thallium 201 (201Tl) can be found in the same group as potassium in the periodic table and is distributed in the body as potassium in proportion to blood flow with a high extraction from the blood. The half-life is rather long, the radiation dose to the patient is high (~18 mSv), and the characteristics for SPECT acquisition are not ideal. After an injection during stress, imaging must be started within 10 minutes because of the so-called redistribution of thallium. Thallium does not stay fixed in the cell after uptake but reenters the blood stream and is continuously redistributed to the body. Therefore, a perfusion defect will disappear at rest because of uptake from thallium in the blood. This means that the same injected dose can be used for both stress and rest images, and the redistribution images at rest are performed 3 to 4 hours after injection. Thallium can also be used for viability testing in the case of a fixed perfusion defect. A late redistribution image the following day is used, and in the case of an infarct, the perfusion defect is still present. A fixed perfusion defect that disappears is an indication of viable myocardium.
99mTc is a radioactive substance and must be linked to a perfusion tracer (eg, tetrofosmin or sestamibi). 99mTc has good characteristics for SPECT acquisitions and a medium to long half-life of 6 hours. Both perfusion tracers have lower extraction compared with thallium but thereafter remain stable in the cells binding to the mitochondria. This means that injection does not have to be adjacent to the SPECT camera, and the patient can be transported to the acquisition without haste. It also means that a separate resting injection must be performed if the stress image is abnormal. Tetrofosmin and sestamibi have a rather high gastrointestinal uptake, which may cause problems with image acquisition at rest or after pharmacologic stress (see “Pitfalls” later).
All PET perfusion tracers allow for short imaging protocols and repeated studies due to their short half-lives. A PET perfusion study can thus be performed in a few minutes. Currently, three tracers are mainly used with PET.
Related posts:


Stay updated, free articles. Join our Telegram channel

Full access? Get Clinical Tree


