Neurocutaneous Syndromes
NEUROFIBROMATOSIS TYPE 1, ASTROCYTOMAS AND NEUROFIBROMAS
KEY FACTS
Autosomal dominant (chromosome 17) or sporadic (50%) disorder, ten times more common than NF-2; prominent cutaneous lesions, plexiform neurofibromas, and bilateral optic nerve gliomas (hallmarks of the disease) are noted.
Other intracranial abnormalities in NF-1 include hamartomas, dysplasia of greater wing of sphenoid leading to pulsatile exophthalmos, orbital globe enlargement, and neurofibromas arising from cranial nerves.
NF-1 is associated with tumors that arise from cells that form the brain, that is, glial cells and neurons (gliomas and hamartomas).
About 15% to 40% of patients with NF-1 have optic pathway gliomas, and most (>80%) are slow growing (some even regress) and some can be considered “hamartomas.” Chiasmatic and postchi-asmatic involvement is relatively rare.
About 10% of NF-1 patients have brain gliomas that involve mainly the brain stem and tectum (producing hydrocephalus); most are low-grade.
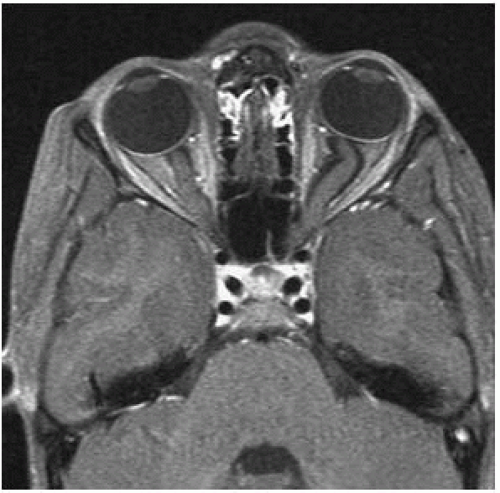 FIGURE 20-1. Axial postcontrast T1 shows enhancing large optic nerves. |
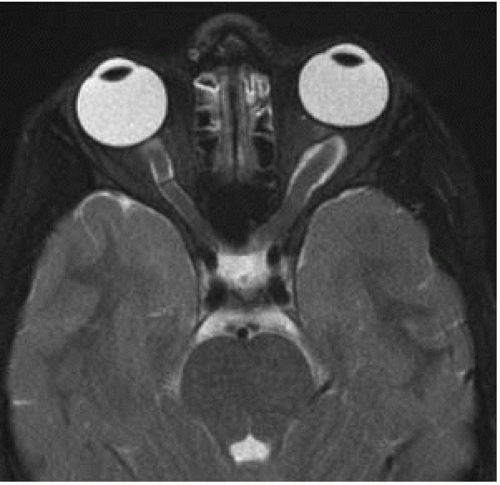 FIGURE 20-2. Corresponding axialT2 shows the optic nerve gliomas to be of low signal. |
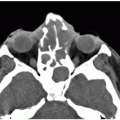
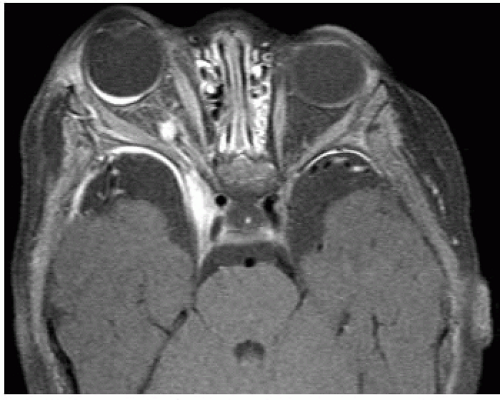 FIGURE 20-3. Axial fat-suppressed postcontrast T1, in a different patient, shows dysplasia of right greater sphenoid wing and enhancing plexiform neurofibroma in the right cavernous sinus and along the lateral orbit.The ipsilateral globe is large (buphthalmos) and the enhancing choroid is thick. |
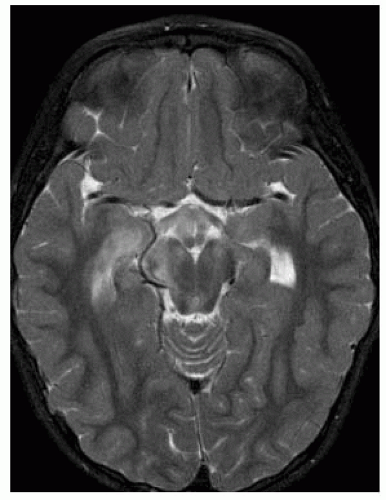 FIGURE 20-4. Axial T2, in a different patient, shows chiasm glioma extending posteriorly to the right optic radiation region. |
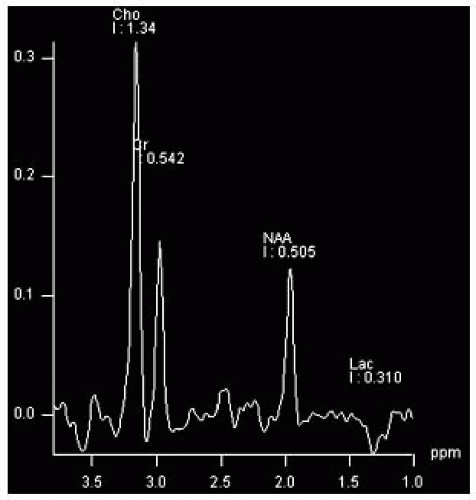 FIGURE 20-5. Magnetic resonance spectroscopy (MRS), long TE, obtained in the patient shown in 20-4, at level of optic radiation lesion shows typical pattern of tumor with elevated cho-line and low N-acetyl-aspartate (NAA) and a small lactate peak which sometimes may be seen in pilocytic astrocytomas. |
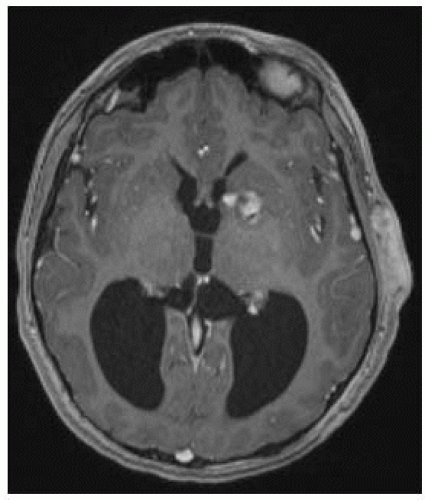 FIGURE 20-6. Axial postcontrast T1, in a different patient, shows an enhancing tumor in the left basal ganglia, hydrocephalus, and a plexiform neurofibroma in the left temporal subcutaneous tissues. |
SUGGESTED READING
Rodriguez D, Young Poussaint T. Neuroimaging findings in neurofibromatosis type 1 and 2. Neuroimaging Clin North America 2004;14:149-170.
NEUROFIBROMATOSIS TYPE 1, DYSPLASTIC MYELIN
KEY FACTS
These abnormalities were previously known as hamartomas or vacuolization; they are areas of high T2/fluid attenuated inversion recovery (FLAIR) signal and are composed of dysplastic neurons and microcysts and are found in nearly 80% of NF-1 patients.
Common sites for myelin vacuolization are the basal ganglia (at the globi pallidi where they tend to be larger and may be slightly T1 hyperintense), optic radiations, internal capsules, brain stem, and cerebellar and cerebral peduncles.
By magnetic resonance imaging (MRI) these abnormalities generally show no mass effect, do not enhance, and may grow slowly until the patient reaches 10 years of age, after which they usually begin to regress in size.
On MRI, most areas of dysplastic myelin are isointense or hyperintense on T1, while most astrocytomas are hypointense; on T2/FLAIR images, they are hyperintense, reflecting their spongiform nature.
Dysplastic myelin shows increased diffusion on apparent diffusion coefficient (ADC), which distinguishes them from tumors that show restricted diffusion.
MRS shows minimally elevated choline and mildly decreased NAA levels.
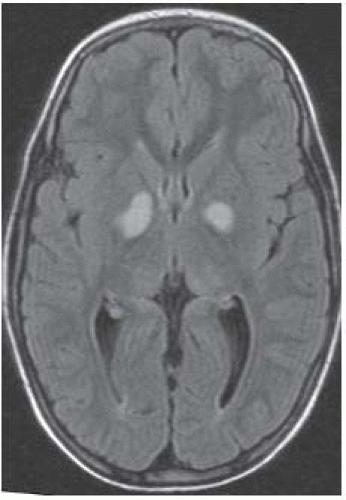 FIGURE 20-7. Axial FLAIR image shows presumed areas of dysplastic myelin in the globi pallidi. |
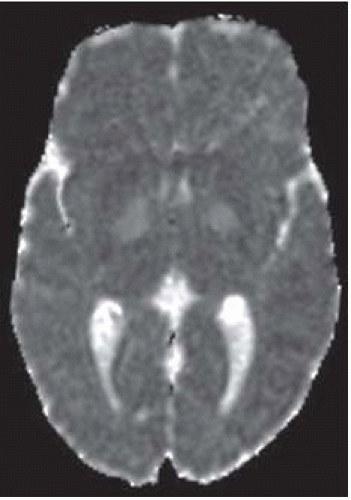 FIGURE 20-8. Corresponding ADC map shows no restriction of diffusion in lesions. |
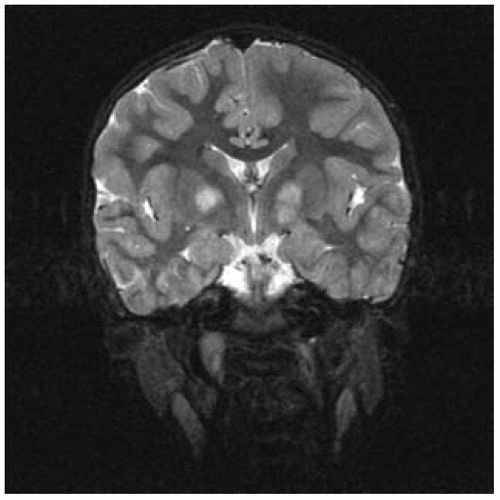 FIGURE 20-9. Coronal T2, in a different patient, shows bilateral basal ganglia areas of high signal |
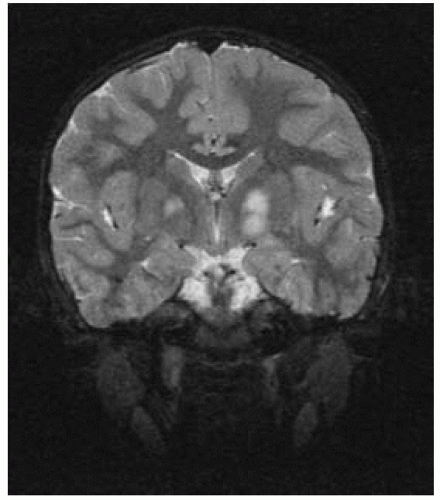 FIGURE 20-10. Corresponding coronalT2 2 years later shows that the right-sided abnormality has decreased in size. |
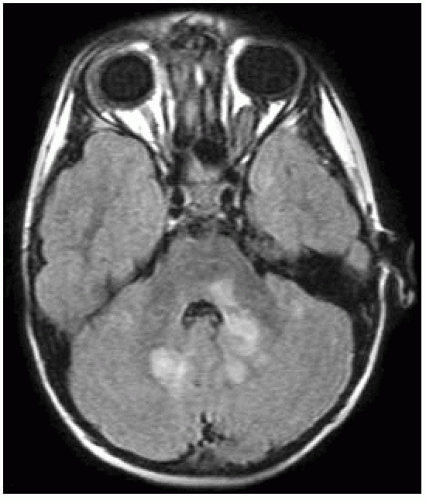 FIGURE 20-11. Axial FLAIR, in a different patient, shows areas of high signal in the medial cerebel-lum, left middle peduncle, and brain stem. |
SUGGESTED READING
DiMario FJ Jr, Ramsby G. Magnetic Resonance Imaging Lesion Analysis in Neurofibromatosis Type 1. Arch Neurol 1998;55:500-505.
NEUROFIBROMATOSIS TYPES 1 AND 2, SPINE ABNORMALITIES
KEY FACTS
Spinal abnormalities are present in >60% of NF-1 patients (mesenchymal more common than tumors); spinal abnormalities in NF-1 include neurofibromas and rare astrocytomas; those in NF-2 include schwannomas, meningiomas, and ependymomas.
Expansion of neuroforamina, widening of spinal canal, and scalloping of posterior aspect of vertebral bodies; these changes may be due to neurofibromas (10% to 20% of NF-1 patients) or more commonly to dural ectasia and arachnoid cysts.
Acute angle kyphoscoliosis is typical for NF-1 (scoliosis is more common in NF-1).
Lateral thoracic meningocele is characteristic of NF-1 (if incidentally discovered, a search for other stigmata of NF-1 is recommended).
Spinal cord lesions are gliomas (10% to 15% of NF-1 patients) or rarely hamartomas.
Spinal tumors are more common in NF-2 and they include
Spinal cord ependymomas, meningomas, and schwannomas.
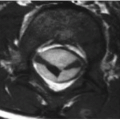
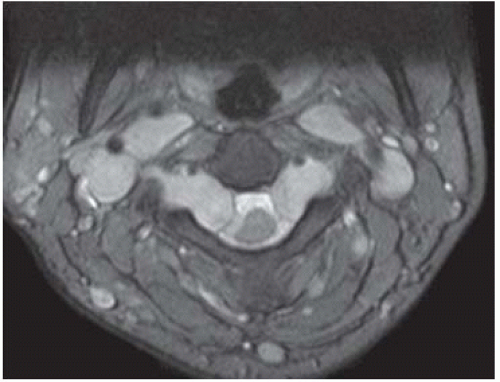 FIGURE 20-12. Axial T2 shows neurofibromas remodelling the neural foramina and along the carotid spaces. Note compression of spinal cord. |
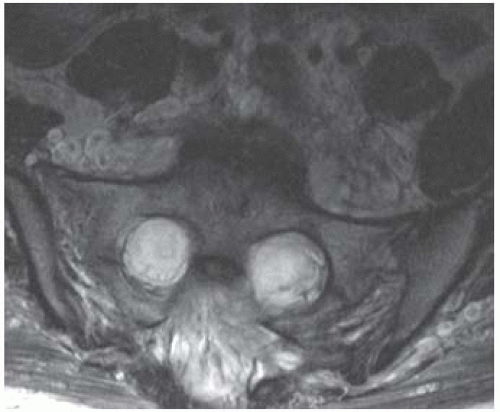 FIGURE 20-13. AxialT2, in a different patient also with NF-1, shows expansion of sacral foramina by neurofibromas. |
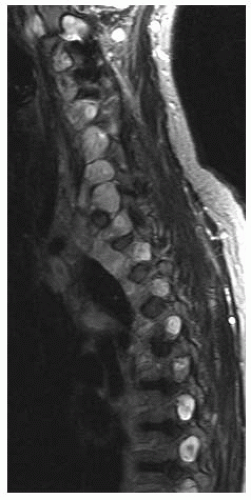 FIGURE 20-14. Parasagittal T2, in a different patient with NF-2, shows multiple schwannomas in neural foramina. |
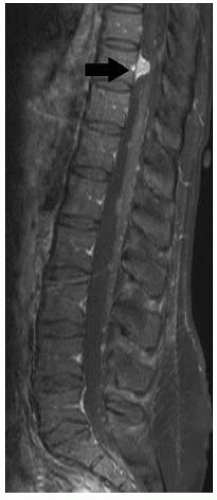 FIGURE 20-15. Midsagittal postcontrast T1, in a different patient with NF-2, shows multiple tiny schwannomas in cauda equina and nerve roots and a small meningioma (arrow). |
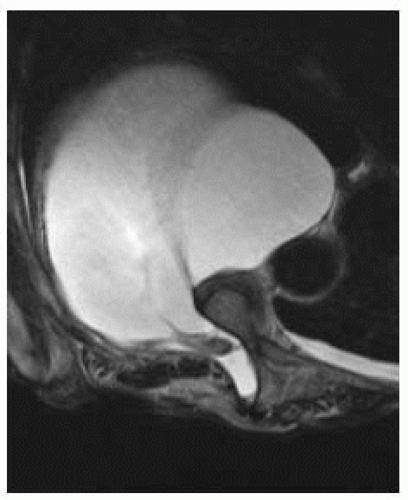 FIGURE 20-16. Axial T2, in a different patient with NF-1, shows a large lateral thoracic meningocele. |
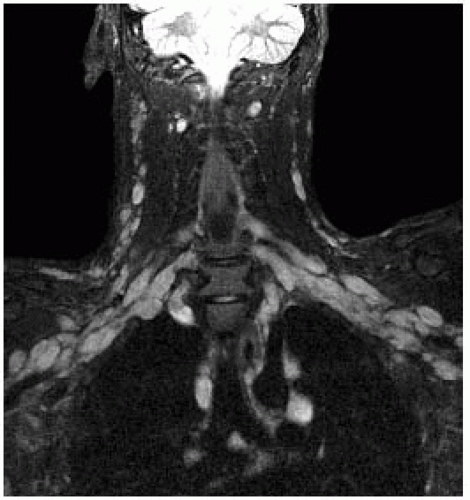 FIGURE 20-17. Coronal T2, in a different patient with NF-1, shows plexiform neurofibromata involving both brachial plexi. |
SUGGESTED READING
Patronas NJ, Courcoutsakis N, Bromley CM, Katzman GL, MacCollin M, Parry DM. Intramedullary and spinal canal tumors in patients with neurofibromatosis 2: MR imaging findings and correlation with genotype. Radiology 2001;218:434-442.
NEUROFIBROMATOSIS TYPE 2, SCHWANNOMAS AND MENINGIOMAS
KEY FACTS
Autosomal dominant (chromosome 22q12) disorder is 10 times < common than NF-1; cutaneous lesions are less common (<50%).
Presents in third to fourth decades of life; all patients develop CNS tumors.
Bilateral vestibular nerve schwannomas are the hallmark sign; the trigeminal is the second most commonly involved cranial nerve (a tumor arising in a purely motor cranial nerve should prompt a search for NF-2).
Brain lesions arise from the coverings of the brain, that is, Schwann, meningeal, and ependymal cells (schwannomas, meningiomas, and ependymomas respectively).
Meningiomas are usually multiple, may be plaque-like, and may occur in atypical locations.
Meningioma in a child should raise suspicion of NF-2.
Meningiomas in NF-2 patients present more commonly in the lateral ventricles than do sporadic meningiomas (16% vs. 5%).
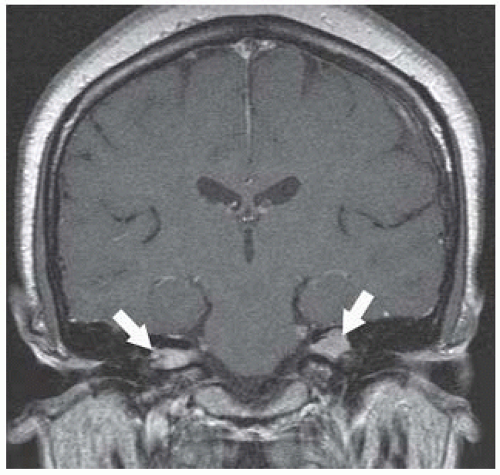 FIGURE 20-18. Coronal postcontrast T1 shows bilateral enhancing masses (arrows) in the internal auditory canals and in both trigeminal nerves. |
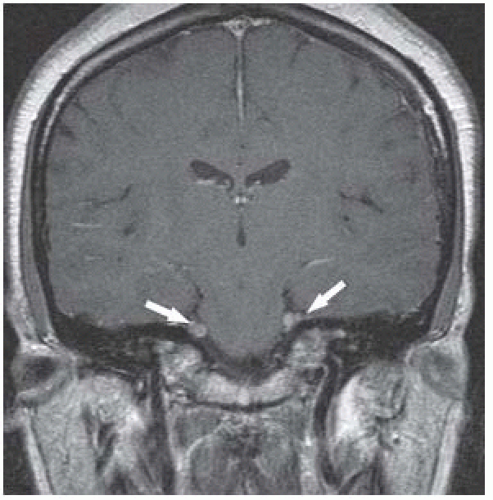 FIGURE 20-19. Coronal postcontrast T1, in the same patient, shows schwannomas (arrows) involving both trigeminal nerves. |
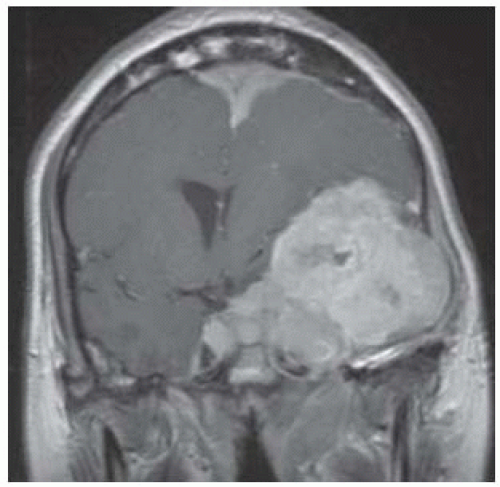 FIGURE 20-20. Coronal postcontrast T1, in a different patient, shows multiple intracranial meningiomas.
Related posts:Stay updated, free articles. Join our Telegram channel
Full access? Get Clinical Tree
 Get Clinical Tree app for offline access

|