The pituitary gland is a small endocrine organ located within the sella turcica. Various pathologic conditions affect the pituitary gland and produce endocrinologic and neurologic abnormalities. The most common lesion of the pituitary gland is the adenoma, a benign neoplasm. Dedicated MR imaging of the pituitary is radiologic study of choice for evaluating pituitary gland and central skull region. Computed tomography is complimentary and allows for identification of calcification and adjacent abnormalities of the osseous skull base. This review emphasizes basic anatomy, current imaging techniques, and highlights the spectrum of pathologic conditions that affect the pituitary gland and sellar region.
Key points
- •
MR imaging is the study of choice for evaluating primary tumors and other lesions of the pituitary gland and the central skull base region.
- •
CT is complimentary in evaluating pituitary and other sellar masses given its ability to detect calcification and assess osseous involvement of skull base.
- •
The adenoma is the most common lesion of the pituitary gland and can be symptomatic because of its endocrine effects or localized mass effect.
- •
Macroadenomas can have a variety of imaging appearances based on size, cystic/necrotic change, extent of local invasion, and post-treatment effects.
- •
There is a broad spectrum of disorders that should be considered in the radiologic evaluation of pituitary, sellar, and suprasellar masses.
Introduction
The pituitary gland is a small, complex endocrine organ located within the sella of the central skull base. It is anatomically and functionally separated into the anterior lobe (adenohypophysis) and the posterior lobe (neurohypophysis). The anterior lobe produces multiple hormones, including, prolactin, growth hormone (GH), adrenocorticotropic hormone (ACTH), thyroid-stimulating hormone (TSH), follicle-stimulating hormone, and luteinizing hormone. The posterior lobe is an anatomic extension of the hypothalamus and is the site for the secretion of oxytocin and vasopressin. Various pathologic conditions affect the pituitary gland and can produce endocrinologic and neurologic abnormalities. Common lesions include congenital lesions, developmental abnormalities, inflammatory conditions, and a variety of benign and malignant neoplasms. Dedicated MR imaging of the pituitary is the radiologic modality of choice for evaluating the pituitary gland, central skull base, and parasellar regions. Computed tomography (CT) is complementary and allows for identification of calcification and can evaluate osseous integrity of the central skull base. This review emphasizes basic anatomy, current imaging techniques, and highlights the spectrum of pathologic conditions that affect the pituitary gland and sellar region.
Anatomy
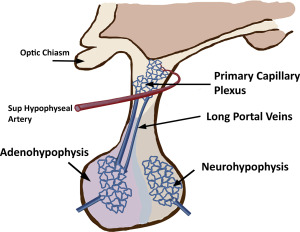
The pituitary gland is a small endocrine gland located in the sella turcica, a saddle-shaped depression in the central sphenoid bone. It is of critical importance to the body’s metabolism because it produces, stores, secretes, and regulates several important hormones. The pituitary gland has an anterior lobe (adenohypophysis) and posterior lobe (neurohypophysis). The adenohypophysis constitutes 75% of total pituitary volume and is mainly comprised of the pars distalis. Composed of cords of epithelial cells flanked by vascular sinusoids, the adenohypophysis is where most pituitary hormones are synthesized and stored (GH, prolactin, TSH, ACTH, follicle-stimulating hormone, and luteinizing hormone). The pars intermedia is an endocrinologically inactive narrow zone between the adenohypophysis and neurohypophysis and can contain some microscopic remnants of Rathke cleft ( Fig. 1 ).
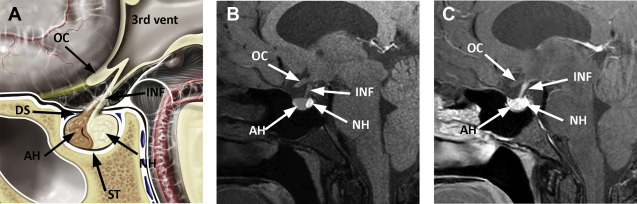
Derived from the neural ectoderm, the neurohypophysis extends from the hypothalamus to the sella. Composed of axons arising from hypothalamic neurons of the supraoptic and paraventricular nuclei, it forms the hypothalamohypophyseal tract. Its distal axonal terminals include neurosecretory granules that contain oxytocin or vasopressin. The presence of vasopressin is presumed to be responsible for the hyperintense signal identified on T1-weighted MR images, the so-called pituitary bright spot, a normal finding of the posterior lobe.
The infundibulum (pituitary stalk) is a linear structure extending from the hypothalamus to the pituitary gland. It is comprised of the anterior pars tuberalis and posterior pars infundibularis. The pars tuberalis is considered to be part of the adenohypophysis. It partially surrounds the pars infundibularis, which contains unmyelinated axons of the hypothalamic neurons that extend to the posterior lobe. The normal stalk has a thickness of approximately 2 mm and should be considered abnormal if it measures greater than or equal to 4 mm.
The size of pituitary gland is variable and depends on age and physiologic status. The pituitary size is roughly estimated by its height, and its height is routinely measured from coronal or sagittal MR images. Pituitary dimensions in selected age and gender groups are depicted in Table 1 . Note the gradual decrease in size of the pituitary gland in elderly patients.
| Age Group/Physiologic Status | Sex | Size (mm) |
|---|---|---|
| Prepubertal children | Either | 2–6 |
| Prepubertal children | Boys | 7–8 |
| Girls | 8–10 (round shape) | |
| Third trimester pregnancy | Women | 10 |
| First week postpartum | Women | 12 |
| Adult, aged ≥50 y | Men | 8 |
| Women | 8 |
A thin horizontally oriented dural sheet that stretches across the top of the sella, the diaphragma sellae, separates the sella from suprasellar space. The diaphragma sellae is mildly convex inferiorly and contains a variable-sized central opening or perforation that allows the passage of the pituitary stalk. The diaphragma sellae is attached to the clinoid processes and contiguous with the dural covering of the cavernous sinus roofs bilaterally.
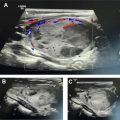
Blood supply to the anterior pituitary is unique and complex. The adenohypophysis lacks a direct blood supply and most of the blood reaches the parenchyma through the hypothalamic hypophyseal portal system. Small branches from superior hypophyseal artery enter the median eminence of the hypothalamus and form a primary capillary plexus. The primary plexus is connected to portal veins that extend through the infundibulum to the adenohypophysis. This portal venous system supplies most of the blood to the adenophyphysis and allows for precise hormonal regulation between the hypothalamus and the pars distalis ( Fig. 2 ). The posterior pituitary has direct blood supply from the inferior hypophyseal artery, which arises from internal carotid artery (ICA). The intrinsic pituitary capillaries are unique in that they are fenestrated and are outside of the blood-brain barrier. Therefore, the pituitary gland homogeneously enhances after administration of intravenous contrast agents.
Technique
Dedicated MR imaging of the pituitary gland and sella is the modality of choice for evaluating intrinsic lesions of the pituitary gland, such as adenomas and other lesions localized to the sella. Excellent spatial resolution and multiplanar technique allows for complete evaluation of the lesion and is necessary for treatment or surgical planning. Sagittal and coronal planes are preferred, typically using 2- to 3-mm slice thickness. Routine imaging with a 1.5-T magnet is generally satisfactory. However, the 3-T MR imaging magnet can offer an advantage of increased sensitivity for microadenomas and is recommended if there is strong clinical suspicion of an adenoma and an initial negative scan using 1.5 T. ,
A dedicated pituitary protocol includes precontrast sagittal and coronal T1-weighted images, followed by postgadolinium sequences in same plane. A T2-weighted coronal sequence with fat saturation also is beneficial. The normal adenohyphysis is isointense to brain on routine T1-weighted and T2-weighted images. The posterior pituitary generally contains the pituitary bright spot, if normal. The infundibulum and gland enhance homogeneously after contrast administration. Using such techniques, most adenomas and other sellar pathologies are diagnosed with a high degree of sensitivity. Depending on the circumstances and institutional preferences, optimal evaluation of the whole brain includes performance of axial fluid-attenuated inversion recovery, diffusion-weighted, and whole-brain postgadolinium sequences.
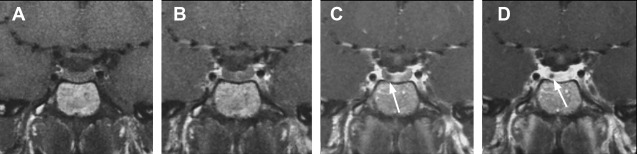
Dynamic MR imaging is a useful technique that is particularly beneficial for identifying microadenomas. Dynamic sequences take advantage of the fact that adenoma tissue enhances more slowly than normal pituitary tissue. If sequential images are obtained in rapid succession during the first-pass arterial phase, a microadenoma is identified as a small focus of nonenhancing tissue against a background of normally enhancing pituitary gland ( Fig. 3 ).
Optimization of dynamic sequence with 3-mm thin coronal slices, small field of view (12 × 12 cm), fine matrix size of 256 × 192, and use of spoiled gradient echo techniques instead of spin echo T1 is helpful. , Dynamic sequences should be acquired every 30 seconds for 3 minutes with five slices/acquisition. The pituitary shows rapid and progressive enhancement usually beginning superiorly and extending inferiorly through the entire gland. Delayed postcontrast images are then obtained in sagittal and coronal planes. On delayed sequences, small adenomas may be isointense to pituitary gland and difficult to see. As new sequences have been developed, some studies have questioned the routine role of dynamic imaging, arguing that other sequences, such as enhanced three-dimensional spoiled gradient echo, may be as sensitive or better.
Diffusion-weighted imaging is not routinely performed for pituitary lesions, but studies are under way to evaluate its utility for sellar and suprasellar lesions. It is challenging because of inhomogeneity at the skull base from air-bone interface from routine echoplanar diffusion imaging. Non–echoplanar diffusion imaging diffusion techniques, such as propeller diffusion-weighted imaging (General Electric, Boston, MA) or BLADE (Siemens, Munich, Germany), are used. Diffusion may help differentiate Rathke cleft cysts from other suprasellar/intrasellar lesions. Some authors suggest that pituitary apoplexy may be detected early using diffusion-weighted MR imaging. Pituitary adenomas with lower apparent diffusion coefficient values correlate with higher collagen content and may have surgical implications. However, perfusion and spectroscopy have limited roles in sellar imaging and are not routinely performed.
High-resolution CT scanning is complementary and may be used primarily if MR imaging is contraindicated. CT allows for identification of any intrinsic calcification/ossification of the lesion, can help in narrowing the differential, and is excellent for evaluating the osseous integrity of the central skull base. CT can be performed with 1-mm axial thin slices with contrast for best spatial resolution. Coronal and sagittal reformats should be obtained. , , , , CT angiography is also complementary, especially in cases where a parasellar vascular lesion, such as aneurysm, is considered.
Adenoma
The benign adenoma represents the most common pituitary neoplasm and arises from the adenohypophysis. These are benign epithelial lesions and account for about 10% to 15% of all intracranial tumors. Pituitary adenomas occur across a wide age spectrum, from childhood to the elderly. It has been estimated from postmortem and other clinical studies that pituitary adenomas occur in approximately 20% of the normal population, but many are incidental and asymptomatic. Adenomas are most often classified according to hormonal production and size, which predominantly determines the clinical presentation. They can also be classified based on histology and biologic behavior.
Adenomas that are hormone-producing are said to be endocrinologically active or functional, whereas nonfunctional tumors produce no measurable hormone. Prolactinomas are the most common hormone-secreting tumors and account for about 30% of all pituitary adenomas. Nonfunctioning adenomas are the second most common tumors, comprising 25% to 30% of pituitary adenomas.
Microadenoma
Adenomas are unencapsulated tumors, and as they begin to grow they initially infiltrate the parenchyma of pituitary gland itself. Lesions measuring less than 1 cm in size are called microadenomas. These lesions are generally confined to the pituitary gland/sella. In this case, symptoms are not related to the size of the lesions but rather the possible excess production of hormone.
On T1- and T2-weighted images, microadenomas may be isointense to normal pituitary gland. Microadenomas enhance variably with contrast but generally enhance at a slower rate than normal pituitary tissue. Dynamic enhanced images are performed to take advantage of this early differential enhancement and are generally considered to be the most sensitive sequence for microadenoma detection. Using high-resolution techniques, MR imaging can detect adenomas as small as 2 mm. Some institutions perform dynamic imaging routinely as part of pituitary protocol when adenoma is suspected. Others reserve dynamic sequences for cases where adenomas are suspected but conventional imaging is negative, especially in cases of suspected ACTH-secreting tumors, which are typically small, averaging 5 mm in diameter.
Macroadenoma
Macroadenomas are adenomas measuring greater than or equal to 1.0 cm. On unenhanced CT, macroadenomas generally demonstrate a soft tissue mass in the sella that is isodense with gray matter and not clearly discrete from the gland itself. Lesions may show variable attenuation because of cyst formation or necrosis. Occasionally, hemorrhage results in hyperdensity of the lesion. Generally, adenomas do not calcify; however, calcification is seen in 1% to 2%. Postcontrast CT shows moderate, inhomogeneous enhancement.
MR imaging appearance varies according to sequence. T1-weighted images show a lesion isointense to gray matter. T1 hyperintensity seen occasionally in the setting of subacute hemorrhage and intratumoral hemorrhage occurs in up to 10% to 15% of adenomas. The pituitary bright spot is displaced superiorly above the diaphragma sellae in 80% of cases, but may also be absent with larger adenomas. Following contrast, most adenomas demonstrate heterogeneous enhancement. Ultimately, tumors may grow beyond the pituitary capsule and can extend beyond the confines of the sella. In general, macroadenomas can extend superiorly into the suprasellar cistern; laterally into the cavernous sinus; or inferiorly into the sellar floor, clivus, or sphenoid sinus.
Suprasellar Extension
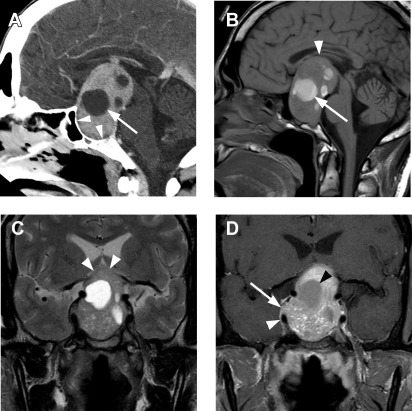
Classically, macroadenomas follow a path of least resistance: tumor growth occurs through the central opening in the diaphragma sellae into the suprasellar cistern. The circumlateral leaflets of the diaphragma sellae are initially displaced upward and can create a horizontal restriction of tumor growth, leading to the typical bilobed appearance in the coronal plane, with the lower sellar component of tumor separated partially from its upper suprasellar component. The classic appearance has been likened to a snowman ( Fig. 4 ). As tumor extends superiorly, microscopic invasion of the diaphragma sellae itself often occurs.
As tumor enlarges and extends vertically, it can contact, efface, displace, or compress the optic chiasm. Compression of the optic chiasm can produce a variety of visual deficits, including chiasmal syndrome. Pituitary adenomas are the most common lesions that produce chiasmal syndrome, followed by other lesions that cause extrinsic optic chiasm compression, such as meningiomas or craniopharyngiomas. Although bitemporal hemianopsia, defect of impaired peripheral vision in the temporal (outer) halves of the visual field of each eye, is often suggested as a classic finding associated with pituitary adenoma, actually it is rare. Rather, patients more often present with incomplete bitemporal visual defects or mixed defects.
There is no consensus on how best to measure the extent of suprasellar extension or the degree of optic chiasm displacement or compression. However, in general, the larger the tumor and greater the chiasm compression, the more likely the patient is to have more significant visual deficits.
Although no consensus exists, several radiologic reports in the past have used the term “giant macroadenoma” for a mass that exceeds 40 mm in greatest dimension. Symon and colleagues defined giant adenomas as those with an extension of more than 40 mm from the midline of planum sphenoidale in any direction or suprasellar extension to within 6 mm of the foramen of Monro. Other authors have reserved this term for tumors where the superior margin exceeded 20 mm above the planum sphenoidale. Giant macroadenomas are generally regarded as more aggressive, more difficult to resect, and more likely to recur ( Fig. 5 ).
Cavernous Sinus Invasion
Approximately 5% to 10% of all pituitary adenomas extend laterally beyond the margins of the adenohypophysis and sella, invading the adjacent cavernous sinus. Involvement of the cavernous sinus increases surgical procedure complexity, results in higher rates of residual/recurrent tumor, and is associated with persistent endocrine dysfunction. Definitions of cavernous sinus invasion have been variably based on radiologic, surgical, endoscopic, and microscopic criteria.
The microscopic interface between the pituitary and the cavernous sinus has been evaluated through histologic and microdissection techniques. Songtao and colleagues considered the outer pituitary wall as a two-layered membrane: an inner lamina propria adherent to the pituitary tissue; and a looser, outer pituitary capsule. The outer layer also serves as part of the medial wall of the cavernous sinus. In their description, the medial wall of the cavernous sinus consisted of a fibrous layer in addition to the pituitary capsule. As tumor extends laterally from the sella, it crosses the lamina propria, the pituitary capsule, the fibrous layer of the cavernous sinus, and finally, the endothelial lining of the venous compartment. The authors found that superior margin is thinner, which might explain why adenomas more often extend into the superior compartment of the cavernous sinus.
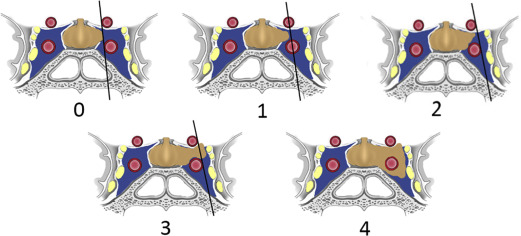
MR imaging is not reliable at distinguishing these microscopic layers separating the laterally convex pituitary gland from the medial cavernous sinus. MR imaging evaluation of invasion relies on macroscopic findings, such as the relationship of tumor to the cavernous ICA and extent of cavernous sinus involvement. In 1993, Knosp and colleagues introduced an MR imaging–based classification system to predict cavernous sinus invasion. This system was based on lateral tumor extent in relationship to a series of tangential lines drawn between the intracavernous and supracavernous ICAs seen on coronal MR images. This classification system defined five grades of invasion, ranging from 0 to 4 ( Fig. 6 ). The data showed that identification of tumor past the intercarotid line (grade 2 and higher) on coronal MR imaging was highly predictive of cavernous sinus invasion identified at surgery. Conversely, patients with grade 0 or grade 1 were unlikely to have definitive invasion. Their results also showed that the degree of cavernous invasion was directly related to tumor size.