PET Measurement of Myocardial Blood Flow
Henry Gewirtz
Introduction
The use of PET as a method for measuring myocardial blood flow (MBF) dates to the pioneering work of Schelbert, Gould, Bergmann, and Sobel in the late 1970s and early 1980s.1,2,3 The most commonly employed radiotracers used for this purpose have been O-15 water, N-13 ammonia, and rubidium-82.4,5 Initial efforts at making the technology clinically relevant were hampered by the need for an on-site cyclotron and associated infrastructure to produce the radionuclides. Accordingly, PET for measurement of myocardial blood flow (and metabolism) was largely confined to a few experimental laboratories in the United States and Europe.
The more recent commercialization and proliferation of PET scanners has been driven by the discovery that 18fluorodeoxyglucose (FDG), a relatively long-lived positron emitter (T 1/2 ~ 2 hours), is a tumor avid agent and so has been found to be helpful in the management of patients with many types of cancer.6,7,8 The 2-hour half-life of the isotope also meant that an on-site cyclotron was unnecessary since the tracer could be ordered from relatively nearby commercial facilities and shipped to hospitals and outpatient imaging centers equipped with PET scanners.
The development of a generator/delivery system for rubidium-829 has obviated the need for a cyclotron to produce an MBF tracer and, along with the proliferation of PET oncology, has fueled a substantial increase in PET myocardial perfusion studies. Accordingly, the technology has moved from being strictly a research tool requiring a substantial infrastructure of both human and material resources to a clinically applicable tool that is enjoying more widespread use all the time. As such, it behooves the cardiologist-in-training to be familiar with the technique and its major applications, as well as its strengths and weaknesses.
Methodologies
Positron Imaging
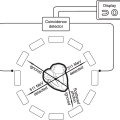
PET imaging differs fundamentally from standard SPECT in the following ways: The radiotracers employed for PET imaging are positron emitters, which move only a short distance in tissue (~1–4 mm) after which they encounter a negative electron (Figure 4.3). The encounter results in annihilation of both particles and the release of two 511 keV photons at 180° angles from one another. The 511 keV photons can be recognized by special detectors, commonly bismuth germanium oxide (BGO), housed in a gantry resembling that of a CT scanner, which surrounds the patient. Details of the mathematics and electronics required for image reconstruction are beyond the scope of this review. It is important, however, to point out that since two photons are involved for each annihilation event, it is possible to accurately position where the event took place (within the 1–4 mm distance the particle migrated prior to annihilation) and the number of true, as opposed to random (i.e., unpaired) events that occurred. Then, using a transmission scan of the patient typically obtained prior to injection of any radioactivity, it is possible to accurately correct for photon attenuation, which occurs as the 511 keV photons exit the body, and thereby determine with considerable accuracy not only where the events took place but how many there were (i.e., the quantity of tracer present in a given location at a given moment in time). The data are then fit to a tracer kinetic model (see below), which is used to define absolute myocardial blood flow (or metabolic parameters depending on tracer employed) in quantitative terms (Figures 4.4A and B).
Although well-accepted and extensively validated models exist for N-13 ammonia10,11,12 and O-15 water,33,13,14,15 the same is not true for rubidium-82, for which models have been published16,17 but generally have not been widely adopted.
Although well-accepted and extensively validated models exist for N-13 ammonia10,11,12 and O-15 water,33,13,14,15 the same is not true for rubidium-82, for which models have been published16,17 but generally have not been widely adopted.
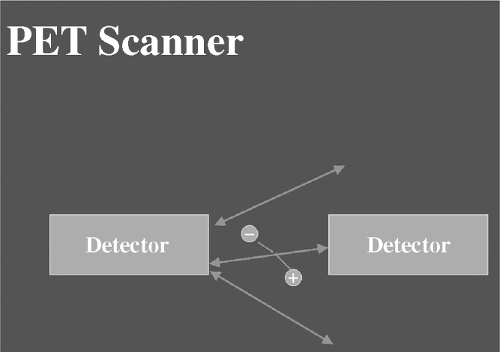 FIGURE 4.3 An illustration of a greatly simplified PET scanner is shown here. A positron (circle with plus) encounters an electron (circle with minus) and an annihilation event occurs with two 511 keV photons traveling away from one another at a 180° angle. Since both are in the field of view of the opposed detectors, the event is counted and can be accurately localized. Other events occurring outside the field of view of the two detectors are not recognized in this simplified example. PET, positron emission tomography. |
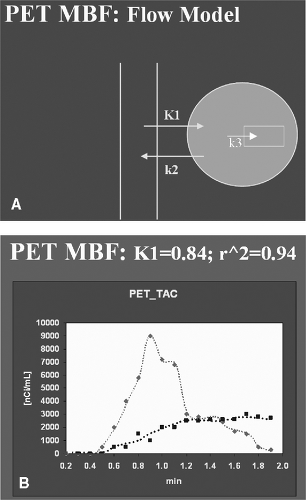 FIGURE 4.4 See color figure on website. (A) An illustration of a tracer kinetic model for MBF is shown here. The parameter K1 reflects MBF in mL/min/g. The terms k2 and k3 reflect back diffusion of the tracer into the blood and incorporation of the N-13 label into glutamine, respectively. (B) Time activity curves for left ventricle (red) and myocardium (blue) are shown here. The dotted lines represent the fit of the data to the tracer kinetic model shown schematically in Figure 4.4A. Note the robust fit of the data to the model (r2 = 0.94). The value of K1 (0.84) reflects MBF in mL/min/g but requires correction for incomplete extraction of the tracer (see text for details). MBF, myocardial blood flow; PET, positron emission tomography; TAC, time activity curve. |
Cyclotron Tracers and Kinetic Models
Radiolabeled O-15 water has been used extensively both for human and animal studies to measure myocardial blood flow.3,13,14,15 Image quality, as well as the requirement for an on-site cyclotron, have been problems for the tracer, which has a very short half-life (~120 seconds). Recently a single compartment exponential decay model for flow was combined with factor and cluster analysis to help improve image quality while at the same time accurately obtaining quantitative measurements of myocardial blood flow.18 Validation studies appear promising and there is even a study using a porcine model in which not only transmural but endocardial and epicardial blood flow measurements were obtained.18 Water is a freely diffusible molecule, so correction for extraction fraction per se is not required, though a correction factor for tissue water exchangeable volume has been incorporated into at least one commonly employed model.18 Whether or not this parameter is useful for determination of myocardial scar is a controversial issue19,20 and remains to be determined. The principal advantage of O-15 water is its brief half-life, which enables multiple measurements of MBF to be made in a short period of time—a feature that has primarily research but also clinical relevance.
N-13 ammonia also requires an on-site cyclotron for production and use since its half-life is ~10 minutes. The relatively short half-life permits multiple flow determination to be made in a relatively short period, but not nearly as rapidly as that with O-15 water. Typically 3–5 half-times must elapse before another measurement can be made, so even with a 10-minute half-life, at least 30 and preferably 50 minutes are required between successive flow measurements. Since ammonia is trapped in the myocardium by the glutamine synthase reaction, image quality is excellent and measurements of myocardial blood flow, especially at low flows, are very good and generally superior to that of O-15 water. Formal head-to-head comparisons of N-13 ammonia and O-15 water have yielded comparable values of absolute MBF in the same individual under a variety of flow conditions.21,22 The single exception to this statement is at low flow where N-13 ammonia appears to have an advantage over O-15 water when radiolabeled microspheres are used as the gold standard.21,22
A two-compartment tracer kinetic model is commonly employed for absolute measurements of MBF with N-13 ammonia, with K1 being the parameter that reflects flow.10,11 It should be noted that at high flow N-13 ammonia, like other extractable tracers, is not taken up in the myocardium in direct proportion to blood flow, so it is necessary to correct values of K1 for roll-off at high flow rates.12 The tracer kinetic model has been implemented on a pixel-by-pixel basis in order to provide parametric K1 images (Figures 4.5A and B), which, in contrast to delayed summed images of tracer activity, provide a direct picture of MBF.11


Related posts:

Stay updated, free articles. Join our Telegram channel
Full access? Get Clinical Tree
